Grundläggande statistik
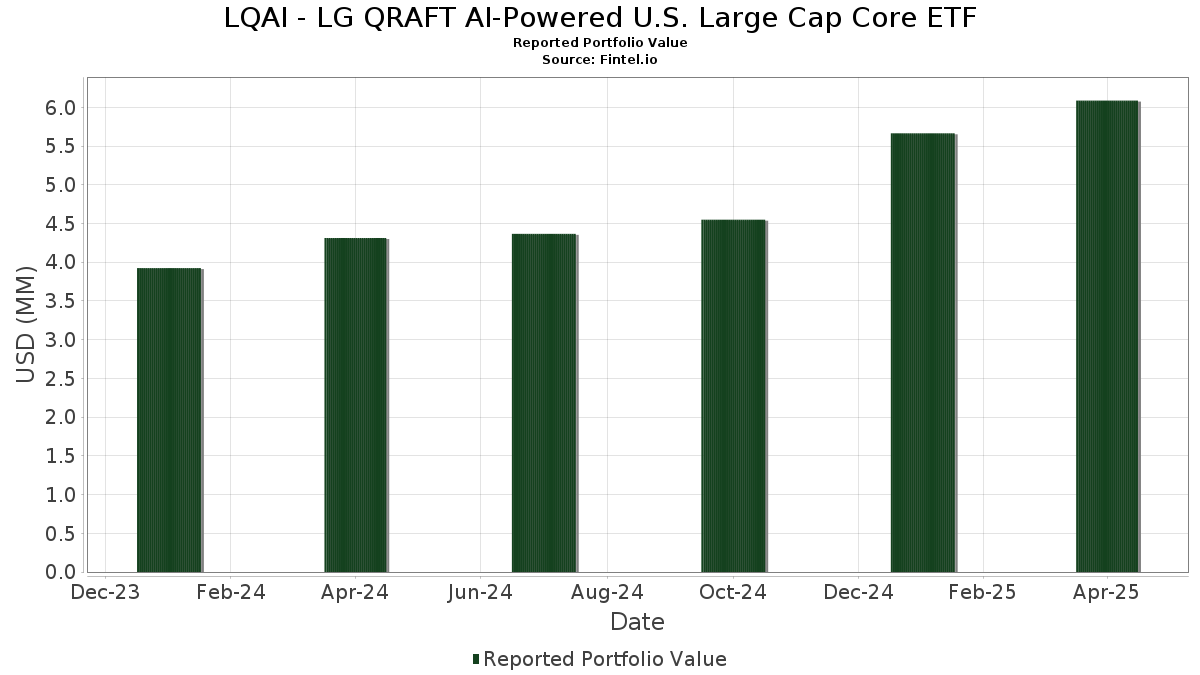
| Portföljvärde | $ 6 087 010 |
| Aktuella positioner | 101 |
Senaste innehav, resultat, förvaltat kapital (från 13F, 13D)
LQAI - LG QRAFT AI-Powered U.S. Large Cap Core ETF har redovisat 101 totala innehav i sina senaste SEC-arkiveringar. Det senaste portföljvärdet beräknas vara $ 6 087 010 USD. Faktiskt förvaltade tillgångar (AUM) är detta värde plus likvida medel (som inte redovisas). LQAI - LG QRAFT AI-Powered U.S. Large Cap Core ETFs största innehav är Microsoft Corporation (US:MSFT) , Netflix, Inc. (US:NFLX) , NVIDIA Corporation (US:NVDA) , Amazon.com, Inc. (US:AMZN) , and Alphabet Inc. (US:GOOGL) . LQAI - LG QRAFT AI-Powered U.S. Large Cap Core ETFs nya positioner inkluderar Berkshire Hathaway Inc. (US:BRK.B) , General Mills, Inc. (US:GIS) , McDonald's Corporation (US:MCD) , Rollins, Inc. (US:ROL) , and Mettler-Toledo International Inc. (US:MTD) .
Största ökningarna detta kvartal
Vi använder förändringen i portföljallokeringen eftersom det är det mest meningsfulla måttet. Förändringar kan bero på transaktioner eller förändringar i aktiekurser.
| Värdepapper | Aktier (MM) |
Värde (MM$) |
Portfölj % av | ΔPortfölj % av |
|---|---|---|---|---|
| 0,00 | 0,32 | 5,2421 | 5,0010 | |
| 0,00 | 0,13 | 2,0671 | 2,0671 | |
| 0,00 | 0,12 | 2,0186 | 1,4552 | |
| 0,00 | 0,18 | 3,0002 | 1,0923 | |
| 0,00 | 0,11 | 1,7402 | 1,0678 | |
| 0,00 | 0,06 | 1,0324 | 1,0324 | |
| 0,00 | 0,08 | 1,3459 | 1,0091 | |
| 0,00 | 0,09 | 1,4068 | 0,9348 | |
| 0,00 | 0,09 | 1,4761 | 0,8840 | |
| 0,00 | 0,05 | 0,8450 | 0,8450 |
Största minskningarna detta kvartal
Vi använder förändringen i portföljallokeringen eftersom det är det mest meningsfulla måttet. Förändringar kan bero på transaktioner eller förändringar i aktiepriser.
| Värdepapper | Aktier (MM) |
Värde (MM$) |
Portfölj % av | ΔPortfölj % av |
|---|---|---|---|---|
| 0,00 | 0,09 | 1,5387 | −4,2115 | |
| 0,00 | 0,02 | 0,2572 | −2,8913 | |
| 0,00 | 0,02 | 0,2953 | −2,8510 | |
| 0,00 | 0,01 | 0,1503 | −1,8410 | |
| 0,00 | 0,14 | 2,2544 | −1,7801 | |
| 0,00 | 0,01 | 0,0999 | −1,2485 | |
| 0,00 | 0,01 | 0,1151 | −1,1640 | |
| 0,00 | 0,01 | 0,1143 | −1,1579 | |
| 0,00 | 0,23 | 3,7713 | −1,0860 | |
| 0,00 | 0,02 | 0,3918 | −1,0824 |
13F- och fond arkiveringar
Denna blankett lämnades in den 2025-06-26 för rapporteringsperioden 2025-04-30. Klicka på länksymbolen för att se hela transaktionshistoriken.
Uppgradera för att låsa upp premiumdata och exportera till Excel![]() .
.
| Värdepapper | Typ | Genomsnittligt aktiepris | Aktier (MM) |
ΔAktier (%) |
ΔAktier (%) |
Värde ($MM) |
Portfölj (%) |
ΔPortfölj (%) |
|
|---|---|---|---|---|---|---|---|---|---|
| MSFT / Microsoft Corporation | 0,00 | 8,15 | 0,40 | 3,11 | 6,5443 | −0,2767 | |||
| NFLX / Netflix, Inc. | 0,00 | 1 914,29 | 0,32 | 2 353,85 | 5,2421 | 5,0010 | |||
| NVDA / NVIDIA Corporation | 0,00 | 19,71 | 0,30 | 8,76 | 4,9003 | 0,0562 | |||
| AMZN / Amazon.com, Inc. | 0,00 | 7,42 | 0,23 | −16,73 | 3,7713 | −1,0860 | |||
| GOOGL / Alphabet Inc. | 0,00 | 47,49 | 0,23 | 15,15 | 3,7508 | 0,2433 | |||
| AAPL / Apple Inc. | 0,00 | 21,22 | 0,20 | 9,34 | 3,2705 | 0,0538 | |||
| PLTR / Palantir Technologies Inc. | 0,00 | −37,42 | 0,19 | −10,14 | 3,0621 | −0,5960 | |||
| AVGO / Broadcom Inc. | 0,00 | 94,07 | 0,18 | 68,52 | 3,0002 | 1,0923 | |||
| META / Meta Platforms, Inc. | 0,00 | −24,70 | 0,14 | −39,91 | 2,2544 | −1,7801 | |||
| AMCR / Amcor plc | 0,01 | 74,07 | 0,13 | 64,47 | 2,0672 | 0,7203 | |||
| BRK.B / Berkshire Hathaway Inc. | 0,00 | 0,13 | 2,0671 | 2,0671 | |||||
| CNP / CenterPoint Energy, Inc. | 0,00 | 223,04 | 0,12 | 293,55 | 2,0186 | 1,4552 | |||
| F / Ford Motor Company | 0,01 | 76,56 | 0,12 | 76,12 | 1,9502 | 0,7561 | |||
| COST / Costco Wholesale Corporation | 0,00 | 78,79 | 0,12 | 82,81 | 1,9275 | 0,7872 | |||
| WMT / Walmart Inc. | 0,00 | 28,52 | 0,11 | 26,97 | 1,8641 | 0,2926 | |||
| PCG / PG&E Corporation | 0,01 | 134,52 | 0,11 | 91,23 | 1,8028 | 0,5457 | |||
| JNPR / Juniper Networks, Inc. | 0,00 | 166,64 | 0,11 | 176,32 | 1,7402 | 1,0678 | |||
| T / AT&T Inc. | 0,00 | 3,60 | 0,11 | 20,69 | 1,7303 | 0,1943 | |||
| VTRS / Viatris Inc. | 0,01 | 81,66 | 0,10 | 32,43 | 1,6110 | −0,0213 | |||
| PPL / PPL Corporation | 0,00 | 27,42 | 0,10 | 38,57 | 1,5966 | 0,3583 | |||
| HST / Host Hotels & Resorts, Inc. | 0,01 | 41,50 | 0,10 | 15,66 | 1,5848 | −0,2422 | |||
| CAG / Conagra Brands, Inc. | 0,00 | 184,04 | 0,09 | 135,00 | 1,5460 | 0,6150 | |||
| TSLA / Tesla, Inc. | 0,00 | −58,81 | 0,09 | −71,47 | 1,5387 | −4,2115 | |||
| HRL / Hormel Foods Corporation | 0,00 | 146,24 | 0,09 | 142,11 | 1,5274 | 0,6806 | |||
| KDP / Keurig Dr Pepper Inc. | 0,00 | 148,37 | 0,09 | 169,70 | 1,4761 | 0,8840 | |||
| CPB / The Campbell's Company | 0,00 | 409,54 | 0,09 | 304,76 | 1,4068 | 0,9348 | |||
| KHC / The Kraft Heinz Company | 0,00 | 268,13 | 0,09 | 226,92 | 1,4024 | 0,8172 | |||
| KVUE / Kenvue Inc. | 0,00 | 3,68 | 0,08 | 15,28 | 1,3664 | 0,0901 | |||
| KIM / Kimco Realty Corporation | 0,00 | 533,85 | 0,08 | 440,00 | 1,3459 | 1,0091 | |||
| FE / FirstEnergy Corp. | 0,00 | 0,12 | 0,07 | 7,35 | 1,2086 | 0,0058 | |||
| VICI / VICI Properties Inc. | 0,00 | 7,01 | 0,07 | 7,81 | 1,1408 | −0,2720 | |||
| EXC / Exelon Corporation | 0,00 | 72,51 | 0,06 | 103,23 | 1,0392 | 0,4877 | |||
| LKQ / LKQ Corporation | 0,00 | 0,06 | 1,0324 | 1,0324 | |||||
| VZ / Verizon Communications Inc. | 0,00 | 42,45 | 0,06 | 56,76 | 0,9690 | 0,3162 | |||
| AON / Aon plc | 0,00 | 0,05 | 0,8450 | 0,8450 | |||||
| YUM / Yum! Brands, Inc. | 0,00 | 697,62 | 0,05 | 900,00 | 0,8278 | 0,7069 | |||
| MO / Altria Group, Inc. | 0,00 | −4,01 | 0,05 | 4,26 | 0,8132 | −0,2290 | |||
| BEN / Franklin Resources, Inc. | 0,00 | 15,62 | 0,05 | −2,04 | 0,7962 | −0,0802 | |||
| HBAN / Huntington Bancshares Incorporated | 0,00 | −27,40 | 0,05 | −39,19 | 0,7480 | −0,5613 | |||
| TXN / Texas Instruments Incorporated | 0,00 | 996,00 | 0,04 | 760,00 | 0,7203 | 0,6089 | |||
| CHTR / Charter Communications, Inc. | 0,00 | 18,48 | 0,04 | 23,53 | 0,7016 | −0,0983 | |||
| NWSA / News Corporation | 0,00 | −4,64 | 0,04 | −6,82 | 0,6771 | −0,1133 | |||
| NI / NiSource Inc. | 0,00 | 130,26 | 0,04 | 141,18 | 0,6745 | 0,3746 | |||
| MNST / Monster Beverage Corporation | 0,00 | 36,27 | 0,04 | 69,57 | 0,6567 | 0,2376 | |||
| GIS / General Mills, Inc. | 0,00 | 0,04 | 0,6496 | 0,6496 | |||||
| MCD / McDonald's Corporation | 0,00 | 0,04 | 0,6458 | 0,6458 | |||||
| CSX / CSX Corporation | 0,00 | −46,48 | 0,04 | −54,88 | 0,6169 | −0,8321 | |||
| ROL / Rollins, Inc. | 0,00 | 0,04 | 0,6071 | 0,6071 | |||||
| RMD / ResMed Inc. | 0,00 | 110,81 | 0,04 | 111,76 | 0,6062 | 0,2125 | |||
| XEL / Xcel Energy Inc. | 0,00 | 55,93 | 0,04 | 71,43 | 0,5957 | 0,1134 | |||
| NEM / Newmont Corporation | 0,00 | 0,04 | 0,5806 | 0,5806 | |||||
| MTD / Mettler-Toledo International Inc. | 0,00 | 0,04 | 0,5803 | 0,5803 | |||||
| TAP / Molson Coors Beverage Company | 0,00 | 59,89 | 0,03 | 78,95 | 0,5651 | 0,1125 | |||
| KO / The Coca-Cola Company | 0,00 | −3,31 | 0,03 | 10,00 | 0,5565 | 0,0159 | |||
| INVH / Invitation Homes Inc. | 0,00 | 46,21 | 0,03 | 57,14 | 0,5526 | 0,0887 | |||
| STZ / Constellation Brands, Inc. | 0,00 | 193,10 | 0,03 | 210,00 | 0,5237 | 0,3388 | |||
| PKI / Revvity Inc. | 0,00 | 28,92 | 0,03 | 16,00 | 0,4926 | −0,0987 | |||
| CVX / Chevron Corporation | 0,00 | 494,59 | 0,03 | 480,00 | 0,4917 | 0,3708 | |||
| UNH / UnitedHealth Group Incorporated | 0,00 | 233,33 | 0,03 | 154,55 | 0,4731 | 0,2722 | |||
| AVY / Avery Dennison Corporation | 0,00 | 0,03 | 0,4553 | 0,4553 | |||||
| LHX / L3Harris Technologies, Inc. | 0,00 | 0,03 | 0,4481 | 0,4481 | |||||
| ARE / Alexandria Real Estate Equities, Inc. | 0,00 | 0,03 | 0,4452 | 0,4452 | |||||
| DLTR / Dollar Tree, Inc. | 0,00 | 428,33 | 0,03 | 257,14 | 0,4258 | 0,2261 | |||
| KMI / Kinder Morgan, Inc. | 0,00 | −70,23 | 0,02 | −64,06 | 0,3918 | −1,0824 | |||
| VRTX / Vertex Pharmaceuticals Incorporated | 0,00 | 91,30 | 0,02 | 120,00 | 0,3682 | 0,1810 | |||
| ERIE / Erie Indemnity Company | 0,00 | 0,02 | 0,3593 | 0,3593 | |||||
| CME / CME Group Inc. | 0,00 | 0,02 | 0,3459 | 0,3459 | |||||
| BBH SWEEP VEHICLE / STIV (N/A) | 0,02 | 0,3166 | 0,3166 | ||||||
| LLY / Eli Lilly and Company | 0,00 | −90,91 | 0,02 | −90,45 | 0,2953 | −2,8510 | |||
| JPM / JPMorgan Chase & Co. | 0,00 | −90,42 | 0,02 | −91,57 | 0,2572 | −2,8913 | |||
| ABT / Abbott Laboratories | 0,00 | −59,04 | 0,01 | −53,33 | 0,2384 | −0,4359 | |||
| COR / Cencora, Inc. | 0,00 | 63,33 | 0,01 | 100,00 | 0,2356 | 0,1011 | |||
| LMT / Lockheed Martin Corporation | 0,00 | 0,01 | 0,2354 | 0,2354 | |||||
| DG / Dollar General Corporation | 0,00 | 29,46 | 0,01 | −7,14 | 0,2231 | −0,1538 | |||
| V / Visa Inc. | 0,00 | 69,57 | 0,01 | 85,71 | 0,2213 | 0,0827 | |||
| PM / Philip Morris International Inc. | 0,00 | 0,01 | 0,2139 | 0,2139 | |||||
| BAC / Bank of America Corporation | 0,00 | −66,36 | 0,01 | −67,50 | 0,2135 | −0,6758 | |||
| INTC / Intel Corporation | 0,00 | −77,68 | 0,01 | −77,78 | 0,2057 | −0,7505 | |||
| CMCSA / Comcast Corporation | 0,00 | −56,70 | 0,01 | −57,14 | 0,2050 | −0,2953 | |||
| MOH / Molina Healthcare, Inc. | 0,00 | 0,01 | 0,1934 | 0,1934 | |||||
| TGT / Target Corporation | 0,00 | 0,01 | 0,1906 | 0,1906 | |||||
| HUM / Humana Inc. | 0,00 | 144,44 | 0,01 | 83,33 | 0,1895 | 0,0161 | |||
| JNJ / Johnson & Johnson | 0,00 | 0,01 | 0,1874 | 0,1874 | |||||
| GILD / Gilead Sciences, Inc. | 0,00 | 25,88 | 0,01 | 37,50 | 0,1872 | 0,0416 | |||
| WRB / W. R. Berkley Corporation | 0,00 | −76,63 | 0,01 | −71,05 | 0,1813 | −0,5023 | |||
| HD / The Home Depot, Inc. | 0,00 | 0,01 | 0,1776 | 0,1776 | |||||
| PEP / PepsiCo, Inc. | 0,00 | −1,43 | 0,01 | −18,18 | 0,1537 | −0,1015 | |||
| AMD / Advanced Micro Devices, Inc. | 0,00 | −90,35 | 0,01 | −91,96 | 0,1503 | −1,8410 | |||
| MDLZ / Mondelez International, Inc. | 0,00 | 0,01 | 0,1466 | 0,1466 | |||||
| AWC / American Water Works Company, Inc. | 0,00 | 0,01 | 0,1449 | 0,1449 | |||||
| HPE / Hewlett Packard Enterprise Company | 0,00 | −27,78 | 0,01 | −46,15 | 0,1212 | −0,1142 | |||
| ON / ON Semiconductor Corporation | 0,00 | 0,01 | 0,1200 | 0,1200 | |||||
| MU / Micron Technology, Inc. | 0,00 | −43,29 | 0,01 | −50,00 | 0,1175 | −0,1463 | |||
| WBD / Warner Bros. Discovery, Inc. | 0,00 | −88,37 | 0,01 | −90,28 | 0,1151 | −1,1640 | |||
| KEY / KeyCorp | 0,00 | −88,31 | 0,01 | −91,67 | 0,1143 | −1,1579 | |||
| LULU / lululemon athletica inc. | 0,00 | 0,01 | 0,1112 | 0,1112 | |||||
| NKE / NIKE, Inc. | 0,00 | 0,01 | 0,1093 | 0,1093 | |||||
| LYB / LyondellBasell Industries N.V. | 0,00 | 0,01 | 0,1080 | 0,1080 | |||||
| SWK / Stanley Black & Decker, Inc. | 0,00 | 0,01 | 0,1075 | 0,1075 | |||||
| SMCI / Super Micro Computer, Inc. | 0,00 | −69,54 | 0,01 | −66,67 | 0,1015 | −0,2188 | |||
| KMX / CarMax, Inc. | 0,00 | −89,02 | 0,01 | −89,66 | 0,0999 | −1,2485 | |||
| EPAM / EPAM Systems, Inc. | 0,00 | −100,00 | 0,00 | −100,00 | −0,1657 | ||||
| AJG / Arthur J. Gallagher & Co. | 0,00 | −100,00 | 0,00 | −100,00 | −0,1703 | ||||
| TSCO / Tractor Supply Company | 0,00 | −100,00 | 0,00 | −100,00 | −0,1898 | ||||
| WYNN / Wynn Resorts, Limited | 0,00 | −100,00 | 0,00 | −100,00 | −0,6080 | ||||
| D / Dominion Energy, Inc. | 0,00 | −100,00 | 0,00 | −100,00 | −0,6362 | ||||
| FICO / Fair Isaac Corporation | 0,00 | −100,00 | 0,00 | −100,00 | −0,4295 | ||||
| SCHW / The Charles Schwab Corporation | 0,00 | −100,00 | 0,00 | −100,00 | −0,4813 | ||||
| BX / Blackstone Inc. | 0,00 | −100,00 | 0,00 | −100,00 | −0,8276 | ||||
| ADBE / Adobe Inc. | 0,00 | −100,00 | 0,00 | −100,00 | −0,2005 | ||||
| PNC / The PNC Financial Services Group, Inc. | 0,00 | −100,00 | 0,00 | −100,00 | −0,5102 | ||||
| STX / Seagate Technology Holdings plc | 0,00 | −100,00 | 0,00 | −100,00 | −0,5454 | ||||
| AME / AMETEK, Inc. | 0,00 | −100,00 | 0,00 | −100,00 | −0,4849 | ||||
| RCL / Royal Caribbean Cruises Ltd. | 0,00 | −100,00 | 0,00 | −100,00 | −0,1833 | ||||
| CDW / CDW Corporation | 0,00 | −100,00 | 0,00 | −100,00 | −0,1580 | ||||
| PCAR / PACCAR Inc | 0,00 | −100,00 | 0,00 | −100,00 | −0,1388 | ||||
| DE / Deere & Company | 0,00 | −100,00 | 0,00 | −100,00 | −0,4538 | ||||
| CPRT / Copart, Inc. | 0,00 | −100,00 | 0,00 | −100,00 | −0,1205 | ||||
| NOW / ServiceNow, Inc. | 0,00 | −100,00 | 0,00 | −100,00 | −0,1257 |