Grundläggande statistik
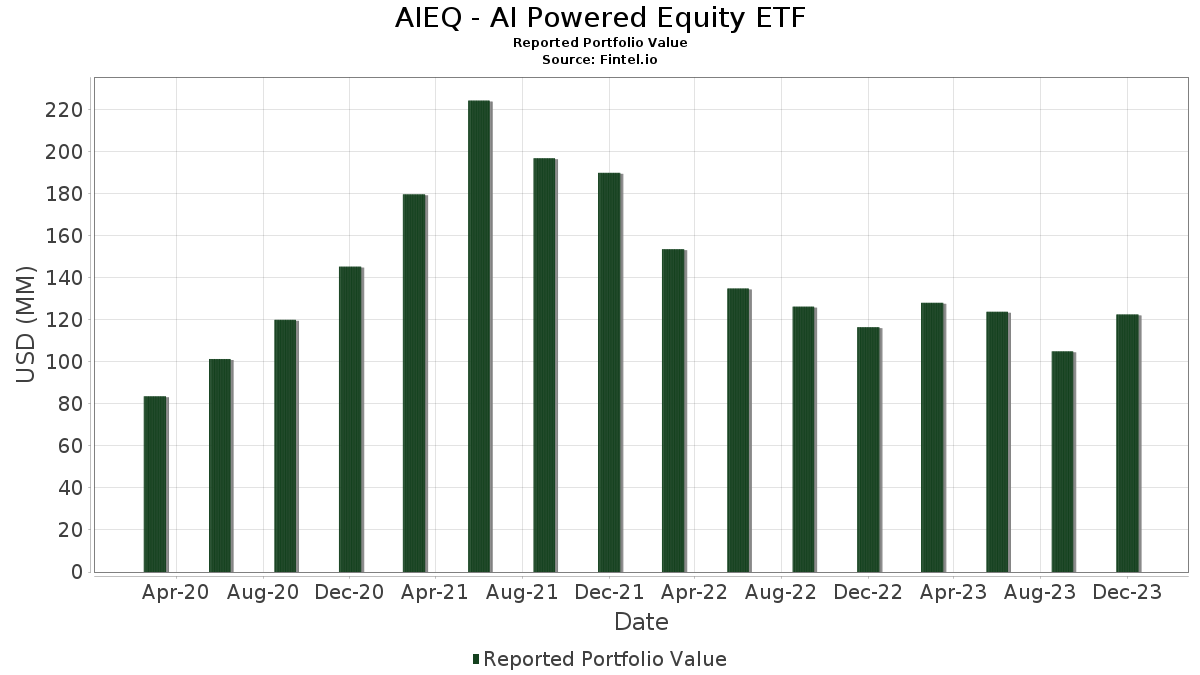
| Portföljvärde | $ 122 549 263 |
| Aktuella positioner | 115 |
Senaste innehav, resultat, förvaltat kapital (från 13F, 13D)
AIEQ - AI Powered Equity ETF har redovisat 115 totala innehav i sina senaste SEC-arkiveringar. Det senaste portföljvärdet beräknas vara $ 122 549 263 USD. Faktiskt förvaltade tillgångar (AUM) är detta värde plus likvida medel (som inte redovisas). AIEQ - AI Powered Equity ETFs största innehav är Eli Lilly and Company (US:LLY) , Las Vegas Sands Corp. (US:LVS) , Constellation Brands, Inc. (US:STZ) , Air Products and Chemicals, Inc. (US:APD) , and EOG Resources, Inc. (US:EOG) . AIEQ - AI Powered Equity ETFs nya positioner inkluderar Las Vegas Sands Corp. (US:LVS) , Weatherford International plc (US:WFRD) , Paycom Software, Inc. (US:PAYC) , Doximity, Inc. (US:DOCS) , and Polaris Inc. (US:PII) .
Största ökningarna detta kvartal
Vi använder förändringen i portföljallokeringen eftersom det är det mest meningsfulla måttet. Förändringar kan bero på transaktioner eller förändringar i aktiekurser.
| Värdepapper | Aktier (MM) |
Värde (MM$) |
Portfölj % av | ΔPortfölj % av |
|---|---|---|---|---|
| 0,01 | 5,52 | 4,8053 | 4,8053 | |
| 7,63 | 7,63 | 6,6368 | 3,5972 | |
| 0,08 | 4,13 | 3,5963 | 3,5963 | |
| 0,04 | 3,91 | 3,4053 | 3,4053 | |
| 0,11 | 3,91 | 3,4020 | 3,4020 | |
| 0,03 | 3,95 | 3,4396 | 2,8874 | |
| 0,02 | 4,09 | 3,5582 | 2,6735 | |
| 0,01 | 2,96 | 2,5733 | 2,5733 | |
| 0,04 | 2,37 | 2,0595 | 2,0595 | |
| 0,07 | 1,84 | 1,5982 | 1,5982 |
Största minskningarna detta kvartal
Vi använder förändringen i portföljallokeringen eftersom det är det mest meningsfulla måttet. Förändringar kan bero på transaktioner eller förändringar i aktiepriser.
| Värdepapper | Aktier (MM) |
Värde (MM$) |
Portfölj % av | ΔPortfölj % av |
|---|---|---|---|---|
| 0,00 | 0,00 | −4,6391 | ||
| 0,00 | 0,00 | −4,3583 | ||
| 0,00 | 0,73 | 0,6350 | −2,3092 | |
| 0,00 | 0,00 | −2,2757 | ||
| 0,00 | 1,16 | 1,0091 | −1,8994 | |
| 0,00 | 0,00 | −1,7356 | ||
| 0,00 | 0,00 | −1,6753 | ||
| 0,00 | 0,00 | −1,5856 | ||
| 0,00 | 0,00 | −1,5350 | ||
| 0,00 | 1,19 | 1,0321 | −1,5335 |
13F- och fond arkiveringar
Denna blankett lämnades in den 2024-02-28 för rapporteringsperioden 2023-12-31. Klicka på länksymbolen för att se hela transaktionshistoriken.
Uppgradera för att låsa upp premiumdata och exportera till Excel![]() .
.
| Värdepapper | Typ | Genomsnittligt aktiepris | Aktier (MM) |
ΔAktier (%) |
ΔAktier (%) |
Värde ($MM) |
Portfölj (%) |
ΔPortfölj (%) |
|
|---|---|---|---|---|---|---|---|---|---|
| Mount Vernon Liquid Assets Portfolio, LLC / STIV (N/A) | 7,63 | 146,11 | 7,63 | 146,16 | 6,6368 | 3,5972 | |||
| LLY / Eli Lilly and Company | 0,01 | 5,52 | 4,8053 | 4,8053 | |||||
| LVS / Las Vegas Sands Corp. | 0,08 | 4,13 | 3,5963 | 3,5963 | |||||
| STZ / Constellation Brands, Inc. | 0,02 | 183,89 | 4,09 | 173,44 | 3,5582 | 2,6735 | |||
| APD / Air Products and Chemicals, Inc. | 0,01 | 37,27 | 4,04 | 30,84 | 3,5189 | 0,7493 | |||
| EOG / EOG Resources, Inc. | 0,03 | 567,48 | 3,95 | 622,49 | 3,4396 | 2,8874 | |||
| WFRD / Weatherford International plc | 0,04 | 3,91 | 3,4053 | 3,4053 | |||||
| APA / APA Corporation | 0,11 | 3,91 | 3,4020 | 3,4020 | |||||
| TSLA / Tesla, Inc. | 0,02 | −17,81 | 3,86 | −1,56 | 3,3604 | −0,1554 | |||
| PAYC / Paycom Software, Inc. | 0,01 | 2,96 | 2,5733 | 2,5733 | |||||
| CELH / Celsius Holdings, Inc. | 0,04 | 2,37 | 2,0595 | 2,0595 | |||||
| CTLT / Catalent, Inc. | 0,05 | −5,07 | 2,20 | −1,66 | 1,9133 | −0,0275 | |||
| DOCS / Doximity, Inc. | 0,07 | 1,84 | 1,5982 | 1,5982 | |||||
| PCTY / Paylocity Holding Corporation | 0,01 | 42,57 | 1,73 | −0,52 | 1,5063 | 0,4771 | |||
| LTHM / Livent Corporation | 0,08 | 1,41 | 1,2284 | 1,2284 | |||||
| PII / Polaris Inc. | 0,01 | 1,37 | 1,1941 | 1,1941 | |||||
| VAC / Marriott Vacations Worldwide Corporation | 0,02 | 1,33 | 1,1606 | 1,1606 | |||||
| QDEL / QuidelOrtho Corporation | 0,02 | 1,33 | 1,1594 | 1,1594 | |||||
| AGL / agilon health, inc. | 0,10 | 1,30 | 1,1345 | 1,1345 | |||||
| FOXA / Fox Corporation | 0,04 | 1,25 | 1,0878 | 1,0878 | |||||
| HUM / Humana Inc. | 0,00 | 24,63 | 1,21 | 22,00 | 1,0521 | 0,1238 | |||
| AZO / AutoZone, Inc. | 0,00 | 38,74 | 1,19 | 43,86 | 1,0395 | 0,3186 | |||
| MNST / Monster Beverage Corporation | 0,02 | 1,19 | 1,0382 | 1,0382 | |||||
| MMC / Marsh & McLennan Companies, Inc. | 0,01 | 1,19 | 1,0369 | 1,0369 | |||||
| AON / Aon plc | 0,00 | 409,84 | 1,19 | 356,32 | 1,0368 | 0,8511 | |||
| KDP / Keurig Dr Pepper Inc. | 0,04 | 1,19 | 1,0352 | 1,0352 | |||||
| PG / The Procter & Gamble Company | 0,01 | 1,19 | 1,0348 | 1,0348 | |||||
| MO / Altria Group, Inc. | 0,03 | 0,68 | 1,19 | −3,41 | 1,0347 | −0,1729 | |||
| NVDA / NVIDIA Corporation | 0,00 | −60,17 | 1,19 | −54,65 | 1,0321 | −1,5335 | |||
| LBRDA / Liberty Broadband Corporation | 0,00 | 1,18 | 1,0228 | 1,0228 | |||||
| DKNG / DraftKings Inc. | 0,03 | 1,17 | 1,0209 | 1,0209 | |||||
| BKR / Baker Hughes Company | 0,03 | 1,17 | 1,0208 | 1,0208 | |||||
| UAL / United Airlines Holdings, Inc. | 0,03 | 1,17 | 1,0192 | 1,0192 | |||||
| FTNT / Fortinet, Inc. | 0,02 | 136,94 | 1,17 | 108,94 | 1,0166 | 0,5148 | |||
| HAL / Halliburton Company | 0,03 | −26,45 | 1,17 | −29,78 | 1,0156 | −0,1651 | |||
| XOM / Exxon Mobil Corporation | 0,01 | 498,51 | 1,17 | 589,35 | 1,0138 | 0,8423 | |||
| KR / The Kroger Co. | 0,03 | 607,45 | 1,16 | 583,53 | 1,0119 | 0,8526 | |||
| WBD / Warner Bros. Discovery, Inc. | 0,10 | 1,16 | 1,0119 | 1,0119 | |||||
| SLB / Schlumberger Limited | 0,02 | 1,16 | 1,0118 | 1,0118 | |||||
| BDX / Becton, Dickinson and Company | 0,00 | −75,67 | 1,16 | −76,42 | 1,0091 | −1,8994 | |||
| MDB / MongoDB, Inc. | 0,00 | 1,16 | 1,0086 | 1,0086 | |||||
| OVV / Ovintiv Inc. | 0,03 | 1,16 | 1,0077 | 1,0077 | |||||
| FCNCA / First Citizens BancShares, Inc. | 0,00 | 531,01 | 1,16 | 548,88 | 1,0051 | 0,8305 | |||
| LCID / Lucid Group, Inc. | 0,27 | 1,15 | 1,0023 | 1,0023 | |||||
| MRO / Marathon Oil Corporation | 0,05 | −54,78 | 1,15 | −54,44 | 1,0015 | −1,2609 | |||
| TTD / The Trade Desk, Inc. | 0,02 | −62,33 | 1,15 | −64,96 | 1,0000 | −0,8937 | |||
| PLUG / Plug Power Inc. | 0,25 | 209,41 | 1,12 | 34,01 | 0,9703 | 0,2479 | |||
| BBY / Best Buy Co., Inc. | 0,01 | 1,02 | 0,8875 | 0,8875 | |||||
| NXST / Nexstar Media Group, Inc. | 0,01 | 347,86 | 0,95 | 391,24 | 0,8296 | 0,6386 | |||
| ROK / Rockwell Automation, Inc. | 0,00 | 0,93 | 0,8076 | 0,8076 | |||||
| HUN / Huntsman Corporation | 0,04 | 0,92 | 0,8012 | 0,8012 | |||||
| CFLT / Confluent, Inc. | 0,04 | 0,91 | 0,7926 | 0,7926 | |||||
| WTRG / Essential Utilities, Inc. | 0,02 | 419,13 | 0,89 | 387,91 | 0,7735 | 0,6146 | |||
| HES / Hess Corporation | 0,01 | 0,83 | 0,7232 | 0,7232 | |||||
| CHK / Chesapeake Energy Corporation | 0,01 | 54,43 | 0,82 | 42,07 | 0,7179 | 0,2134 | |||
| CIEN / Ciena Corporation | 0,02 | 817,07 | 0,79 | 942,11 | 0,6900 | 0,6080 | |||
| GLW / Corning Incorporated | 0,03 | 0,79 | 0,6835 | 0,6835 | |||||
| ALGN / Align Technology, Inc. | 0,00 | 53,57 | 0,75 | 37,75 | 0,6514 | 0,1186 | |||
| AFL / Aflac Incorporated | 0,01 | 0,73 | 0,6374 | 0,6374 | |||||
| AJG / Arthur J. Gallagher & Co. | 0,00 | −88,93 | 0,73 | −85,35 | 0,6350 | −2,3092 | |||
| BILL / BILL Holdings, Inc. | 0,01 | 0,72 | 0,6273 | 0,6273 | |||||
| OKE / ONEOK, Inc. | 0,01 | 24,21 | 0,71 | 41,32 | 0,6164 | 0,1812 | |||
| ACGL / Arch Capital Group Ltd. | 0,01 | 0,66 | 0,5734 | 0,5734 | |||||
| WEC / WEC Energy Group, Inc. | 0,01 | 0,64 | 0,5595 | 0,5595 | |||||
| KMX / CarMax, Inc. | 0,01 | 0,63 | 0,5493 | 0,5493 | |||||
| GM / General Motors Company | 0,02 | −56,68 | 0,60 | −52,82 | 0,5183 | −0,7194 | |||
| HP / Helmerich & Payne, Inc. | 0,02 | 0,59 | 0,5173 | 0,5173 | |||||
| LPLA / LPL Financial Holdings Inc. | 0,00 | 0,58 | 0,5017 | 0,5017 | |||||
| BIO / Bio-Rad Laboratories, Inc. | 0,00 | 0,55 | 0,4813 | 0,4813 | |||||
| MKC / McCormick & Company, Incorporated | 0,01 | 0,54 | 0,4701 | 0,4701 | |||||
| GPC / Genuine Parts Company | 0,00 | 0,53 | 0,4582 | 0,4582 | |||||
| LBRDK / Liberty Broadband Corporation | 0,01 | 42,10 | 0,51 | 43,18 | 0,4476 | 0,1352 | |||
| MHK / Mohawk Industries, Inc. | 0,00 | 40,28 | 0,50 | 40,78 | 0,4392 | 0,1278 | |||
| US4039491000 / HF Sinclair Corp. | 0,01 | 0,50 | 0,4332 | 0,4332 | |||||
| FOXF / Fox Factory Holding Corp. | 0,01 | 0,49 | 0,4304 | 0,4304 | |||||
| BMRN / BioMarin Pharmaceutical Inc. | 0,01 | 0,49 | 0,4256 | 0,4256 | |||||
| HAS / Hasbro, Inc. | 0,01 | 0,48 | 0,4220 | 0,4220 | |||||
| BFB / Brown-Forman Corp. - Class B | 0,01 | −58,90 | 0,44 | −66,59 | 0,3843 | −0,8516 | |||
| SJM / The J. M. Smucker Company | 0,00 | 0,43 | 0,3784 | 0,3784 | |||||
| NOV / NOV Inc. | 0,02 | 39,20 | 0,43 | 35,24 | 0,3707 | 0,0614 | |||
| AN / AutoNation, Inc. | 0,00 | 0,41 | 0,3563 | 0,3563 | |||||
| CROX / Crocs, Inc. | 0,00 | 63,67 | 0,40 | 36,15 | 0,3508 | 0,0934 | |||
| EG / Everest Group, Ltd. | 0,00 | 0,40 | 0,3486 | 0,3486 | |||||
| KNSL / Kinsale Capital Group, Inc. | 0,00 | 0,40 | 0,3459 | 0,3459 | |||||
| NVST / Envista Holdings Corporation | 0,02 | 0,37 | 0,3212 | 0,3212 | |||||
| DAR / Darling Ingredients Inc. | 0,01 | 75,66 | 0,36 | 37,02 | 0,3130 | 0,0854 | |||
| MAT / Mattel, Inc. | 0,02 | 0,34 | 0,2978 | 0,2978 | |||||
| PRGO / Perrigo Company plc | 0,01 | 50,09 | 0,33 | 42,13 | 0,2911 | 0,0869 | |||
| BRO / Brown & Brown, Inc. | 0,00 | 0,33 | 0,2890 | 0,2890 | |||||
| ACLS / Axcelis Technologies, Inc. | 0,00 | 0,32 | 0,2758 | 0,2758 | |||||
| WU / The Western Union Company | 0,03 | 0,31 | 0,2714 | 0,2714 | |||||
| EVRG / Evergy, Inc. | 0,01 | 0,30 | 0,2620 | 0,2620 | |||||
| BYD / Boyd Gaming Corporation | 0,00 | 0,29 | 0,2486 | 0,2486 | |||||
| RGLD / Royal Gold, Inc. | 0,00 | 28,91 | 0,28 | 47,15 | 0,2474 | 0,0572 | |||
| ST / Sensata Technologies Holding plc | 0,01 | 69,16 | 0,28 | 41,12 | 0,2423 | 0,0712 | |||
| BOX / Box, Inc. | 0,01 | 0,27 | 0,2373 | 0,2373 | |||||
| MUR / Murphy Oil Corporation | 0,01 | 0,26 | 0,2222 | 0,2222 | |||||
| FIVN / Five9, Inc. | 0,00 | 0,25 | 0,2167 | 0,2167 | |||||
| OGN / Organon & Co. | 0,02 | 0,23 | 0,2043 | 0,2043 | |||||
| NYCB / Flagstar Financial, Inc. | 0,02 | −78,28 | 0,23 | −82,74 | 0,2011 | −0,5976 | |||
| WEN / The Wendy's Company | 0,01 | 0,23 | 0,1979 | 0,1979 | |||||
| HQY / HealthEquity, Inc. | 0,00 | −78,51 | 0,22 | −76,86 | 0,1904 | −0,6918 | |||
| MSM / MSC Industrial Direct Co., Inc. | 0,00 | 0,22 | 0,1894 | 0,1894 | |||||
| OPCH / Option Care Health, Inc. | 0,01 | 0,19 | 0,1692 | 0,1692 | |||||
| SLAB / Silicon Laboratories Inc. | 0,00 | 0,18 | 0,1558 | 0,1558 | |||||
| FCN / FTI Consulting, Inc. | 0,00 | 0,16 | 0,1376 | 0,1376 | |||||
| VC / Visteon Corporation | 0,00 | 0,15 | 0,1316 | 0,1316 | |||||
| MDU / MDU Resources Group, Inc. | 0,01 | 0,14 | 0,1250 | 0,1250 | |||||
| CHH / Choice Hotels International, Inc. | 0,00 | 0,14 | 0,1227 | 0,1227 | |||||
| AXS / AXIS Capital Holdings Limited | 0,00 | 0,14 | 0,1210 | 0,1210 | |||||
| FGXXX / First American Funds Inc - First American Government Obligations Fund Class X | 0,14 | −6,08 | 0,14 | −6,25 | 0,1180 | −0,0236 | |||
| DTM / DT Midstream, Inc. | 0,00 | 0,11 | 0,0976 | 0,0976 | |||||
| CW / Curtiss-Wright Corporation | 0,00 | 0,11 | 0,0962 | 0,0962 | |||||
| OGS / ONE Gas, Inc. | 0,00 | 72,07 | 0,10 | 42,86 | 0,0878 | 0,0264 | |||
| FLO / Flowers Foods, Inc. | 0,00 | 0,09 | 0,0772 | 0,0772 | |||||
| VALT / ETF Managers Trust - ETFMG Sit Ultra Short ETF | 0,00 | 0,00 | 0,0000 | 0,0000 | |||||
| AGNC / AGNC Investment Corp. | 0,00 | −100,00 | 0,00 | −100,00 | −1,5856 | ||||
| SMAR / Smartsheet Inc. | 0,00 | −100,00 | 0,00 | −100,00 | −0,1403 | ||||
| ETR / Entergy Corporation | 0,00 | −100,00 | 0,00 | −100,00 | −1,5350 | ||||
| WFC / Wells Fargo & Company | 0,00 | −100,00 | 0,00 | −100,00 | −4,6391 | ||||
| PEN / Penumbra, Inc. | 0,00 | −100,00 | 0,00 | −100,00 | −0,1763 | ||||
| ALLY / Ally Financial Inc. | 0,00 | −100,00 | 0,00 | −100,00 | −0,4701 | ||||
| AXTA / Axalta Coating Systems Ltd. | 0,00 | −100,00 | 0,00 | −100,00 | −0,1742 | ||||
| VST / Vistra Corp. | 0,00 | −100,00 | 0,00 | −100,00 | −0,3941 | ||||
| L / Loews Corporation | 0,00 | −100,00 | 0,00 | −100,00 | −0,1987 | ||||
| PH / Parker-Hannifin Corporation | 0,00 | −100,00 | 0,00 | −100,00 | −4,3583 | ||||
| GLPI / Gaming and Leisure Properties, Inc. | 0,00 | −100,00 | 0,00 | −100,00 | −0,3305 | ||||
| OLED / Universal Display Corporation | 0,00 | −100,00 | 0,00 | −100,00 | −0,7659 | ||||
| CNP / CenterPoint Energy, Inc. | 0,00 | −100,00 | 0,00 | −100,00 | −0,3742 | ||||
| ASGN / ASGN Incorporated | 0,00 | −100,00 | 0,00 | −100,00 | −0,4508 | ||||
| PB / Prosperity Bancshares, Inc. | 0,00 | −100,00 | 0,00 | −100,00 | −0,1206 | ||||
| BWA / BorgWarner Inc. | 0,00 | −100,00 | 0,00 | −100,00 | −1,6753 | ||||
| GNTX / Gentex Corporation | 0,00 | −100,00 | 0,00 | −100,00 | −0,1145 | ||||
| WTS / Watts Water Technologies, Inc. | 0,00 | −100,00 | 0,00 | −100,00 | −0,1066 | ||||
| POWI / Power Integrations, Inc. | 0,00 | −100,00 | 0,00 | −100,00 | −0,1158 | ||||
| INVH / Invitation Homes Inc. | 0,00 | −100,00 | 0,00 | −100,00 | −1,7356 | ||||
| STAG / STAG Industrial, Inc. | 0,00 | −100,00 | 0,00 | −100,00 | −0,1618 | ||||
| DT / Dynatrace, Inc. | 0,00 | −100,00 | 0,00 | −100,00 | −0,2487 | ||||
| FITB / Fifth Third Bancorp | 0,00 | −100,00 | 0,00 | −100,00 | −0,6861 | ||||
| SYF / Synchrony Financial | 0,00 | −100,00 | 0,00 | −100,00 | −0,8617 | ||||
| SIGI / Selective Insurance Group, Inc. | 0,00 | −100,00 | 0,00 | −100,00 | −0,9749 | ||||
| WH / Wyndham Hotels & Resorts, Inc. | 0,00 | −100,00 | 0,00 | −100,00 | −0,1301 | ||||
| EQH / Equitable Holdings, Inc. | 0,00 | −100,00 | 0,00 | −100,00 | −1,0299 | ||||
| PEG / Public Service Enterprise Group Incorporated | 0,00 | −100,00 | 0,00 | −100,00 | −0,7296 | ||||
| MEDP / Medpace Holdings, Inc. | 0,00 | −100,00 | 0,00 | −100,00 | −0,8467 | ||||
| ABBV / AbbVie Inc. | 0,00 | −100,00 | 0,00 | −100,00 | −2,2757 | ||||
| PGR / The Progressive Corporation | 0,00 | −100,00 | 0,00 | −100,00 | −1,1916 | ||||
| SSNC / SS&C Technologies Holdings, Inc. | 0,00 | −100,00 | 0,00 | −100,00 | −0,2970 | ||||
| HD / The Home Depot, Inc. | 0,00 | −100,00 | 0,00 | −100,00 | −1,2152 | ||||
| SEIC / SEI Investments Company | 0,00 | −100,00 | 0,00 | −100,00 | −0,5610 | ||||
| CDAY / Ceridian HCM Holding Inc. | 0,00 | −100,00 | 0,00 | −100,00 | −0,1694 | ||||
| DVA / DaVita Inc. | 0,00 | −100,00 | 0,00 | −100,00 | −1,0537 | ||||
| TFC / Truist Financial Corporation | 0,00 | −100,00 | 0,00 | −100,00 | −1,2395 | ||||
| VRTX / Vertex Pharmaceuticals Incorporated | 0,00 | −100,00 | 0,00 | −100,00 | −1,2191 | ||||
| BK / The Bank of New York Mellon Corporation | 0,00 | −100,00 | 0,00 | −100,00 | −0,7514 | ||||
| BRKR / Bruker Corporation | 0,00 | −100,00 | 0,00 | −100,00 | −0,1906 | ||||
| MSI / Motorola Solutions, Inc. | 0,00 | −100,00 | 0,00 | −100,00 | −0,4697 |