Grundläggande statistik
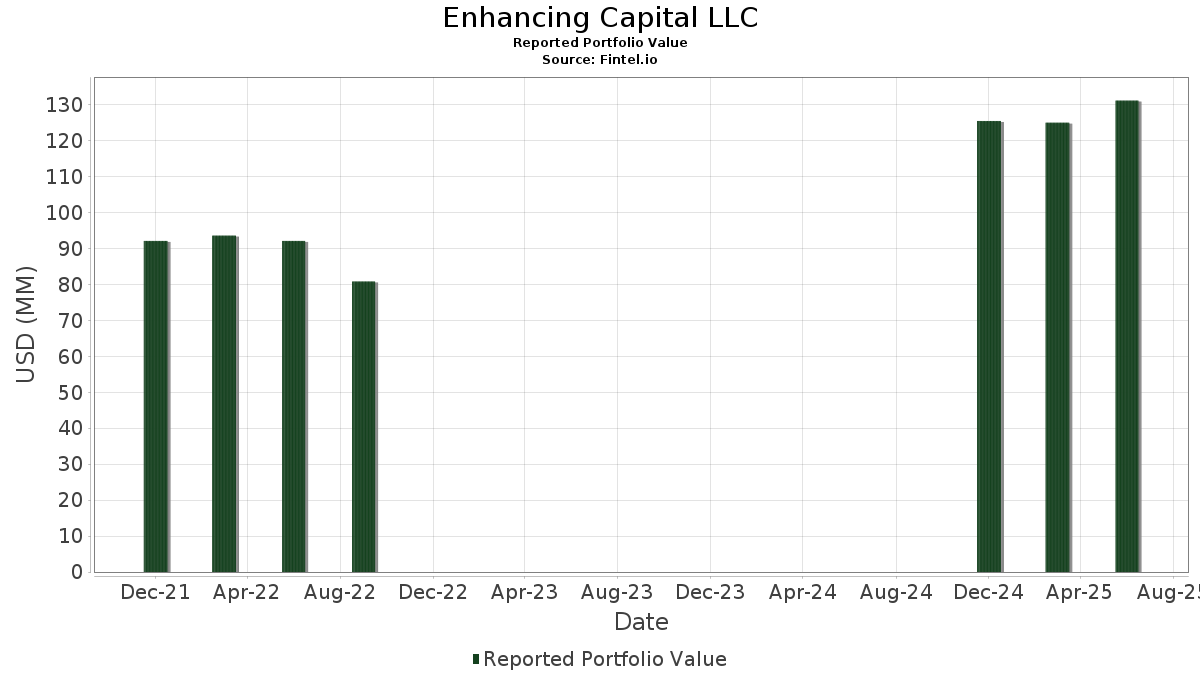
| Portföljvärde | $ 131 134 666 |
| Aktuella positioner | 92 |
Senaste innehav, resultat, förvaltat kapital (från 13F, 13D)
Enhancing Capital LLC har redovisat 92 totala innehav i sina senaste SEC-arkiveringar. Det senaste portföljvärdet beräknas vara $ 131 134 666 USD. Faktiskt förvaltade tillgångar (AUM) är detta värde plus likvida medel (som inte redovisas). Enhancing Capital LLCs största innehav är Microsoft Corporation (US:MSFT) , JPMorgan Chase & Co. (US:JPM) , Eli Lilly and Company (US:LLY) , NVIDIA Corporation (US:NVDA) , and iShares Trust - iShares 0-3 Month Treasury Bond ETF (US:SGOV) . Enhancing Capital LLCs nya positioner inkluderar Wingstop Inc. (US:WING) , Analog Devices, Inc. (US:ADI) , .
Största ökningarna detta kvartal
Vi använder förändringen i portföljallokeringen eftersom det är det mest meningsfulla måttet. Förändringar kan bero på transaktioner eller förändringar i aktiekurser.
| Värdepapper | Aktier (MM) |
Värde (MM$) |
Portfölj % av | ΔPortfölj % av |
|---|---|---|---|---|
| 0,03 | 12,48 | 9,5147 | 1,9806 | |
| 0,04 | 6,08 | 4,6384 | 1,3000 | |
| 0,01 | 2,45 | 1,8673 | 0,6145 | |
| 0,02 | 6,67 | 5,0848 | 0,5708 | |
| 0,00 | 0,52 | 0,3975 | 0,3975 | |
| 0,03 | 1,92 | 1,4652 | 0,2343 | |
| 0,01 | 3,06 | 2,3354 | 0,2103 | |
| 0,01 | 2,70 | 2,0582 | 0,1892 | |
| 0,00 | 0,21 | 0,1627 | 0,1627 | |
| 0,00 | 0,21 | 0,1601 | 0,1601 |
Största minskningarna detta kvartal
Vi använder förändringen i portföljallokeringen eftersom det är det mest meningsfulla måttet. Förändringar kan bero på transaktioner eller förändringar i aktiepriser.
| Värdepapper | Aktier (MM) |
Värde (MM$) |
Portfölj % av | ΔPortfölj % av |
|---|---|---|---|---|
| 0,01 | 6,47 | 4,9339 | −0,5507 | |
| 0,04 | 1,73 | 1,3167 | −0,5035 | |
| 0,02 | 2,92 | 2,2232 | −0,5019 | |
| 0,04 | 4,48 | 3,4151 | −0,4215 | |
| 0,01 | 3,25 | 2,4819 | −0,3730 | |
| 0,00 | 0,62 | 0,4758 | −0,3623 | |
| 0,02 | 2,38 | 1,8171 | −0,2528 | |
| 0,02 | 1,75 | 1,3321 | −0,2527 | |
| 0,03 | 3,14 | 2,3975 | −0,2515 | |
| 0,05 | 3,58 | 2,7316 | −0,1950 |
13F- och fond arkiveringar
Denna blankett lämnades in den 2025-07-11 för rapporteringsperioden 2025-06-30. Klicka på länksymbolen för att se hela transaktionshistoriken.
Uppgradera för att låsa upp premiumdata och exportera till Excel![]() .
.
| Värdepapper | Typ | Genomsnittligt aktiepris | Aktier (MM) |
ΔAktier (%) |
ΔAktier (%) |
Värde ($MM) |
Portfölj (%) |
ΔPortfölj (%) |
|
|---|---|---|---|---|---|---|---|---|---|
| MSFT / Microsoft Corporation | 0,03 | −0,00 | 12,48 | 32,51 | 9,5147 | 1,9806 | |||
| JPM / JPMorgan Chase & Co. | 0,02 | 0,00 | 6,67 | 18,19 | 5,0848 | 0,5708 | |||
| LLY / Eli Lilly and Company | 0,01 | 0,00 | 6,47 | −5,62 | 4,9339 | −0,5507 | |||
| NVDA / NVIDIA Corporation | 0,04 | 0,00 | 6,08 | 45,78 | 4,6384 | 1,3000 | |||
| SGOV / iShares Trust - iShares 0-3 Month Treasury Bond ETF | 0,04 | −6,63 | 4,48 | −6,61 | 3,4151 | −0,4215 | |||
| NEE / NextEra Energy, Inc. | 0,05 | 0,00 | 3,58 | −2,05 | 2,7316 | −0,1950 | |||
| COST / Costco Wholesale Corporation | 0,00 | 0,00 | 3,51 | 4,68 | 2,6761 | −0,0064 | |||
| BRK.A / Berkshire Hathaway Inc. | 0,01 | 0,00 | 3,25 | −8,80 | 2,4819 | −0,3730 | |||
| AEP / American Electric Power Company, Inc. | 0,03 | 0,00 | 3,14 | −5,05 | 2,3975 | −0,2515 | |||
| AMZN / Amazon.com, Inc. | 0,01 | −0,01 | 3,06 | 15,29 | 2,3354 | 0,2103 | |||
| WM / Waste Management, Inc. | 0,01 | 0,00 | 3,00 | −1,15 | 2,2859 | −0,1406 | |||
| CVX / Chevron Corporation | 0,02 | 0,00 | 2,92 | −14,42 | 2,2232 | −0,5019 | |||
| HCC / Warrior Met Coal, Inc. | 0,06 | −0,01 | 2,70 | −3,98 | 2,0609 | −0,1907 | |||
| TXN / Texas Instruments Incorporated | 0,01 | 0,00 | 2,70 | 15,54 | 2,0582 | 0,1892 | |||
| ORCL / Oracle Corporation | 0,01 | 0,00 | 2,45 | 56,42 | 1,8673 | 0,6145 | |||
| JNJ / Johnson & Johnson | 0,02 | 0,00 | 2,38 | −7,92 | 1,8171 | −0,2528 | |||
| CMI / Cummins Inc. | 0,01 | −0,01 | 2,31 | 4,48 | 1,7597 | −0,0075 | |||
| CSCO / Cisco Systems, Inc. | 0,03 | 0,00 | 2,30 | 12,40 | 1,7561 | 0,1173 | |||
| RTX / RTX Corporation | 0,02 | 0,00 | 2,23 | 10,28 | 1,7013 | 0,0821 | |||
| V / Visa Inc. | 0,01 | 0,00 | 1,95 | 1,30 | 1,4891 | −0,0530 | |||
| CNM / Core & Main, Inc. | 0,03 | −0,03 | 1,92 | 24,90 | 1,4652 | 0,2343 | |||
| LNT / Alliant Energy Corporation | 0,03 | 0,00 | 1,91 | −6,01 | 1,4553 | −0,1696 | |||
| MRK / Merck & Co., Inc. | 0,02 | 0,00 | 1,75 | −11,82 | 1,3321 | −0,2527 | |||
| FULT / Fulton Financial Corporation | 0,10 | 0,00 | 1,73 | −0,29 | 1,3183 | −0,0687 | |||
| BMY / Bristol-Myers Squibb Company | 0,04 | 0,00 | 1,73 | −24,10 | 1,3167 | −0,5035 | |||
| WMT / Walmart Inc. | 0,02 | 0,00 | 1,61 | 11,40 | 1,2303 | 0,0714 | |||
| ET / Energy Transfer LP - Limited Partnership | 0,08 | 0,00 | 1,46 | −2,47 | 1,1149 | −0,0845 | |||
| GRMN / Garmin Ltd. | 0,01 | −0,03 | 1,43 | −3,90 | 1,0893 | −0,1000 | |||
| SRE / Sempra | 0,02 | 0,00 | 1,41 | 6,18 | 1,0747 | 0,0128 | |||
| HON / Honeywell International Inc. | 0,01 | 0,00 | 1,26 | 9,97 | 0,9590 | 0,0441 | |||
| DIS / The Walt Disney Company | 0,01 | 0,00 | 1,24 | 25,63 | 0,9457 | 0,1560 | |||
| WEC / WEC Energy Group, Inc. | 0,01 | 0,00 | 1,22 | −4,39 | 0,9302 | −0,0905 | |||
| XOM / Exxon Mobil Corporation | 0,01 | 0,00 | 1,21 | −9,38 | 0,9207 | −0,1450 | |||
| MA / Mastercard Incorporated | 0,00 | −0,05 | 1,13 | 2,45 | 0,8630 | −0,0206 | |||
| MCD / McDonald's Corporation | 0,00 | 0,00 | 1,08 | −6,41 | 0,8244 | −0,1003 | |||
| GOOGL / Alphabet Inc. | 0,01 | 0,00 | 1,08 | 14,00 | 0,8198 | 0,0650 | |||
| XEL / Xcel Energy Inc. | 0,02 | 0,00 | 1,06 | −3,83 | 0,8049 | −0,0730 | |||
| LHX / L3Harris Technologies, Inc. | 0,00 | 0,00 | 1,01 | 19,86 | 0,7736 | 0,0963 | |||
| PFE / Pfizer Inc. | 0,04 | 0,00 | 1,01 | −4,36 | 0,7690 | −0,0744 | |||
| MCO / Moody's Corporation | 0,00 | 0,00 | 1,00 | 7,73 | 0,7650 | 0,0198 | |||
| COP / ConocoPhillips | 0,01 | 0,00 | 0,98 | −14,51 | 0,7459 | −0,1699 | |||
| PYPL / PayPal Holdings, Inc. | 0,01 | −0,03 | 0,88 | 13,95 | 0,6729 | 0,0529 | |||
| RACE / Ferrari N.V. | 0,00 | −0,06 | 0,87 | 14,57 | 0,6661 | 0,0564 | |||
| KO / The Coca-Cola Company | 0,01 | 0,00 | 0,87 | −1,14 | 0,6598 | −0,0410 | |||
| LNKB / LINKBANCORP, Inc. | 0,12 | −0,11 | 0,86 | 7,68 | 0,6527 | 0,0170 | |||
| DPZ / Domino's Pizza, Inc. | 0,00 | −0,06 | 0,78 | −2,01 | 0,5962 | −0,0420 | |||
| GIS / General Mills, Inc. | 0,01 | 0,00 | 0,77 | −13,37 | 0,5887 | −0,1241 | |||
| TROW / T. Rowe Price Group, Inc. | 0,01 | 0,00 | 0,74 | 5,13 | 0,5630 | 0,0006 | |||
| BLD / TopBuild Corp. | 0,00 | −0,05 | 0,72 | 6,08 | 0,5458 | 0,0061 | |||
| APD / Air Products and Chemicals, Inc. | 0,00 | −0,04 | 0,71 | −4,32 | 0,5407 | −0,0527 | |||
| PPL / PPL Corporation | 0,02 | 0,00 | 0,71 | −6,11 | 0,5396 | −0,0636 | |||
| ULTA / Ulta Beauty, Inc. | 0,00 | −0,07 | 0,69 | 27,54 | 0,5262 | 0,0933 | |||
| AAPL / Apple Inc. | 0,00 | 0,00 | 0,68 | −7,69 | 0,5223 | −0,0710 | |||
| IDR / Idaho Strategic Resources, Inc. | 0,05 | 0,00 | 0,67 | −8,68 | 0,5138 | −0,0760 | |||
| PEG / Public Service Enterprise Group Incorporated | 0,01 | 0,00 | 0,67 | 2,28 | 0,5135 | −0,0132 | |||
| ESE / ESCO Technologies Inc. | 0,00 | 0,00 | 0,63 | 20,65 | 0,4818 | 0,0626 | |||
| UNH / UnitedHealth Group Incorporated | 0,00 | 0,00 | 0,62 | −40,50 | 0,4758 | −0,3623 | |||
| HD / The Home Depot, Inc. | 0,00 | 0,00 | 0,61 | 0,00 | 0,4641 | −0,0226 | |||
| BKNG / Booking Holdings Inc. | 0,00 | 0,00 | 0,60 | 25,74 | 0,4547 | 0,0751 | |||
| ICE / Intercontinental Exchange, Inc. | 0,00 | −0,16 | 0,59 | 6,33 | 0,4486 | 0,0054 | |||
| LOW / Lowe's Companies, Inc. | 0,00 | 0,00 | 0,55 | −4,97 | 0,4230 | −0,0435 | |||
| CSGP / CoStar Group, Inc. | 0,01 | −0,04 | 0,55 | 1,47 | 0,4218 | −0,0145 | |||
| MAR / Marriott International, Inc. | 0,00 | 0,00 | 0,55 | 14,71 | 0,4167 | 0,0355 | |||
| WING / Wingstop Inc. | 0,00 | 0,52 | 0,3975 | 0,3975 | |||||
| ABT / Abbott Laboratories | 0,00 | 0,00 | 0,52 | 2,38 | 0,3941 | −0,0092 | |||
| SHW / The Sherwin-Williams Company | 0,00 | −0,07 | 0,51 | −1,74 | 0,3878 | −0,0263 | |||
| CPRT / Copart, Inc. | 0,01 | −0,09 | 0,49 | −13,30 | 0,3731 | −0,0787 | |||
| ADSK / Autodesk, Inc. | 0,00 | 0,00 | 0,49 | 18,16 | 0,3728 | 0,0420 | |||
| MEDP / Medpace Holdings, Inc. | 0,00 | −0,07 | 0,47 | 3,10 | 0,3547 | −0,0068 | |||
| OKE / ONEOK, Inc. | 0,01 | 0,00 | 0,43 | −17,69 | 0,3267 | −0,0899 | |||
| MUSA / Murphy USA Inc. | 0,00 | −0,09 | 0,43 | −13,36 | 0,3265 | −0,0695 | |||
| HSY / The Hershey Company | 0,00 | −0,16 | 0,42 | −3,03 | 0,3176 | −0,0264 | |||
| CTVA / Corteva, Inc. | 0,01 | 0,00 | 0,38 | 18,27 | 0,2917 | 0,0333 | |||
| GJR / Strats Trust For Procter & Gambel Security - Preferred Security | 0,00 | 0,00 | 0,38 | −6,60 | 0,2916 | −0,0357 | |||
| ABBV / AbbVie Inc. | 0,00 | 0,00 | 0,37 | −11,46 | 0,2831 | −0,0522 | |||
| CL / Colgate-Palmolive Company | 0,00 | 0,00 | 0,36 | −2,94 | 0,2773 | −0,0226 | |||
| WSO / Watsco, Inc. | 0,00 | −0,12 | 0,36 | −13,32 | 0,2735 | −0,0572 | |||
| TRV / The Travelers Companies, Inc. | 0,00 | 0,00 | 0,32 | 1,26 | 0,2448 | −0,0091 | |||
| GPC / Genuine Parts Company | 0,00 | 0,00 | 0,32 | 1,94 | 0,2414 | −0,0073 | |||
| UNFI / United Natural Foods, Inc. | 0,01 | 0,00 | 0,30 | −14,94 | 0,2259 | −0,0526 | |||
| VIG / Vanguard Specialized Funds - Vanguard Dividend Appreciation ETF | 0,00 | 0,00 | 0,29 | 5,54 | 0,2185 | 0,0012 | |||
| EPD / Enterprise Products Partners L.P. - Limited Partnership | 0,01 | 0,00 | 0,28 | −9,18 | 0,2119 | −0,0329 | |||
| HEI / HEICO Corporation | 0,00 | −0,25 | 0,26 | 22,43 | 0,2001 | 0,0287 | |||
| AZO / AutoZone, Inc. | 0,00 | 0,00 | 0,26 | −2,63 | 0,1982 | −0,0154 | |||
| CLX / The Clorox Company | 0,00 | 0,00 | 0,24 | −18,37 | 0,1831 | −0,0525 | |||
| PNC / The PNC Financial Services Group, Inc. | 0,00 | 0,00 | 0,23 | 5,99 | 0,1756 | 0,0019 | |||
| SO / The Southern Company | 0,00 | 0,00 | 0,23 | 0,00 | 0,1751 | −0,0089 | |||
| PPG / PPG Industries, Inc. | 0,00 | 0,00 | 0,23 | 4,13 | 0,1735 | −0,0015 | |||
| LW / Lamb Weston Holdings, Inc. | 0,00 | 0,00 | 0,22 | −2,67 | 0,1676 | −0,0132 | |||
| MTB / M&T Bank Corporation | 0,00 | 0,21 | 0,1627 | 0,1627 | |||||
| ADI / Analog Devices, Inc. | 0,00 | 0,21 | 0,1601 | 0,1601 | |||||
| CB / Chubb Limited | 0,00 | 0,00 | 0,21 | −4,13 | 0,1595 | −0,0149 | |||
| TMO / Thermo Fisher Scientific Inc. | 0,00 | −100,00 | 0,00 | 0,0000 | |||||
| HTLD / Heartland Express, Inc. | 0,00 | −100,00 | 0,00 | 0,0000 |