Grundläggande statistik
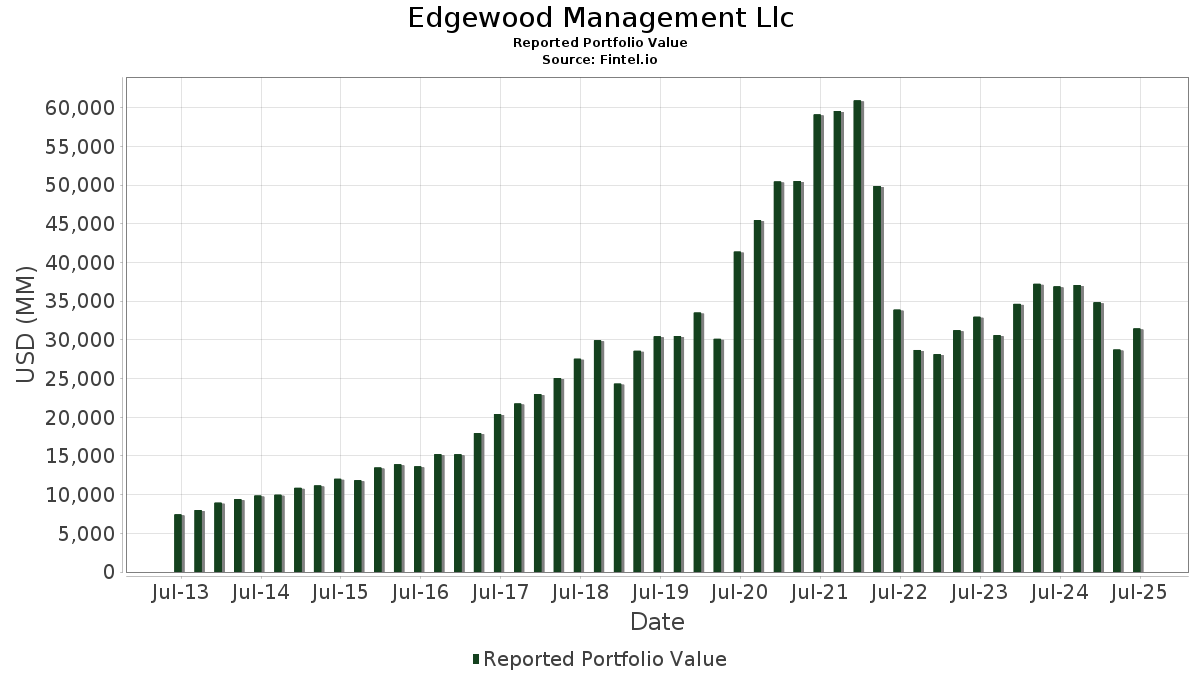
| Portföljvärde | $ 31 453 340 782 |
| Aktuella positioner | 83 |
Senaste innehav, resultat, förvaltat kapital (från 13F, 13D)
Edgewood Management Llc har redovisat 83 totala innehav i sina senaste SEC-arkiveringar. Det senaste portföljvärdet beräknas vara $ 31 453 340 782 USD. Faktiskt förvaltade tillgångar (AUM) är detta värde plus likvida medel (som inte redovisas). Edgewood Management Llcs största innehav är NVIDIA Corporation (US:NVDA) , Netflix, Inc. (US:NFLX) , ASML Holding N.V. - Depositary Receipt (Common Stock) (US:ASML) , Visa Inc. (US:V) , and Intuit Inc. (US:INTU) . Edgewood Management Llcs nya positioner inkluderar Broadcom Inc. (US:AVGO) , Boston Scientific Corporation (US:BSX) , Fair Isaac Corporation (US:FICO) , .
Största ökningarna detta kvartal
Vi använder förändringen i portföljallokeringen eftersom det är det mest meningsfulla måttet. Förändringar kan bero på transaktioner eller förändringar i aktiekurser.
| Värdepapper | Aktier (MM) |
Värde (MM$) |
Portfölj % av | ΔPortfölj % av |
|---|---|---|---|---|
| 5,70 | 1 571,44 | 4,9961 | 4,9961 | |
| 6,95 | 746,66 | 2,3739 | 2,3739 | |
| 0,34 | 612,79 | 1,9482 | 1,9482 | |
| 1,25 | 959,01 | 3,0490 | 0,9577 | |
| 16,39 | 2 588,79 | 8,2306 | 0,8688 | |
| 9,56 | 1 102,52 | 3,5053 | 0,6314 | |
| 1,82 | 2 436,19 | 7,7454 | 0,4630 | |
| 2,24 | 1 763,46 | 5,6066 | 0,4309 | |
| 1,50 | 1 540,85 | 4,8988 | 0,4095 | |
| 13,66 | 983,20 | 3,1259 | 0,3167 |
Största minskningarna detta kvartal
Vi använder förändringen i portföljallokeringen eftersom det är det mest meningsfulla måttet. Förändringar kan bero på transaktioner eller förändringar i aktiepriser.
| Värdepapper | Aktier (MM) |
Värde (MM$) |
Portfölj % av | ΔPortfölj % av |
|---|---|---|---|---|
| 0,00 | 0,89 | 0,0028 | −3,9102 | |
| 0,04 | 2,52 | 0,0080 | −2,3990 | |
| 19,92 | 977,28 | 3,1071 | −1,1274 | |
| 1,98 | 1 545,67 | 4,9142 | −1,0806 | |
| 5,62 | 1 996,49 | 6,3475 | −1,0281 | |
| 2,45 | 1 092,94 | 3,4748 | −0,9876 | |
| 2,09 | 1 207,32 | 3,8384 | −0,6030 | |
| 2,50 | 1 316,88 | 4,1868 | −0,5699 | |
| 8,63 | 1 291,60 | 4,1064 | −0,4123 | |
| 10,62 | 1 404,99 | 4,4669 | −0,3098 |
13F- och fond arkiveringar
Denna blankett lämnades in den 2025-08-13 för rapporteringsperioden 2025-06-30. Klicka på länksymbolen för att se hela transaktionshistoriken.
Uppgradera för att låsa upp premiumdata och exportera till Excel![]() .
.
| Värdepapper | Typ | Genomsnittligt aktiepris | Aktier (MM) |
ΔAktier (%) |
ΔAktier (%) |
Värde ($MM) |
Portfölj (%) |
ΔPortfölj (%) |
|
|---|---|---|---|---|---|---|---|---|---|
| NVDA / NVIDIA Corporation | 16,39 | −16,02 | 2 588,79 | 22,42 | 8,2306 | 0,8688 | |||
| NFLX / Netflix, Inc. | 1,82 | −18,90 | 2 436,19 | 16,46 | 7,7454 | 0,4630 | |||
| ASML / ASML Holding N.V. - Depositary Receipt (Common Stock) | 2,72 | −7,08 | 2 175,96 | 12,38 | 6,9181 | 0,1778 | |||
| V / Visa Inc. | 5,62 | −6,99 | 1 996,49 | −5,77 | 6,3475 | −1,0281 | |||
| INTU / Intuit Inc. | 2,24 | −7,54 | 1 763,46 | 18,61 | 5,6066 | 0,4309 | |||
| AVGO / Broadcom Inc. | 5,70 | 1 571,44 | 4,9961 | 4,9961 | |||||
| LLY / Eli Lilly and Company | 1,98 | −4,90 | 1 545,67 | −10,24 | 4,9142 | −1,0806 | |||
| NOW / ServiceNow, Inc. | 1,50 | −7,47 | 1 540,85 | 19,48 | 4,8988 | 0,4095 | |||
| SNPS / Synopsys, Inc. | 2,92 | −7,64 | 1 494,94 | 10,41 | 4,7529 | 0,0395 | |||
| ABNB / Airbnb, Inc. | 10,62 | −7,57 | 1 404,99 | 2,39 | 4,4669 | −0,3098 | |||
| SPGI / S&P Global Inc. | 2,50 | −7,13 | 1 316,88 | −3,62 | 4,1868 | −0,5699 | |||
| ISRG / Intuitive Surgical, Inc. | 2,39 | −7,04 | 1 297,57 | 1,99 | 4,1254 | −0,3034 | |||
| BX / Blackstone Inc. | 8,63 | −7,01 | 1 291,60 | −0,50 | 4,1064 | −0,4123 | |||
| MSCI / MSCI Inc. | 2,09 | −7,22 | 1 207,32 | −5,37 | 3,8384 | −0,6030 | |||
| SHOP / Shopify Inc. | 9,56 | 10,55 | 1 102,52 | 33,55 | 3,5053 | 0,6314 | |||
| VRTX / Vertex Pharmaceuticals Incorporated | 2,45 | −7,15 | 1 092,94 | −14,74 | 3,4748 | −0,9876 | |||
| TDG / TransDigm Group Incorporated | 0,70 | 6,23 | 1 058,69 | 16,78 | 3,3659 | 0,2100 | |||
| TTD / The Trade Desk, Inc. | 13,66 | −7,39 | 983,20 | 21,84 | 3,1259 | 0,3167 | |||
| CPRT / Copart, Inc. | 19,92 | −7,35 | 977,28 | −19,66 | 3,1071 | −1,1274 | |||
| SPOT / Spotify Technology S.A. | 1,25 | 14,43 | 959,01 | 59,63 | 3,0490 | 0,9577 | |||
| BSX / Boston Scientific Corporation | 6,95 | 746,66 | 2,3739 | 2,3739 | |||||
| FICO / Fair Isaac Corporation | 0,34 | 612,79 | 1,9482 | 1,9482 | |||||
| CL / Colgate-Palmolive Company | 0,64 | −4,35 | 58,08 | −7,21 | 0,1847 | −0,0332 | |||
| AAPL / Apple Inc. | 0,20 | −2,53 | 40,96 | −9,97 | 0,1302 | −0,0282 | |||
| MMM / 3M Company | 0,13 | −41,60 | 19,33 | −39,46 | 0,0614 | −0,0497 | |||
| EQIX / Equinix, Inc. | 0,02 | −0,32 | 15,99 | −2,76 | 0,0508 | −0,0064 | |||
| ABBV / AbbVie Inc. | 0,07 | 0,00 | 13,04 | −11,41 | 0,0415 | −0,0098 | |||
| SPY / SPDR S&P 500 ETF | 0,02 | −26,83 | 10,63 | −19,19 | 0,0338 | −0,0120 | |||
| META / Meta Platforms, Inc. | 0,01 | 0,00 | 10,52 | 28,05 | 0,0334 | 0,0048 | |||
| CME / CME Group Inc. | 0,03 | −16,17 | 9,45 | −12,91 | 0,0300 | −0,0077 | |||
| ABT / Abbott Laboratories | 0,07 | 0,00 | 9,25 | 2,53 | 0,0294 | −0,0020 | |||
| DVY / iShares Trust - iShares Select Dividend ETF | 0,05 | −3,99 | 7,29 | −5,05 | 0,0232 | −0,0035 | |||
| XLU / The Select Sector SPDR Trust - The Utilities Select Sector SPDR Fund | 0,09 | 0,00 | 7,21 | 3,56 | 0,0229 | −0,0013 | |||
| AMT / American Tower Corporation | 0,03 | −33,89 | 6,49 | −32,86 | 0,0206 | −0,0130 | |||
| JPM / JPMorgan Chase & Co. | 0,02 | −0,70 | 5,73 | 17,36 | 0,0182 | 0,0012 | |||
| SOLV / Solventum Corporation | 0,07 | 0,00 | 5,25 | −0,27 | 0,0167 | −0,0016 | |||
| DLR / Digital Realty Trust, Inc. | 0,03 | 0,00 | 4,85 | 21,65 | 0,0154 | 0,0015 | |||
| PLD / Prologis, Inc. | 0,04 | 0,00 | 4,71 | −5,97 | 0,0150 | −0,0025 | |||
| AVAV / AeroVironment, Inc. | 0,01 | 0,00 | 4,27 | 139,17 | 0,0136 | 0,0074 | |||
| GILD / Gilead Sciences, Inc. | 0,04 | −6,00 | 4,16 | −7,00 | 0,0132 | −0,0023 | |||
| JNJ / Johnson & Johnson | 0,02 | 0,00 | 2,85 | −7,89 | 0,0091 | −0,0017 | |||
| PEP / PepsiCo, Inc. | 0,02 | −14,33 | 2,76 | −24,56 | 0,0088 | −0,0040 | |||
| BK / The Bank of New York Mellon Corporation | 0,03 | 0,00 | 2,71 | 8,63 | 0,0086 | −0,0001 | |||
| SYY / Sysco Corporation | 0,04 | 0,00 | 2,66 | 0,95 | 0,0085 | −0,0007 | |||
| CMG / Chipotle Mexican Grill, Inc. | 0,04 | −99,67 | 2,52 | −99,64 | 0,0080 | −2,3990 | |||
| TSM / Taiwan Semiconductor Manufacturing Company Limited - Depositary Receipt (Common Stock) | 0,01 | −26,00 | 2,51 | 0,96 | 0,0080 | −0,0007 | |||
| BMY / Bristol-Myers Squibb Company | 0,05 | −17,35 | 2,34 | −37,26 | 0,0074 | −0,0055 | |||
| BRK.B / Berkshire Hathaway Inc. | 0,00 | 0,00 | 2,20 | −8,79 | 0,0070 | −0,0014 | |||
| BRK.A / Berkshire Hathaway Inc. | 0,00 | 0,00 | 2,19 | −8,73 | 0,0070 | −0,0014 | |||
| PFE / Pfizer Inc. | 0,08 | 0,00 | 2,06 | −4,32 | 0,0065 | −0,0009 | |||
| AMD / Advanced Micro Devices, Inc. | 0,01 | −3,08 | 1,92 | 33,87 | 0,0061 | 0,0011 | |||
| CSCO / Cisco Systems, Inc. | 0,03 | −5,94 | 1,86 | 5,70 | 0,0059 | −0,0002 | |||
| NEE / NextEra Energy, Inc. | 0,03 | 0,00 | 1,83 | −2,08 | 0,0058 | −0,0007 | |||
| ETG / Eaton Vance Tax-Advantaged Global Dividend Income Fund | 0,08 | 0,00 | 1,72 | 14,93 | 0,0055 | 0,0003 | |||
| MSFT / Microsoft Corporation | 0,00 | −76,90 | 1,69 | −69,39 | 0,0054 | −0,0138 | |||
| AMZN / Amazon.com, Inc. | 0,01 | −81,52 | 1,54 | −78,70 | 0,0049 | −0,0202 | |||
| VLTO / Veralto Corporation | 0,01 | 0,00 | 1,48 | 3,56 | 0,0047 | −0,0003 | |||
| KO / The Coca-Cola Company | 0,02 | 0,00 | 1,47 | −1,21 | 0,0047 | −0,0005 | |||
| DHR / Danaher Corporation | 0,01 | 0,00 | 1,34 | −3,68 | 0,0042 | −0,0006 | |||
| AGIO / Agios Pharmaceuticals, Inc. | 0,04 | 0,00 | 1,16 | 13,56 | 0,0037 | 0,0001 | |||
| XOM / Exxon Mobil Corporation | 0,01 | −1,29 | 0,98 | −10,47 | 0,0031 | −0,0007 | |||
| ADBE / Adobe Inc. | 0,00 | −99,92 | 0,89 | −99,92 | 0,0028 | −3,9102 | |||
| BMRN / BioMarin Pharmaceutical Inc. | 0,01 | 0,00 | 0,82 | −22,26 | 0,0026 | −0,0011 | |||
| DUK / Duke Energy Corporation | 0,01 | 0,00 | 0,74 | −3,26 | 0,0024 | −0,0003 | |||
| QXO / QXO, Inc. | 0,03 | 200,00 | 0,65 | 378,52 | 0,0021 | 0,0016 | |||
| GRAL / GRAIL, Inc. | 0,01 | 0,00 | 0,64 | 101,25 | 0,0020 | 0,0009 | |||
| UBER / Uber Technologies, Inc. | 0,01 | −85,74 | 0,63 | −81,77 | 0,0020 | −0,0101 | |||
| FCX / Freeport-McMoRan Inc. | 0,01 | 0,00 | 0,62 | 14,39 | 0,0020 | 0,0001 | |||
| MRK / Merck & Co., Inc. | 0,01 | 0,00 | 0,61 | −11,85 | 0,0019 | −0,0005 | |||
| ARWR / Arrowhead Pharmaceuticals, Inc. | 0,03 | 0,00 | 0,47 | 24,08 | 0,0015 | 0,0002 | |||
| EL / The Estée Lauder Companies Inc. | 0,01 | −66,67 | 0,44 | −59,16 | 0,0014 | −0,0023 | |||
| PG / The Procter & Gamble Company | 0,00 | 0,00 | 0,35 | −6,42 | 0,0011 | −0,0002 | |||
| ZTS / Zoetis Inc. | 0,00 | 0,00 | 0,32 | −5,28 | 0,0010 | −0,0002 | |||
| SCHW / The Charles Schwab Corporation | 0,00 | 0,00 | 0,32 | 16,85 | 0,0010 | 0,0001 | |||
| HD / The Home Depot, Inc. | 0,00 | 0,00 | 0,28 | 0,00 | 0,0009 | −0,0001 | |||
| NLY / Annaly Capital Management, Inc. | 0,01 | 0,00 | 0,26 | −7,39 | 0,0008 | −0,0002 | |||
| WBD / Warner Bros. Discovery, Inc. | 0,02 | 0,00 | 0,23 | 7,01 | 0,0007 | −0,0000 | |||
| SEER / Seer, Inc. | 0,10 | 0,00 | 0,21 | 26,63 | 0,0007 | 0,0001 | |||
| ARMP / Armata Pharmaceuticals, Inc. | 0,10 | 0,00 | 0,19 | 30,14 | 0,0006 | 0,0001 | |||
| PRTA / Prothena Corporation plc | 0,02 | 0,00 | 0,15 | −50,84 | 0,0005 | −0,0006 | |||
| LAC / Lithium Americas Corp. | 0,05 | 0,00 | 0,13 | −0,74 | 0,0004 | −0,0000 | |||
| LAR / Lithium Argentina AG | 0,05 | 0,00 | 0,10 | −2,80 | 0,0003 | −0,0000 | |||
| HOWL / Werewolf Therapeutics, Inc. | 0,05 | 0,00 | 0,05 | 12,50 | 0,0002 | 0,0000 | |||
| AXON / Axon Enterprise, Inc. | 0,00 | −100,00 | 0,00 | 0,0000 | |||||
| LULU / lululemon athletica inc. | 0,00 | −100,00 | 0,00 | 0,0000 | |||||
| DELL / Dell Technologies Inc. | 0,00 | −100,00 | 0,00 | 0,0000 | |||||
| APO / Apollo Global Management, Inc. | 0,00 | −100,00 | 0,00 | 0,0000 |