Grundläggande statistik
| Portföljvärde | $ 652 479 873 |
| Aktuella positioner | 80 |
Senaste innehav, resultat, förvaltat kapital (från 13F, 13D)
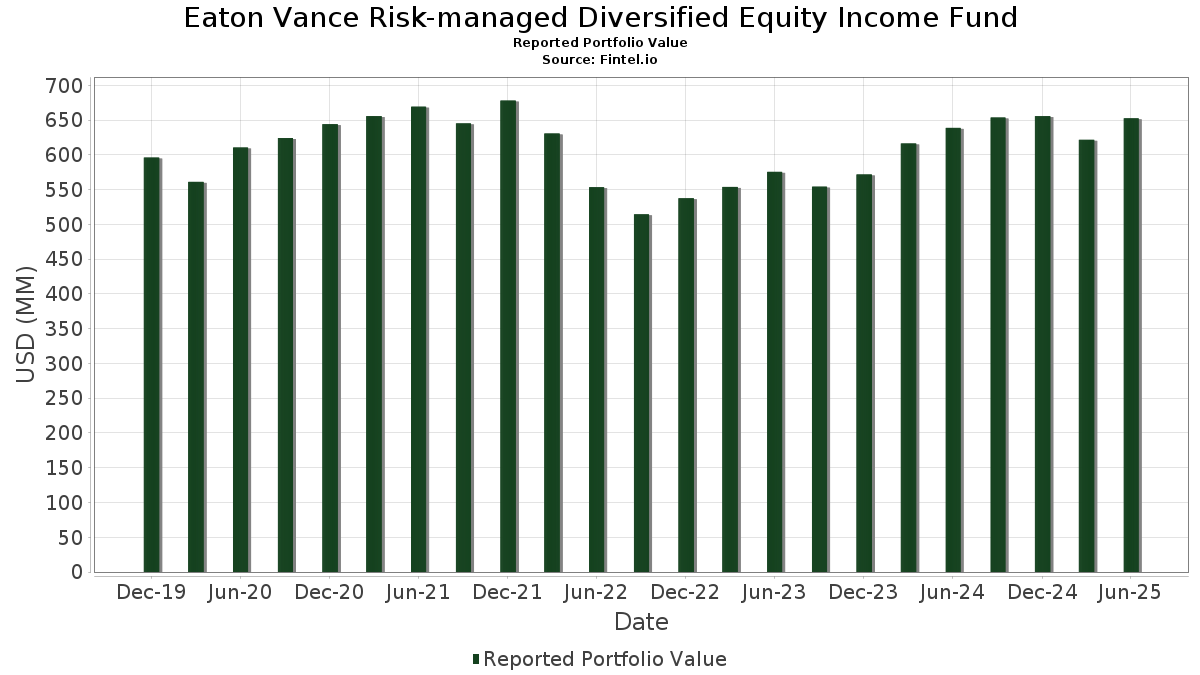
Eaton Vance Risk-managed Diversified Equity Income Fund har redovisat 80 totala innehav i sina senaste SEC-arkiveringar. Det senaste portföljvärdet beräknas vara $ 652 479 873 USD. Faktiskt förvaltade tillgångar (AUM) är detta värde plus likvida medel (som inte redovisas). Eaton Vance Risk-managed Diversified Equity Income Funds största innehav är Microsoft Corporation (US:MSFT) , NVIDIA Corporation (US:NVDA) , Apple Inc. (US:AAPL) , Amazon.com, Inc. (US:AMZN) , and Meta Platforms, Inc. (US:META) . Eaton Vance Risk-managed Diversified Equity Income Funds nya positioner inkluderar Quest Diagnostics Incorporated (US:DGX) , .
Största ökningarna detta kvartal
Vi använder förändringen i portföljallokeringen eftersom det är det mest meningsfulla måttet. Förändringar kan bero på transaktioner eller förändringar i aktiekurser.
| Värdepapper | Aktier (MM) |
Värde (MM$) |
Portfölj % av | ΔPortfölj % av |
|---|---|---|---|---|
| 0,33 | 52,50 | 8,0673 | 1,9769 | |
| 0,11 | 54,20 | 8,3275 | 1,4433 | |
| 0,09 | 23,84 | 3,6630 | 1,3780 | |
| 0,03 | 6,21 | 0,9538 | 0,9538 | |
| 0,03 | 24,63 | 3,7843 | 0,7347 | |
| 0,08 | 7,76 | 1,1923 | 0,6092 | |
| 0,00 | 8,31 | 1,2774 | 0,5980 | |
| 0,02 | 7,86 | 1,2078 | 0,4668 | |
| 0,12 | 12,14 | 1,8646 | 0,4471 | |
| 0,01 | 12,96 | 1,9911 | 0,4201 |
Största minskningarna detta kvartal
Vi använder förändringen i portföljallokeringen eftersom det är det mest meningsfulla måttet. Förändringar kan bero på transaktioner eller förändringar i aktiepriser.
| Värdepapper | Aktier (MM) |
Värde (MM$) |
Portfölj % av | ΔPortfölj % av |
|---|---|---|---|---|
| 0,11 | 0,11 | 0,0170 | −1,8521 | |
| 0,17 | 35,35 | 5,4314 | −1,4141 | |
| 0,02 | 4,73 | 0,7270 | −0,7467 | |
| 0,06 | 10,47 | 1,6085 | −0,6769 | |
| 0,10 | 9,10 | 1,3989 | −0,6084 | |
| 0,26 | 5,08 | 0,7807 | −0,6010 | |
| 0,06 | 6,07 | 0,9329 | −0,5750 | |
| 0,03 | 6,50 | 0,9987 | −0,5204 | |
| 0,07 | 9,69 | 1,4888 | −0,2902 | |
| 0,00 | 6,33 | 0,9722 | −0,2755 |
13F- och fond arkiveringar
Denna blankett lämnades in den 2025-08-25 för rapporteringsperioden 2025-06-30. Klicka på länksymbolen för att se hela transaktionshistoriken.
Uppgradera för att låsa upp premiumdata och exportera till Excel![]() .
.
| Värdepapper | Typ | Genomsnittligt aktiepris | Aktier (MM) |
ΔAktier (%) |
ΔAktier (%) |
Värde ($MM) |
Portfölj (%) |
ΔPortfölj (%) |
|
|---|---|---|---|---|---|---|---|---|---|
| MSFT / Microsoft Corporation | 0,11 | −4,33 | 54,20 | 26,77 | 8,3275 | 1,4433 | |||
| NVDA / NVIDIA Corporation | 0,33 | −4,78 | 52,50 | 38,81 | 8,0673 | 1,9769 | |||
| AAPL / Apple Inc. | 0,17 | −9,98 | 35,35 | −16,85 | 5,4314 | −1,4141 | |||
| AMZN / Amazon.com, Inc. | 0,15 | −0,98 | 33,17 | 14,18 | 5,0963 | 0,4187 | |||
| META / Meta Platforms, Inc. | 0,03 | 1,55 | 24,63 | 30,04 | 3,7843 | 0,7347 | |||
| AVGO / Broadcom Inc. | 0,09 | 2,04 | 23,84 | 67,99 | 3,6630 | 1,3780 | |||
| GOOG / Alphabet Inc. | 0,13 | −13,95 | 23,31 | −2,29 | 3,5823 | −0,2598 | |||
| V / Visa Inc. | 0,05 | 5,87 | 16,44 | 7,25 | 2,5263 | 0,0579 | |||
| NFLX / Netflix, Inc. | 0,01 | −7,51 | 12,96 | 32,81 | 1,9911 | 0,4201 | |||
| COOP / Mr. Cooper Group Inc. | 0,08 | −6,43 | 12,34 | 16,74 | 1,8957 | 0,1940 | |||
| FOUR / Shift4 Payments, Inc. | 0,12 | 13,65 | 12,14 | 37,85 | 1,8646 | 0,4471 | |||
| WMT / Walmart Inc. | 0,12 | −2,15 | 11,70 | 8,98 | 1,7970 | 0,0691 | |||
| KO / The Coca-Cola Company | 0,16 | −2,87 | 11,22 | −4,05 | 1,7236 | −0,1590 | |||
| ICE / Intercontinental Exchange, Inc. | 0,06 | 22,85 | 11,12 | 30,66 | 1,7086 | 0,3382 | |||
| FWONK / Formula One Group | 0,11 | 0,00 | 11,03 | 16,10 | 1,6954 | 0,1651 | |||
| FLUT / Flutter Entertainment plc | 0,04 | −2,37 | 10,86 | 25,93 | 1,6691 | 0,2801 | |||
| LRCX / Lam Research Corporation | 0,11 | −3,58 | 10,74 | 29,09 | 1,6500 | 0,3106 | |||
| ALL / The Allstate Corporation | 0,05 | −2,65 | 10,71 | −5,35 | 1,6462 | −0,1765 | |||
| LLY / Eli Lilly and Company | 0,01 | −3,05 | 10,62 | −8,50 | 1,6313 | −0,2370 | |||
| ABBV / AbbVie Inc. | 0,06 | −16,75 | 10,47 | −26,25 | 1,6085 | −0,6769 | |||
| TRU / TransUnion | 0,12 | 5,31 | 10,34 | 11,68 | 1,5894 | 0,0979 | |||
| TW / Tradeweb Markets Inc. | 0,07 | −11,07 | 9,69 | −12,30 | 1,4888 | −0,2902 | |||
| ABT / Abbott Laboratories | 0,07 | −7,28 | 9,33 | −4,92 | 1,4330 | −0,1466 | |||
| AJG / Arthur J. Gallagher & Co. | 0,03 | −3,02 | 9,13 | −10,08 | 1,4024 | −0,2319 | |||
| COP / ConocoPhillips | 0,10 | −14,53 | 9,10 | −26,97 | 1,3989 | −0,6084 | |||
| SPGI / S&P Global Inc. | 0,02 | −3,66 | 8,49 | −0,02 | 1,3038 | −0,0629 | |||
| FICO / Fair Isaac Corporation | 0,00 | 98,78 | 8,31 | 97,04 | 1,2774 | 0,5980 | |||
| PANW / Palo Alto Networks, Inc. | 0,04 | −4,80 | 8,30 | 14,18 | 1,2760 | 0,1048 | |||
| CARR / Carrier Global Corporation | 0,11 | 0,00 | 7,88 | 15,45 | 1,2114 | 0,1117 | |||
| ETN / Eaton Corporation plc | 0,02 | 30,06 | 7,86 | 70,80 | 1,2078 | 0,4668 | |||
| APH / Amphenol Corporation | 0,08 | 42,33 | 7,76 | 114,28 | 1,1923 | 0,6092 | |||
| FSV / FirstService Corporation | 0,04 | −2,80 | 7,72 | 2,28 | 1,1869 | −0,0291 | |||
| ADP / Automatic Data Processing, Inc. | 0,02 | 19,37 | 7,61 | 20,49 | 1,1692 | 0,1523 | |||
| EQT / EQT Corporation | 0,13 | −3,10 | 7,58 | 5,78 | 1,1644 | 0,0107 | |||
| TJX / The TJX Companies, Inc. | 0,06 | −12,84 | 7,43 | −11,63 | 1,1422 | −0,2123 | |||
| ADI / Analog Devices, Inc. | 0,03 | 0,00 | 7,39 | 18,03 | 1,1357 | 0,1273 | |||
| MAR / Marriott International, Inc. | 0,03 | −3,77 | 7,03 | 10,36 | 1,0802 | 0,0546 | |||
| HEI / HEICO Corporation | 0,02 | −19,47 | 6,91 | −1,14 | 1,0618 | −0,0638 | |||
| WCN / Waste Connections, Inc. | 0,04 | −10,47 | 6,81 | −14,35 | 1,0466 | −0,2340 | |||
| LIN / Linde plc | 0,01 | −3,63 | 6,81 | −2,89 | 1,0464 | −0,0829 | |||
| AME / AMETEK, Inc. | 0,04 | −3,44 | 6,75 | 1,52 | 1,0378 | −0,0336 | |||
| MCK / McKesson Corporation | 0,01 | −3,98 | 6,58 | 4,56 | 1,0116 | −0,0023 | |||
| ZTS / Zoetis Inc. | 0,04 | 26,39 | 6,51 | 19,72 | 0,9998 | 0,1246 | |||
| BURL / Burlington Stores, Inc. | 0,03 | −29,42 | 6,50 | −31,11 | 0,9987 | −0,5204 | |||
| BKNG / Booking Holdings Inc. | 0,00 | −35,02 | 6,33 | −18,34 | 0,9722 | −0,2755 | |||
| EW / Edwards Lifesciences Corporation | 0,08 | 0,00 | 6,24 | 7,91 | 0,9581 | 0,0276 | |||
| DGX / Quest Diagnostics Incorporated | 0,03 | 6,21 | 0,9538 | 0,9538 | |||||
| IT / Gartner, Inc. | 0,02 | −3,66 | 6,15 | −7,23 | 0,9444 | −0,1224 | |||
| BJ / BJ's Wholesale Club Holdings, Inc. | 0,06 | −31,40 | 6,07 | −35,17 | 0,9329 | −0,5750 | |||
| SNPS / Synopsys, Inc. | 0,01 | 40,96 | 6,06 | 68,52 | 0,9313 | 0,3521 | |||
| ISRG / Intuitive Surgical, Inc. | 0,01 | −17,90 | 5,70 | −9,92 | 0,8763 | −0,1431 | |||
| BAH / Booz Allen Hamilton Holding Corporation | 0,05 | 120,98 | 5,50 | 78,78 | 0,8456 | 0,3756 | |||
| OWL / Blue Owl Capital Inc. | 0,26 | −38,23 | 5,08 | −40,79 | 0,7807 | −0,6010 | |||
| PH / Parker-Hannifin Corporation | 0,01 | −23,42 | 5,04 | −12,01 | 0,7738 | −0,1477 | |||
| HUM / Humana Inc. | 0,02 | 5,28 | 4,73 | −43,78 | 0,7270 | −0,7467 | |||
| CSGP / CoStar Group, Inc. | 0,06 | 0,00 | 4,53 | 1,48 | 0,6954 | −0,0227 | |||
| SPF / Spotify Technology S.A. | 0,01 | 0,00 | 4,14 | 39,49 | 0,6367 | 0,1584 | |||
| S+P 500 INDEX / DE (000000000) | 0,20 | 0,0306 | 0,0306 | ||||||
| S+P 500 INDEX / DE (000000000) | 0,13 | 0,0194 | 0,0194 | ||||||
| US61747C7074 / Morgan Stanley Institutional Liquidity Funds Government Portfolio, Institutional Class | 0,11 | −99,04 | 0,11 | −99,05 | 0,0170 | −1,8521 | |||
| S+P 500 INDEX / DE (000000000) | 0,10 | 0,0153 | 0,0153 | ||||||
| S+P 500 INDEX / DE (000000000) | 0,05 | 0,0070 | 0,0070 | ||||||
| S+P 500 INDEX / DE (000000000) | 0,04 | 0,0068 | 0,0068 | ||||||
| S+P 500 INDEX / DE (000000000) | 0,03 | 0,0046 | 0,0046 | ||||||
| S+P 500 INDEX / DE (000000000) | 0,01 | 0,0022 | 0,0022 | ||||||
| S+P 500 INDEX / DE (000000000) | 0,01 | 0,0017 | 0,0017 | ||||||
| S+P 500 INDEX / DE (000000000) | 0,00 | 0,0005 | 0,0005 | ||||||
| S+P 500 INDEX / DE (000000000) | 0,00 | 0,0001 | 0,0001 | ||||||
| S+P 500 INDEX / DE (000000000) | 0,00 | 0,0001 | 0,0001 | ||||||
| S+P 500 INDEX / DE (000000000) | −0,30 | −0,0456 | −0,0456 | ||||||
| S+P 500 INDEX / DE (000000000) | −0,45 | −0,0691 | −0,0691 | ||||||
| S+P 500 INDEX / DE (000000000) | −0,46 | −0,0703 | −0,0703 | ||||||
| S+P 500 INDEX / DE (000000000) | −0,54 | −0,0833 | −0,0833 | ||||||
| S+P 500 INDEX / DE (000000000) | −0,58 | −0,0889 | −0,0889 | ||||||
| S+P 500 INDEX / DE (000000000) | −0,63 | −0,0974 | −0,0974 | ||||||
| S+P 500 INDEX / DE (000000000) | −0,65 | −0,1006 | −0,1006 | ||||||
| S+P 500 INDEX / DE (000000000) | −0,66 | −0,1022 | −0,1022 | ||||||
| S+P 500 INDEX / DE (000000000) | −0,88 | −0,1355 | −0,1355 | ||||||
| S+P 500 INDEX / DE (000000000) | −0,95 | −0,1457 | −0,1457 | ||||||
| S+P 500 INDEX / DE (000000000) | −1,06 | −0,1634 | −0,1634 |