Grundläggande statistik
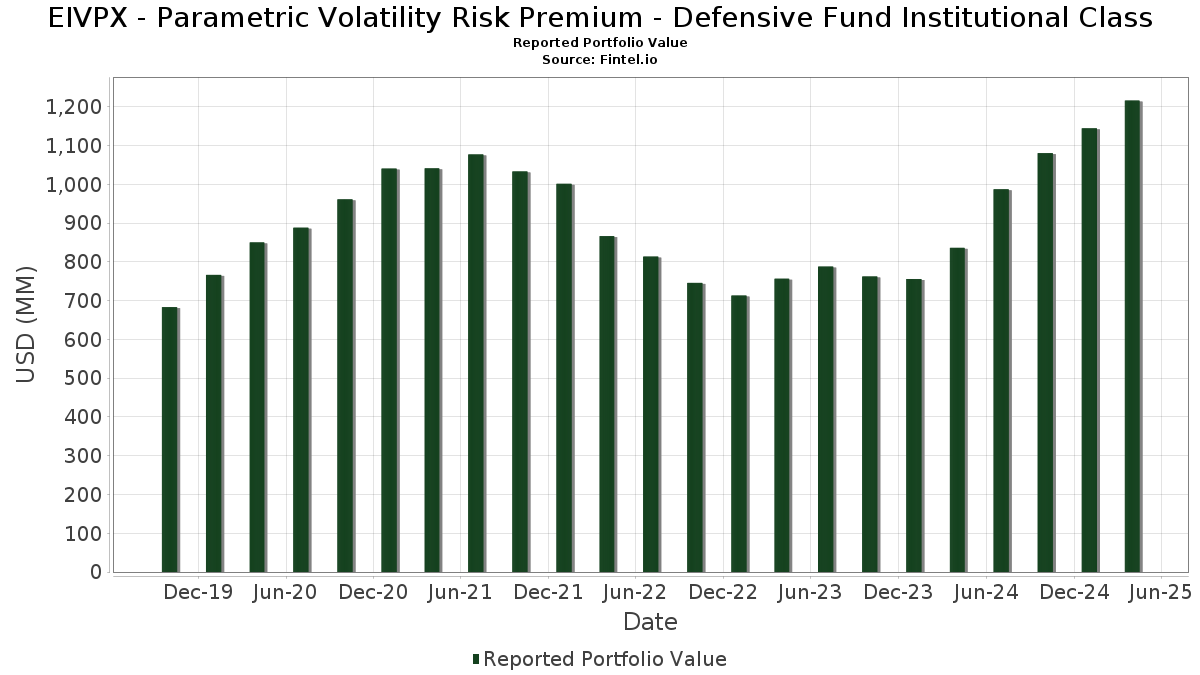
| Portföljvärde | $ 1 216 316 235 |
| Aktuella positioner | 229 |
Senaste innehav, resultat, förvaltat kapital (från 13F, 13D)
EIVPX - Parametric Volatility Risk Premium - Defensive Fund Institutional Class har redovisat 229 totala innehav i sina senaste SEC-arkiveringar. Det senaste portföljvärdet beräknas vara $ 1 216 316 235 USD. Faktiskt förvaltade tillgångar (AUM) är detta värde plus likvida medel (som inte redovisas). EIVPX - Parametric Volatility Risk Premium - Defensive Fund Institutional Classs största innehav är United States Treasury Note/Bond (US:US91282CAB72) , U.S. Treasury Notes 2.75%, due 06/30/2025 (US:US912828XZ81) , Apple Inc. (US:AAPL) , U.S. Treasury Notes (US:US91282CEQ06) , and Microsoft Corporation (US:MSFT) . EIVPX - Parametric Volatility Risk Premium - Defensive Fund Institutional Classs nya positioner inkluderar United States Treasury Note/Bond (US:US91282CAB72) , U.S. Treasury Notes 2.75%, due 06/30/2025 (US:US912828XZ81) , U.S. Treasury Notes (US:US91282CEQ06) , UST NOTES 4.875% 11/30/2025 (US:US91282CJL63) , and United States Treasury Note/Bond (US:US91282CJE21) .
Största ökningarna detta kvartal
Vi använder förändringen i portföljallokeringen eftersom det är det mest meningsfulla måttet. Förändringar kan bero på transaktioner eller förändringar i aktiekurser.
| Värdepapper | Aktier (MM) |
Värde (MM$) |
Portfölj % av | ΔPortfölj % av |
|---|---|---|---|---|
| 35,58 | 3,2644 | 3,2644 | ||
| 35,58 | 3,2644 | 3,2644 | ||
| 29,06 | 2,6667 | 2,6667 | ||
| 13,20 | 1,2115 | 1,2115 | ||
| 13,20 | 1,2115 | 1,2115 | ||
| 13,02 | 1,1950 | 1,1950 | ||
| 13,02 | 1,1950 | 1,1950 | ||
| 10,75 | 0,9860 | 0,9860 | ||
| 10,20 | 0,9360 | 0,9360 | ||
| 7,00 | 0,6419 | 0,6419 |
Största minskningarna detta kvartal
Vi använder förändringen i portföljallokeringen eftersom det är det mest meningsfulla måttet. Förändringar kan bero på transaktioner eller förändringar i aktiepriser.
| Värdepapper | Aktier (MM) |
Värde (MM$) |
Portfölj % av | ΔPortfölj % av |
|---|---|---|---|---|
| 2,70 | 0,2480 | −1,3021 | ||
| 2,70 | 0,2480 | −1,3021 | ||
| 2,70 | 0,2480 | −1,3021 | ||
| 22,61 | 22,61 | 2,0747 | −1,2470 | |
| 0,16 | 34,51 | 3,1665 | −0,5343 | |
| 0,04 | 10,20 | 0,9358 | −0,3596 | |
| 0,03 | 14,82 | 1,3601 | −0,2996 | |
| 0,28 | 30,44 | 2,7934 | −0,2759 | |
| 0,12 | 21,82 | 2,0023 | −0,2722 | |
| 0,07 | 11,05 | 1,0139 | −0,2631 |
13F- och fond arkiveringar
Denna blankett lämnades in den 2025-06-27 för rapporteringsperioden 2025-04-30. Klicka på länksymbolen för att se hela transaktionshistoriken.
Uppgradera för att låsa upp premiumdata och exportera till Excel![]() .
.
| Värdepapper | Typ | Genomsnittligt aktiepris | Aktier (MM) |
ΔAktier (%) |
ΔAktier (%) |
Värde ($MM) |
Portfölj (%) |
ΔPortfölj (%) |
|
|---|---|---|---|---|---|---|---|---|---|
| US91282CAB72 / United States Treasury Note/Bond | 56,78 | 0,95 | 5,2095 | 0,2279 | |||||
| US912828XZ81 / U.S. Treasury Notes 2.75%, due 06/30/2025 | 49,88 | 0,37 | 4,5765 | 0,1747 | |||||
| U.S. Treasury Bills / STIV (US912797PM34) | 35,58 | 3,2644 | 3,2644 | ||||||
| U.S. Treasury Bills / STIV (US912797PM34) | 35,58 | 3,2644 | 3,2644 | ||||||
| AAPL / Apple Inc. | 0,16 | −8,27 | 34,51 | −17,40 | 3,1665 | −0,5343 | |||
| US91282CEQ06 / U.S. Treasury Notes | 33,41 | 0,37 | 3,0651 | 0,1170 | |||||
| MSFT / Microsoft Corporation | 0,08 | −4,73 | 32,59 | −9,27 | 2,9906 | −0,1915 | |||
| NVDA / NVIDIA Corporation | 0,28 | −3,15 | 30,44 | −12,14 | 2,7934 | −0,2759 | |||
| US91282CJL63 / UST NOTES 4.875% 11/30/2025 | 29,06 | 2,6667 | 2,6667 | ||||||
| US91282CJE21 / United States Treasury Note/Bond | 28,39 | −0,10 | 2,6045 | 0,0876 | |||||
| US91282CJB81 / United States Treasury Note/Bond | 28,09 | −0,13 | 2,5773 | 0,0860 | |||||
| U.S. Treasury Bills / STIV (US912797MH75) | 26,42 | 0,98 | 2,4239 | 0,1066 | |||||
| U.S. Treasury Bills / STIV (US912797MS31) | 25,39 | 0,98 | 2,3296 | 0,1025 | |||||
| U.S. Treasury Bills / STIV (US912797MS31) | 25,39 | 0,98 | 2,3296 | 0,1025 | |||||
| U.S. Treasury Bills / STIV (US912797MS31) | 25,39 | 0,98 | 2,3296 | 0,1025 | |||||
| US91282CHN48 / United States Treasury Note/Bond | 25,38 | −0,12 | 2,3287 | 0,0779 | |||||
| U.S. Treasury Bills / STIV (US912797MG92) | 25,06 | 1,01 | 2,2998 | 0,1018 | |||||
| US91282CHL81 / United States Treasury Note/Bond | 25,01 | −0,08 | 2,2952 | 0,0778 | |||||
| US91282CAT80 / United States Treasury Note/Bond | 23,54 | 1,01 | 2,1599 | 0,0956 | |||||
| US61747C7074 / Morgan Stanley Institutional Liquidity Funds Government Portfolio, Institutional Class | 22,61 | −39,70 | 22,61 | −39,70 | 2,0747 | −1,2470 | |||
| AMZN / Amazon.com, Inc. | 0,12 | 9,53 | 21,82 | −15,01 | 2,0023 | −0,2722 | |||
| META / Meta Platforms, Inc. | 0,03 | −0,69 | 14,82 | −20,88 | 1,3601 | −0,2996 | |||
| U.S. Treasury Bills / STIV (US912797PD35) | 13,20 | 1,2115 | 1,2115 | ||||||
| U.S. Treasury Bills / STIV (US912797PD35) | 13,20 | 1,2115 | 1,2115 | ||||||
| U.S. Treasury Bills / STIV (US912797QD26) | 13,02 | 1,1950 | 1,1950 | ||||||
| U.S. Treasury Bills / STIV (US912797QD26) | 13,02 | 1,1950 | 1,1950 | ||||||
| BRK.B / Berkshire Hathaway Inc. | 0,02 | 1,58 | 12,86 | 15,57 | 1,1802 | 0,1944 | |||
| US912828K742 / United States Treasury Note/Bond | 12,66 | 0,55 | 1,1614 | 0,0462 | |||||
| AVGO / Broadcom Inc. | 0,06 | 1,89 | 12,27 | −11,37 | 1,1263 | −0,1005 | |||
| GOOGL / Alphabet Inc. | 0,07 | −1,53 | 11,05 | −23,35 | 1,0139 | −0,2631 | |||
| U.S. Treasury Notes / DBT (US91282CKB62) | 10,75 | 0,9860 | 0,9860 | ||||||
| US91282CJS17 / United States Treasury Note/Bond - When Issued | 10,20 | 0,9360 | 0,9360 | ||||||
| TSLA / Tesla, Inc. | 0,04 | 0,00 | 10,20 | −30,27 | 0,9358 | −0,3596 | |||
| LLY / Eli Lilly and Company | 0,01 | 0,00 | 10,15 | 10,84 | 0,9311 | 0,1201 | |||
| JPM / JPMorgan Chase & Co. | 0,04 | 4,16 | 9,52 | −4,68 | 0,8731 | −0,0111 | |||
| U.S. Treasury Bills / STIV (US912797NL78) | 9,21 | 1,08 | 0,8455 | 0,0379 | |||||
| GOOG / Alphabet Inc. | 0,06 | −3,52 | 9,11 | −24,51 | 0,8362 | −0,2330 | |||
| US91282CFE66 / United States Treasury Note/Bond | 8,47 | 0,27 | 0,7769 | 0,0289 | |||||
| V / Visa Inc. | 0,02 | 2,13 | 8,40 | 3,25 | 0,7706 | 0,0500 | |||
| U.S. Treasury Bills / STIV (US912797LN52) | 7,82 | 1,02 | 0,7176 | 0,0318 | |||||
| U.S. Treasury Bills / STIV (US912797LN52) | 7,82 | 1,02 | 0,7176 | 0,0318 | |||||
| NFLX / Netflix, Inc. | 0,01 | 16,36 | 7,30 | 34,81 | 0,6699 | 0,1902 | |||
| US912828P469 / United States Treasury Note/Bond | 7,00 | 0,6419 | 0,6419 | ||||||
| XOM / Exxon Mobil Corporation | 0,06 | 18,38 | 6,69 | 17,05 | 0,6137 | 0,1075 | |||
| MA / Mastercard Incorporated | 0,01 | 0,72 | 6,66 | −0,61 | 0,6115 | 0,0175 | |||
| COST / Costco Wholesale Corporation | 0,01 | 0,00 | 6,36 | 1,48 | 0,5835 | 0,0285 | |||
| WMT / Walmart Inc. | 0,06 | 12,72 | 6,14 | 11,68 | 0,5633 | 0,0763 | |||
| JNJ / Johnson & Johnson | 0,04 | 0,00 | 5,81 | 2,74 | 0,5330 | 0,0322 | |||
| PG / The Procter & Gamble Company | 0,04 | 0,36 | 5,74 | −1,71 | 0,5266 | 0,0094 | |||
| HD / The Home Depot, Inc. | 0,02 | 13,12 | 5,50 | −1,03 | 0,5046 | 0,0124 | |||
| UNH / UnitedHealth Group Incorporated | 0,01 | 0,00 | 5,45 | −24,16 | 0,5001 | −0,1365 | |||
| ABBV / AbbVie Inc. | 0,03 | 10,07 | 5,37 | 16,79 | 0,4928 | 0,0854 | |||
| PM / Philip Morris International Inc. | 0,03 | −1,31 | 4,91 | 29,90 | 0,4509 | 0,1158 | |||
| KO / The Coca-Cola Company | 0,07 | 0,00 | 4,85 | 14,27 | 0,4446 | 0,0691 | |||
| US91282CHV63 / TREASURY NOTE | 4,26 | −0,16 | 0,3906 | 0,0129 | |||||
| US91282CAJ09 / UST NOTES 0.25% 08/31/2025 | 4,19 | 0,96 | 0,3846 | 0,0169 | |||||
| BAC / Bank of America Corporation | 0,10 | −3,84 | 4,17 | −17,18 | 0,3823 | −0,0633 | |||
| CSCO / Cisco Systems, Inc. | 0,07 | 0,00 | 4,13 | −4,73 | 0,3791 | −0,0051 | |||
| ORCL / Oracle Corporation | 0,03 | 7,32 | 4,07 | −11,19 | 0,3736 | −0,0325 | |||
| MCD / McDonald's Corporation | 0,01 | 2,71 | 4,04 | 13,71 | 0,3708 | 0,0560 | |||
| ABT / Abbott Laboratories | 0,03 | 25,80 | 4,00 | 28,58 | 0,3666 | 0,0913 | |||
| PLTR / Palantir Technologies Inc. | 0,03 | 63,70 | 3,90 | 135,06 | 0,3581 | 0,2110 | |||
| LIN / Linde plc | 0,01 | 0,00 | 3,85 | 1,61 | 0,3536 | 0,0176 | |||
| PGR / The Progressive Corporation | 0,01 | 0,00 | 3,74 | 14,32 | 0,3430 | 0,0534 | |||
| MRK / Merck & Co., Inc. | 0,04 | 53,27 | 3,72 | 32,16 | 0,3409 | 0,0919 | |||
| CVX / Chevron Corporation | 0,03 | 27,95 | 3,68 | 16,69 | 0,3374 | 0,0583 | |||
| VZ / Verizon Communications Inc. | 0,08 | 0,00 | 3,67 | 11,84 | 0,3364 | 0,0461 | |||
| UBER / Uber Technologies, Inc. | 0,04 | 3,58 | 0,3281 | 0,3281 | |||||
| ISRG / Intuitive Surgical, Inc. | 0,01 | 0,00 | 3,54 | −9,81 | 0,3249 | −0,0229 | |||
| CRM / Salesforce, Inc. | 0,01 | −17,51 | 3,51 | −35,14 | 0,3224 | −0,1574 | |||
| INTU / Intuit Inc. | 0,01 | 1,72 | 3,49 | 6,11 | 0,3203 | 0,0289 | |||
| WFC / Wells Fargo & Company | 0,05 | 17,13 | 3,48 | 5,55 | 0,3193 | 0,0273 | |||
| RTX / RTX Corporation | 0,03 | 0,00 | 3,41 | −2,18 | 0,3129 | 0,0041 | |||
| AMGN / Amgen Inc. | 0,01 | 0,00 | 3,36 | 1,91 | 0,3079 | 0,0163 | |||
| BSX / Boston Scientific Corporation | 0,03 | 0,00 | 3,35 | 0,48 | 0,3071 | 0,0121 | |||
| ACN / Accenture plc | 0,01 | −0,52 | 3,28 | −22,70 | 0,3006 | −0,0748 | |||
| SPGI / S&P Global Inc. | 0,01 | −0,21 | 3,25 | −4,30 | 0,2985 | −0,0026 | |||
| TMO / Thermo Fisher Scientific Inc. | 0,01 | 28,50 | 3,17 | −7,77 | 0,2907 | −0,0136 | |||
| PEP / PepsiCo, Inc. | 0,02 | 15,86 | 3,08 | 4,22 | 0,2830 | 0,0209 | |||
| ETN / Eaton Corporation plc | 0,01 | 0,00 | 3,08 | −9,80 | 0,2828 | −0,0199 | |||
| HON / Honeywell International Inc. | 0,01 | 1,70 | 3,00 | −4,30 | 0,2756 | −0,0024 | |||
| KLAC / KLA Corporation | 0,00 | 0,00 | 2,95 | −4,80 | 0,2710 | −0,0039 | |||
| QCOM / QUALCOMM Incorporated | 0,02 | −15,28 | 2,74 | −27,28 | 0,2515 | −0,0823 | |||
| U.S. Treasury Bills / STIV (US912797LB15) | 2,70 | −84,56 | 0,2480 | −1,3021 | |||||
| U.S. Treasury Bills / STIV (US912797LB15) | 2,70 | −84,56 | 0,2480 | −1,3021 | |||||
| U.S. Treasury Bills / STIV (US912797LB15) | 2,70 | −84,56 | 0,2480 | −1,3021 | |||||
| CRWD / CrowdStrike Holdings, Inc. | 0,01 | 76,01 | 2,70 | 89,61 | 0,2480 | 0,1217 | |||
| CMCSA / Comcast Corporation | 0,08 | 81,49 | 2,69 | 42,19 | 0,2471 | 0,0719 | |||
| ADI / Analog Devices, Inc. | 0,01 | 2,63 | 0,2417 | 0,2417 | |||||
| LMT / Lockheed Martin Corporation | 0,01 | 159,96 | 2,57 | 274,13 | 0,2362 | 0,1698 | |||
| ADBE / Adobe Inc. | 0,01 | −20,73 | 2,44 | −32,05 | 0,2237 | −0,0941 | |||
| TXN / Texas Instruments Incorporated | 0,02 | −16,30 | 2,42 | −27,44 | 0,2218 | −0,0733 | |||
| SNPS / Synopsys, Inc. | 0,01 | 2,33 | 0,2137 | 0,2137 | |||||
| DFS / Discover Financial Services | 0,01 | 0,00 | 2,32 | −9,15 | 0,2133 | −0,0134 | |||
| SHW / The Sherwin-Williams Company | 0,01 | 3,35 | 2,31 | 1,86 | 0,2115 | 0,0110 | |||
| RSG / Republic Services, Inc. | 0,01 | 0,00 | 2,28 | 15,59 | 0,2095 | 0,0346 | |||
| UNP / Union Pacific Corporation | 0,01 | 0,00 | 2,28 | −12,97 | 0,2094 | −0,0229 | |||
| LOW / Lowe's Companies, Inc. | 0,01 | 4,04 | 2,28 | −10,56 | 0,2092 | −0,0166 | |||
| AJG / Arthur J. Gallagher & Co. | 0,01 | 0,00 | 2,26 | 6,25 | 0,2075 | 0,0190 | |||
| MCO / Moody's Corporation | 0,00 | 2,25 | 0,2063 | 0,2063 | |||||
| SBUX / Starbucks Corporation | 0,03 | 0,00 | 2,23 | −25,67 | 0,2044 | −0,0610 | |||
| ETR / Entergy Corporation | 0,03 | 0,00 | 2,15 | 2,58 | 0,1972 | 0,0116 | |||
| NEE / NextEra Energy, Inc. | 0,03 | 26,77 | 2,14 | 18,47 | 0,1961 | 0,0363 | |||
| ADSK / Autodesk, Inc. | 0,01 | 2,11 | 0,1932 | 0,1932 | |||||
| COR / Cencora, Inc. | 0,01 | 0,00 | 2,09 | 15,15 | 0,1918 | 0,0310 | |||
| FICO / Fair Isaac Corporation | 0,00 | 14,63 | 2,07 | 21,73 | 0,1902 | 0,0394 | |||
| AMP / Ameriprise Financial, Inc. | 0,00 | 0,00 | 2,06 | −13,35 | 0,1889 | −0,0215 | |||
| NRG / NRG Energy, Inc. | 0,02 | −1,68 | 2,04 | 5,20 | 0,1876 | 0,0154 | |||
| LHX / L3Harris Technologies, Inc. | 0,01 | 4,03 | 2,01 | 7,95 | 0,1845 | 0,0195 | |||
| WAB / Westinghouse Air Brake Technologies Corporation | 0,01 | 0,00 | 1,99 | −11,15 | 0,1829 | −0,0158 | |||
| DHR / Danaher Corporation | 0,01 | −11,05 | 1,99 | −20,42 | 0,1828 | −0,0389 | |||
| PWR / Quanta Services, Inc. | 0,01 | 0,00 | 1,98 | −4,84 | 0,1821 | −0,0027 | |||
| INTC / Intel Corporation | 0,10 | 95,36 | 1,98 | 27,74 | 0,1817 | 0,0292 | |||
| VRSK / Verisk Analytics, Inc. | 0,01 | 0,00 | 1,94 | 3,13 | 0,1782 | 0,0114 | |||
| PSA / Public Storage | 0,01 | 0,00 | 1,93 | 0,68 | 0,1767 | 0,0072 | |||
| GWW / W.W. Grainger, Inc. | 0,00 | 0,00 | 1,92 | −3,62 | 0,1758 | −0,0003 | |||
| NDAQ / Nasdaq, Inc. | 0,02 | 0,00 | 1,90 | −7,46 | 0,1742 | −0,0075 | |||
| PAYC / Paycom Software, Inc. | 0,01 | 0,00 | 1,90 | 9,10 | 0,1739 | 0,0200 | |||
| PCAR / PACCAR Inc | 0,02 | 0,00 | 1,87 | −18,63 | 0,1715 | −0,0320 | |||
| OKE / ONEOK, Inc. | 0,02 | 0,00 | 1,80 | −15,48 | 0,1649 | −0,0234 | |||
| WEC / WEC Energy Group, Inc. | 0,02 | 0,00 | 1,79 | 10,34 | 0,1645 | 0,0206 | |||
| CBOE / Cboe Global Markets, Inc. | 0,01 | 0,00 | 1,77 | 8,59 | 0,1623 | 0,0180 | |||
| DGX / Quest Diagnostics Incorporated | 0,01 | 0,00 | 1,77 | 9,28 | 0,1622 | 0,0189 | |||
| UNM / Unum Group | 0,02 | −14,25 | 1,76 | −12,65 | 0,1616 | −0,0170 | |||
| KR / The Kroger Co. | 0,02 | 0,00 | 1,72 | 17,15 | 0,1580 | 0,0278 | |||
| EXR / Extra Space Storage Inc. | 0,01 | 23,53 | 1,71 | 17,51 | 0,1565 | 0,0279 | |||
| FLT / Corpay, Inc. | 0,01 | 0,00 | 1,70 | −14,48 | 0,1556 | −0,0201 | |||
| SYF / Synchrony Financial | 0,03 | 0,00 | 1,69 | −24,67 | 0,1550 | −0,0437 | |||
| EQR / Equity Residential | 0,02 | 0,00 | 1,67 | −0,54 | 0,1533 | 0,0045 | |||
| CMS / CMS Energy Corporation | 0,02 | 0,00 | 1,67 | 11,65 | 0,1531 | 0,0206 | |||
| STT / State Street Corporation | 0,02 | 2,12 | 1,65 | −11,48 | 0,1514 | −0,0137 | |||
| EVRG / Evergy, Inc. | 0,02 | 0,00 | 1,64 | 7,70 | 0,1502 | 0,0155 | |||
| AIG / American International Group, Inc. | 0,02 | 1,62 | 0,1491 | 0,1491 | |||||
| PNR / Pentair plc | 0,02 | 0,00 | 1,62 | −12,49 | 0,1486 | −0,0153 | |||
| PODD / Insulet Corporation | 0,01 | 0,00 | 1,62 | −9,42 | 0,1483 | −0,0097 | |||
| FCX / Freeport-McMoRan Inc. | 0,04 | 2,69 | 1,61 | 3,26 | 0,1481 | 0,0096 | |||
| CARR / Carrier Global Corporation | 0,03 | 22,89 | 1,58 | 17,55 | 0,1451 | 0,0259 | |||
| LNT / Alliant Energy Corporation | 0,03 | 0,00 | 1,57 | 3,69 | 0,1445 | 0,0099 | |||
| SWKS / Skyworks Solutions, Inc. | 0,02 | 1,57 | 0,1440 | 0,1440 | |||||
| CDW / CDW Corporation | 0,01 | 1,56 | 0,1434 | 0,1434 | |||||
| PARA / Paramount Global | 0,13 | 158,94 | 1,55 | 179,50 | 0,1426 | 0,0933 | |||
| HBAN / Huntington Bancshares Incorporated | 0,11 | 0,00 | 1,55 | −15,51 | 0,1420 | −0,0203 | |||
| TE Connectivity PLC / EC (IE000IVNQZ81) | 0,01 | −20,98 | 1,53 | −21,81 | 0,1405 | −0,0330 | |||
| TE Connectivity PLC / EC (IE000IVNQZ81) | 0,01 | −20,98 | 1,53 | −21,81 | 0,1405 | −0,0330 | |||
| TE Connectivity PLC / EC (IE000IVNQZ81) | 0,01 | −20,98 | 1,53 | −21,81 | 0,1405 | −0,0330 | |||
| EOG / EOG Resources, Inc. | 0,01 | 0,00 | 1,50 | −12,30 | 0,1375 | −0,0138 | |||
| EXPE / Expedia Group, Inc. | 0,01 | 0,00 | 1,49 | −8,21 | 0,1365 | −0,0070 | |||
| MAA / Mid-America Apartment Communities, Inc. | 0,01 | 0,00 | 1,47 | 4,63 | 0,1350 | 0,0104 | |||
| LEN / Lennar Corporation | 0,01 | 0,00 | 1,47 | −17,26 | 0,1346 | −0,0224 | |||
| GEV / GE Vernova Inc. | 0,00 | 0,38 | 1,46 | −0,14 | 0,1344 | 0,0044 | |||
| UDR / UDR, Inc. | 0,03 | 0,00 | 1,45 | 0,35 | 0,1332 | 0,0050 | |||
| VST / Vistra Corp. | 0,01 | 0,00 | 1,44 | −22,90 | 0,1326 | −0,0333 | |||
| KMI / Kinder Morgan, Inc. | 0,05 | 0,00 | 1,39 | −4,32 | 0,1280 | −0,0011 | |||
| SBAC / SBA Communications Corporation | 0,01 | 0,00 | 1,37 | 23,29 | 0,1258 | 0,0272 | |||
| HII / Huntington Ingalls Industries, Inc. | 0,01 | 11,77 | 1,35 | 30,60 | 0,1242 | 0,0323 | |||
| IDXX / IDEXX Laboratories, Inc. | 0,00 | 0,00 | 1,32 | 2,48 | 0,1214 | 0,0071 | |||
| LKQ / LKQ Corporation | 0,03 | −19,79 | 1,29 | −18,04 | 0,1181 | −0,0210 | |||
| RF / Regions Financial Corporation | 0,06 | −12,06 | 1,25 | −27,20 | 0,1148 | −0,0373 | |||
| HPQ / HP Inc. | 0,05 | 1,24 | 0,1138 | 0,1138 | |||||
| COP / ConocoPhillips | 0,01 | 0,00 | 1,21 | −9,89 | 0,1113 | −0,0079 | |||
| DVA / DaVita Inc. | 0,01 | 0,00 | 1,17 | −19,68 | 0,1075 | −0,0217 | |||
| AIZ / Assurant, Inc. | 0,01 | 0,42 | 1,16 | −10,05 | 0,1067 | −0,0078 | |||
| EG / Everest Group, Ltd. | 0,00 | 0,00 | 1,16 | 3,21 | 0,1062 | 0,0069 | |||
| OMC / Omnicom Group Inc. | 0,02 | −18,69 | 1,15 | −28,70 | 0,1051 | −0,0371 | |||
| KIM / Kimco Realty Corporation | 0,06 | 0,00 | 1,14 | −10,98 | 0,1049 | −0,0089 | |||
| AOS / A. O. Smith Corporation | 0,02 | 0,00 | 1,14 | 0,79 | 0,1049 | 0,0045 | |||
| DVN / Devon Energy Corporation | 0,04 | −16,01 | 1,14 | −25,08 | 0,1047 | −0,0303 | |||
| WAT / Waters Corporation | 0,00 | 0,00 | 1,11 | −16,37 | 0,1023 | −0,0157 | |||
| PKG / Packaging Corporation of America | 0,01 | 0,00 | 1,11 | −12,78 | 0,1016 | −0,0108 | |||
| FFIV / F5, Inc. | 0,00 | 0,00 | 1,09 | −10,98 | 0,1005 | −0,0084 | |||
| CCL / Carnival Corporation & plc | 0,06 | 0,00 | 1,09 | −33,74 | 0,1001 | −0,0457 | |||
| FITB / Fifth Third Bancorp | 0,03 | 0,00 | 1,09 | −18,91 | 0,0996 | −0,0189 | |||
| J / Jacobs Solutions Inc. | 0,01 | 0,00 | 1,05 | −11,65 | 0,0961 | −0,0089 | |||
| COO / The Cooper Companies, Inc. | 0,01 | 0,00 | 0,99 | −15,41 | 0,0907 | −0,0128 | |||
| AVY / Avery Dennison Corporation | 0,01 | 0,00 | 0,97 | −7,90 | 0,0888 | −0,0042 | |||
| BK / The Bank of New York Mellon Corporation | 0,01 | 0,00 | 0,95 | −6,41 | 0,0871 | −0,0028 | |||
| IQV / IQVIA Holdings Inc. | 0,01 | −14,02 | 0,94 | −33,80 | 0,0859 | −0,0394 | |||
| LVS / Las Vegas Sands Corp. | 0,03 | 0,93 | 0,0849 | 0,0849 | |||||
| HAS / Hasbro, Inc. | 0,01 | 0,00 | 0,91 | 7,08 | 0,0832 | 0,0082 | |||
| CAG / Conagra Brands, Inc. | 0,04 | −23,34 | 0,90 | −26,89 | 0,0824 | −0,0263 | |||
| RL / Ralph Lauren Corporation | 0,00 | 0,00 | 0,89 | −9,84 | 0,0816 | −0,0058 | |||
| WYNN / Wynn Resorts, Limited | 0,01 | 0,00 | 0,88 | −7,59 | 0,0804 | −0,0035 | |||
| CF / CF Industries Holdings, Inc. | 0,01 | 0,00 | 0,85 | −14,96 | 0,0783 | −0,0106 | |||
| ALK / Alaska Air Group, Inc. | 0,02 | 0,00 | 0,83 | −39,59 | 0,0762 | −0,0455 | |||
| IRM / Iron Mountain Incorporated | 0,01 | 68,39 | 0,82 | 48,56 | 0,0756 | 0,0265 | |||
| 0AD2 / Trimble Inc. | 0,01 | 0,78 | 0,0720 | 0,0720 | |||||
| PNW / Pinnacle West Capital Corporation | 0,01 | 0,00 | 0,78 | 9,52 | 0,0718 | 0,0085 | |||
| IVZ / Invesco Ltd. | 0,06 | −36,94 | 0,78 | −54,35 | 0,0714 | −0,0795 | |||
| MKC / McCormick & Company, Incorporated | 0,01 | 0,00 | 0,78 | −0,77 | 0,0713 | 0,0020 | |||
| JBHT / J.B. Hunt Transport Services, Inc. | 0,01 | −27,38 | 0,77 | −44,60 | 0,0707 | −0,0525 | |||
| ROST / Ross Stores, Inc. | 0,01 | 103,94 | 0,76 | 98,18 | 0,0700 | 0,0321 | |||
| EXPD / Expeditors International of Washington, Inc. | 0,01 | 0,00 | 0,74 | −3,28 | 0,0678 | 0,0002 | |||
| US4039491000 / HF Sinclair Corp. | 0,02 | 0,00 | 0,70 | −16,71 | 0,0646 | −0,0102 | |||
| ABNB / Airbnb, Inc. | 0,01 | −46,21 | 0,66 | −50,00 | 0,0604 | −0,0562 | |||
| BBWI / Bath & Body Works, Inc. | 0,02 | 0,00 | 0,62 | −18,90 | 0,0568 | −0,0108 | |||
| KMX / CarMax, Inc. | 0,01 | 0,00 | 0,61 | −24,53 | 0,0557 | −0,0155 | |||
| CPB / The Campbell's Company | 0,02 | 0,00 | 0,60 | −6,08 | 0,0553 | −0,0015 | |||
| LDOS / Leidos Holdings, Inc. | 0,00 | 0,59 | 0,0544 | 0,0544 | |||||
| TER / Teradyne, Inc. | 0,01 | −19,84 | 0,47 | −48,58 | 0,0431 | −0,0379 | |||
| MTCH / Match Group, Inc. | 0,01 | 26,42 | 0,44 | 4,04 | 0,0402 | 0,0013 | |||
| APA / APA Corporation | 0,03 | 0,00 | 0,42 | −29,25 | 0,0383 | −0,0139 | |||
| SMCI / Super Micro Computer, Inc. | 0,01 | 0,00 | 0,37 | 11,89 | 0,0337 | 0,0046 | |||
| ENPH / Enphase Energy, Inc. | 0,01 | 2,07 | 0,33 | −26,87 | 0,0305 | −0,0098 | |||
| LUV / Southwest Airlines Co. | 0,01 | −63,21 | 0,32 | −66,56 | 0,0290 | −0,0545 | |||
| SEE / Sealed Air Corporation | 0,01 | −28,66 | 0,28 | −43,65 | 0,0261 | −0,0186 | |||
| HST / Host Hotels & Resorts, Inc. | 0,01 | 0,21 | 0,0189 | 0,0189 | |||||
| AMTM / Amentum Holdings, Inc. | 0,01 | 0,00 | 0,18 | 3,95 | 0,0169 | 0,0012 | |||
| MRP / Millrose Properties, Inc. | 0,01 | 0,00 | 0,17 | 128,38 | 0,0155 | 0,0089 | |||
| QRVO / Qorvo, Inc. | 0,00 | −90,13 | 0,15 | −91,48 | 0,0140 | −0,1441 | |||
| FLS / Flowserve Corporation | 0,00 | 0,00 | 0,13 | −27,59 | 0,0116 | −0,0039 | |||
| US71880K1016 / Phinia Inc | 0,00 | 0,00 | 0,09 | −21,43 | 0,0081 | −0,0018 | |||
| RHI / Robert Half Inc. | 0,00 | −100,00 | 0,00 | −100,00 | −0,1196 | ||||
| S+P 500 INDEX / DE (000000000) | −0,00 | −0,0003 | −0,0003 | ||||||
| S+P 500 INDEX / DE (000000000) | −0,02 | −0,0014 | −0,0014 | ||||||
| S+P 500 INDEX / DE (000000000) | −0,02 | −0,0020 | −0,0020 | ||||||
| S+P 500 INDEX / DE (000000000) | −0,05 | −0,0049 | −0,0049 | ||||||
| S+P 500 INDEX / DE (000000000) | −0,05 | −0,0049 | −0,0049 | ||||||
| S+P 500 INDEX / DE (000000000) | −0,05 | −0,0049 | −0,0049 | ||||||
| S+P 500 INDEX / DE (000000000) | −0,05 | −0,0049 | −0,0049 | ||||||
| S+P 500 INDEX / DE (000000000) | −0,14 | −0,0128 | −0,0128 | ||||||
| S+P 500 INDEX / DE (000000000) | −0,15 | −0,0136 | −0,0136 | ||||||
| S+P 500 INDEX / DE (000000000) | −0,19 | −0,0175 | −0,0175 | ||||||
| S+P 500 INDEX / DE (000000000) | −0,26 | −0,0239 | −0,0239 | ||||||
| S+P 500 INDEX / DE (000000000) | −0,26 | −0,0240 | −0,0240 | ||||||
| S+P 500 INDEX / DE (000000000) | −0,29 | −0,0270 | −0,0270 | ||||||
| S+P 500 INDEX / DE (000000000) | −0,32 | −0,0293 | −0,0293 | ||||||
| S+P 500 INDEX / DE (000000000) | −0,52 | −0,0479 | −0,0479 | ||||||
| S+P 500 INDEX / DE (000000000) | −0,62 | −0,0564 | −0,0564 | ||||||
| S+P 500 INDEX / DE (000000000) | −0,76 | −0,0695 | −0,0695 | ||||||
| S+P 500 INDEX / DE (000000000) | −1,32 | −0,1211 | −0,1211 |