Grundläggande statistik
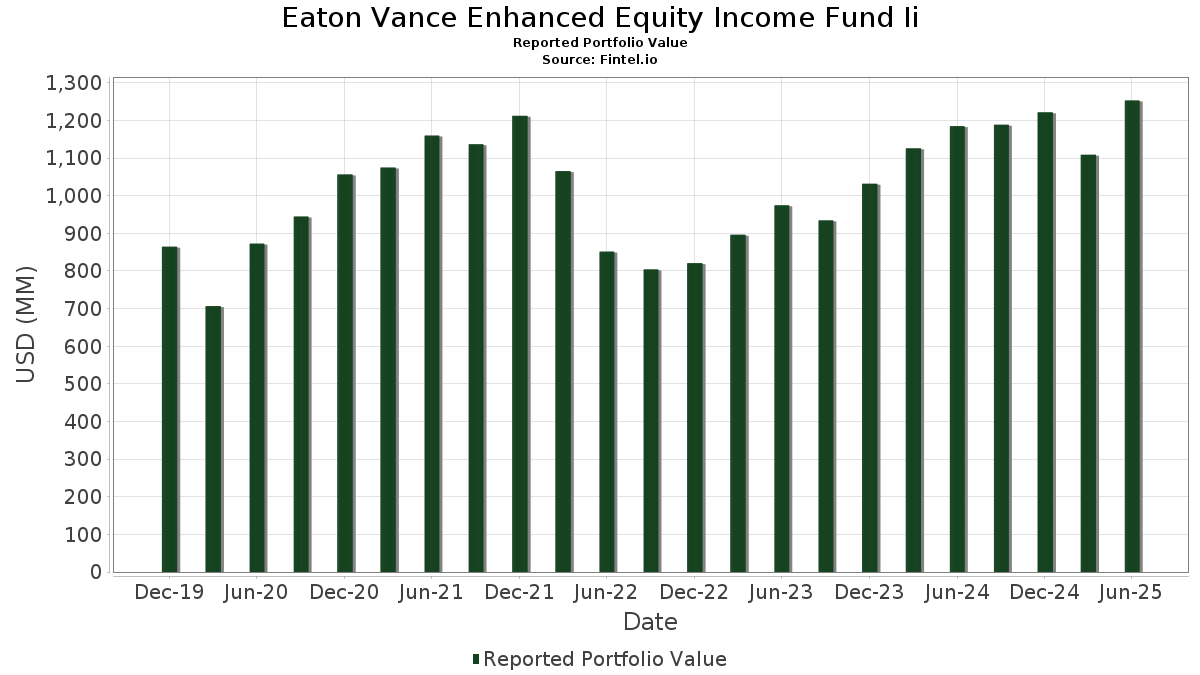
| Portföljvärde | $ 1 252 785 722 |
| Aktuella positioner | 96 |
Senaste innehav, resultat, förvaltat kapital (från 13F, 13D)
Eaton Vance Enhanced Equity Income Fund Ii har redovisat 96 totala innehav i sina senaste SEC-arkiveringar. Det senaste portföljvärdet beräknas vara $ 1 252 785 722 USD. Faktiskt förvaltade tillgångar (AUM) är detta värde plus likvida medel (som inte redovisas). Eaton Vance Enhanced Equity Income Fund Iis största innehav är NVIDIA Corporation (US:NVDA) , Microsoft Corporation (US:MSFT) , Amazon.com, Inc. (US:AMZN) , Apple Inc. (US:AAPL) , and Broadcom Inc. (US:AVGO) . Eaton Vance Enhanced Equity Income Fund Iis nya positioner inkluderar Synopsys, Inc. (US:SNPS) , AAON, Inc. (US:AAON) , Humana Inc. (MX:HUM) , Caris Life Sciences, Inc. (US:CAI) , and .
Största ökningarna detta kvartal
Vi använder förändringen i portföljallokeringen eftersom det är det mest meningsfulla måttet. Förändringar kan bero på transaktioner eller förändringar i aktiekurser.
| Värdepapper | Aktier (MM) |
Värde (MM$) |
Portfölj % av | ΔPortfölj % av |
|---|---|---|---|---|
| 1,03 | 162,54 | 12,9846 | 2,8466 | |
| 0,26 | 70,64 | 5,6430 | 1,5710 | |
| 0,23 | 112,97 | 9,0247 | 1,3039 | |
| 0,03 | 16,22 | 1,2962 | 1,2962 | |
| 0,17 | 12,80 | 1,0222 | 1,0222 | |
| 0,03 | 42,70 | 3,4116 | 0,7446 | |
| 0,08 | 61,92 | 4,9464 | 0,6104 | |
| 0,10 | 34,31 | 2,7413 | 0,6045 | |
| 0,03 | 6,88 | 0,5494 | 0,5494 | |
| 0,04 | 29,62 | 2,3660 | 0,2698 |
Största minskningarna detta kvartal
Vi använder förändringen i portföljallokeringen eftersom det är det mest meningsfulla måttet. Förändringar kan bero på transaktioner eller förändringar i aktiepriser.
| Värdepapper | Aktier (MM) |
Värde (MM$) |
Portfölj % av | ΔPortfölj % av |
|---|---|---|---|---|
| 0,37 | 76,10 | 6,0792 | −1,3094 | |
| 0,04 | 28,45 | 2,2724 | −1,2831 | |
| 0,39 | 69,34 | 5,5390 | −1,0670 | |
| 0,05 | 8,66 | 0,6916 | −0,7481 | |
| 0,07 | 9,81 | 0,7834 | −0,6196 | |
| 0,04 | 6,33 | 0,5054 | −0,4368 | |
| 0,01 | 6,34 | 0,5061 | −0,4123 | |
| 0,23 | 28,59 | 2,2841 | −0,2956 | |
| 0,34 | 6,57 | 0,5249 | −0,2844 | |
| 0,07 | 12,09 | 0,9661 | −0,2815 |
13F- och fond arkiveringar
Denna blankett lämnades in den 2025-08-25 för rapporteringsperioden 2025-06-30. Klicka på länksymbolen för att se hela transaktionshistoriken.
Uppgradera för att låsa upp premiumdata och exportera till Excel![]() .
.
| Värdepapper | Typ | Genomsnittligt aktiepris | Aktier (MM) |
ΔAktier (%) |
ΔAktier (%) |
Värde ($MM) |
Portfölj (%) |
ΔPortfölj (%) |
|
|---|---|---|---|---|---|---|---|---|---|
| NVDA / NVIDIA Corporation | 1,03 | −1,37 | 162,54 | 43,78 | 12,9846 | 2,8466 | |||
| MSFT / Microsoft Corporation | 0,23 | −0,97 | 112,97 | 31,22 | 9,0247 | 1,3039 | |||
| AMZN / Amazon.com, Inc. | 0,46 | −2,43 | 100,54 | 12,51 | 8,0319 | 0,0179 | |||
| AAPL / Apple Inc. | 0,37 | 0,00 | 76,10 | −7,64 | 6,0792 | −1,3094 | |||
| AVGO / Broadcom Inc. | 0,26 | −5,51 | 70,64 | 55,57 | 5,6430 | 1,5710 | |||
| GOOG / Alphabet Inc. | 0,39 | −17,10 | 69,34 | −5,87 | 5,5390 | −1,0670 | |||
| META / Meta Platforms, Inc. | 0,08 | 0,00 | 61,92 | 28,06 | 4,9464 | 0,6104 | |||
| NFLX / Netflix, Inc. | 0,03 | 0,00 | 42,70 | 43,60 | 3,4116 | 0,7446 | |||
| V / Visa Inc. | 0,10 | 42,15 | 34,31 | 44,01 | 2,7413 | 0,6045 | |||
| INTU / Intuit Inc. | 0,04 | −1,22 | 29,62 | 26,71 | 2,3660 | 0,2698 | |||
| TJX / The TJX Companies, Inc. | 0,23 | −1,97 | 28,59 | −0,60 | 2,2841 | −0,2956 | |||
| LLY / Eli Lilly and Company | 0,04 | −23,98 | 28,45 | −28,25 | 2,2724 | −1,2831 | |||
| US61747C7074 / Morgan Stanley Institutional Liquidity Funds Government Portfolio, Institutional Class | 25,10 | 27,24 | 25,10 | 27,24 | 2,0048 | 0,2360 | |||
| LRCX / Lam Research Corporation | 0,23 | −20,51 | 22,35 | 6,43 | 1,7853 | −0,0978 | |||
| COST / Costco Wholesale Corporation | 0,02 | −1,44 | 21,08 | 3,16 | 1,6843 | −0,1485 | |||
| ISRG / Intuitive Surgical, Inc. | 0,03 | −2,07 | 18,74 | 7,45 | 1,4969 | −0,0671 | |||
| FOUR / Shift4 Payments, Inc. | 0,17 | 0,00 | 16,43 | 21,30 | 1,3123 | 0,0978 | |||
| SNPS / Synopsys, Inc. | 0,03 | 16,22 | 1,2962 | 1,2962 | |||||
| KO / The Coca-Cola Company | 0,23 | 0,00 | 16,18 | −1,21 | 1,2926 | −0,1763 | |||
| HEI / HEICO Corporation | 0,04 | 0,00 | 14,50 | 22,76 | 1,1587 | 0,0991 | |||
| FICO / Fair Isaac Corporation | 0,01 | 41,04 | 14,20 | 39,80 | 1,1342 | 0,2234 | |||
| FTNT / Fortinet, Inc. | 0,12 | 0,00 | 13,06 | 9,83 | 1,0436 | −0,0231 | |||
| CNSWF / Constellation Software Inc. | 0,00 | 17,21 | 12,81 | 35,71 | 1,0232 | 0,1768 | |||
| AAON / AAON, Inc. | 0,17 | 12,80 | 1,0222 | 1,0222 | |||||
| TT / Trane Technologies plc | 0,03 | −14,91 | 12,75 | 10,47 | 1,0182 | −0,0165 | |||
| WMT / Walmart Inc. | 0,13 | 0,00 | 12,64 | 11,38 | 1,0098 | −0,0080 | |||
| WCN / Waste Connections, Inc. | 0,07 | −8,15 | 12,52 | −12,14 | 1,0001 | −0,2776 | |||
| AME / AMETEK, Inc. | 0,07 | −17,30 | 12,09 | −13,07 | 0,9661 | −0,2815 | |||
| ANET / Arista Networks Inc | 0,12 | 0,00 | 12,03 | 32,05 | 0,9612 | 0,1440 | |||
| TSLA / Tesla, Inc. | 0,04 | 0,00 | 11,38 | 22,58 | 0,9090 | 0,0765 | |||
| TRU / TransUnion | 0,13 | 0,00 | 11,30 | 6,04 | 0,9030 | −0,0530 | |||
| NTNX / Nutanix, Inc. | 0,15 | 0,00 | 11,25 | 9,49 | 0,8986 | −0,0227 | |||
| CPRT / Copart, Inc. | 0,23 | 15,14 | 11,21 | −0,17 | 0,8954 | −0,1114 | |||
| IT / Gartner, Inc. | 0,03 | 0,00 | 11,01 | −3,70 | 0,8797 | −0,1458 | |||
| EW / Edwards Lifesciences Corporation | 0,13 | 0,00 | 10,54 | 7,91 | 0,8418 | −0,0340 | |||
| TW / Tradeweb Markets Inc. | 0,07 | −36,44 | 9,81 | −37,32 | 0,7834 | −0,6196 | |||
| BJ / BJ's Wholesale Club Holdings, Inc. | 0,09 | 0,00 | 9,64 | −5,50 | 0,7703 | −0,1447 | |||
| CSGP / CoStar Group, Inc. | 0,11 | 19,99 | 9,23 | 21,76 | 0,7375 | 0,0575 | |||
| ADI / Analog Devices, Inc. | 0,04 | 0,00 | 8,66 | 18,03 | 0,6918 | 0,0338 | |||
| ABBV / AbbVie Inc. | 0,05 | −46,13 | 8,66 | −49,37 | 0,6916 | −0,7481 | |||
| AJG / Arthur J. Gallagher & Co. | 0,03 | 0,00 | 8,52 | −7,28 | 0,6806 | −0,1434 | |||
| MCK / McKesson Corporation | 0,01 | −6,09 | 7,74 | 2,26 | 0,6185 | −0,0605 | |||
| HUM / Humana Inc. | 0,03 | 6,88 | 0,5494 | 0,5494 | |||||
| OWL / Blue Owl Capital Inc. | 0,34 | −24,04 | 6,57 | −27,19 | 0,5249 | −0,2844 | |||
| HD / The Home Depot, Inc. | 0,02 | 0,00 | 6,47 | 0,05 | 0,5168 | −0,0631 | |||
| BURL / Burlington Stores, Inc. | 0,03 | 0,00 | 6,44 | −2,40 | 0,5141 | −0,0771 | |||
| SPGI / S&P Global Inc. | 0,01 | −40,39 | 6,34 | −38,13 | 0,5061 | −0,4123 | |||
| FSV / FirstService Corporation | 0,04 | −42,77 | 6,33 | −39,79 | 0,5054 | −0,4368 | |||
| ICE / Intercontinental Exchange, Inc. | 0,03 | −29,94 | 6,31 | −25,48 | 0,5042 | −0,2553 | |||
| ABT / Abbott Laboratories | 0,05 | 0,00 | 6,12 | 2,53 | 0,4893 | −0,0464 | |||
| CAI / Caris Life Sciences, Inc. | 0,03 | 0,68 | 0,0545 | 0,0545 | |||||
| RDDT / Reddit, Inc. | 0,00 | −100,00 | 0,00 | −100,00 | −0,1360 | ||||
| INTUITIVE SURGICAL INC / DE (000000000) | −0,01 | −0,0005 | −0,0005 | ||||||
| ABBOTT LABORATORIES / DE (000000000) | −0,01 | −0,0005 | −0,0005 | ||||||
| COSTCO WHOLESALE CORP / DE (000000000) | −0,01 | −0,0007 | −0,0007 | ||||||
| COCA-COLA CO/THE / DE (000000000) | −0,01 | −0,0008 | −0,0008 | ||||||
| BURLINGTON STORES INC / DE (000000000) | −0,01 | −0,0010 | −0,0010 | ||||||
| WASTE CONNECTIONS INC / DE (000000000) | −0,01 | −0,0011 | −0,0011 | ||||||
| TRANE TECHNOLOGIES PLC / DE (000000000) | −0,01 | −0,0012 | −0,0012 | ||||||
| COPART INC / DE (000000000) | −0,02 | −0,0014 | −0,0014 | ||||||
| GARTNER INC / DE (000000000) | −0,02 | −0,0015 | −0,0015 | ||||||
| COSTAR GROUP INC / DE (000000000) | −0,02 | −0,0015 | −0,0015 | ||||||
| ELI LILLY + CO / DE (000000000) | −0,02 | −0,0019 | −0,0019 | ||||||
| BJ'S WHOLESALE CLUB HOLDINGS I / DE (000000000) | −0,03 | −0,0021 | −0,0021 | ||||||
| S+P GLOBAL INC / DE (000000000) | −0,03 | −0,0024 | −0,0024 | ||||||
| ARTHUR J GALLAGHER + CO / DE (000000000) | −0,03 | −0,0025 | −0,0025 | ||||||
| INTERCONTINENTAL EXCHANGE INC / DE (000000000) | −0,04 | −0,0029 | −0,0029 | ||||||
| AMETEK INC / DE (000000000) | −0,05 | −0,0037 | −0,0037 | ||||||
| MCKESSON CORP / DE (000000000) | −0,05 | −0,0038 | −0,0038 | ||||||
| BLUE OWL CAPITAL INC / DE (000000000) | −0,05 | −0,0044 | −0,0044 | ||||||
| EDWARDS LIFESCIENCES CORP / DE (000000000) | −0,05 | −0,0044 | −0,0044 | ||||||
| TESLA INC / DE (000000000) | −0,06 | −0,0050 | −0,0050 | ||||||
| HOME DEPOT INC/THE / DE (000000000) | −0,07 | −0,0055 | −0,0055 | ||||||
| AAON INC / DE (000000000) | −0,07 | −0,0056 | −0,0056 | ||||||
| ANALOG DEVICES INC / DE (000000000) | −0,07 | −0,0058 | −0,0058 | ||||||
| FAIR ISAAC CORP / DE (000000000) | −0,07 | −0,0058 | −0,0058 | ||||||
| VISA INC / DE (000000000) | −0,08 | −0,0061 | −0,0061 | ||||||
| NUTANIX INC / DE (000000000) | −0,08 | −0,0062 | −0,0062 | ||||||
| WALMART INC / DE (000000000) | −0,08 | −0,0064 | −0,0064 | ||||||
| HUMANA INC / DE (000000000) | −0,10 | −0,0081 | −0,0081 | ||||||
| TRANSUNION / DE (000000000) | −0,12 | −0,0096 | −0,0096 | ||||||
| TJX COS INC/THE / DE (000000000) | −0,12 | −0,0096 | −0,0096 | ||||||
| TRADEWEB MARKETS INC / DE (000000000) | −0,13 | −0,0105 | −0,0105 | ||||||
| FORTINET INC / DE (000000000) | −0,14 | −0,0109 | −0,0109 | ||||||
| ARISTA NETWORKS INC / DE (000000000) | −0,14 | −0,0110 | −0,0110 | ||||||
| ALPHABET INC / DE (000000000) | −0,17 | −0,0139 | −0,0139 | ||||||
| LAM RESEARCH CORP / DE (000000000) | −0,21 | −0,0165 | −0,0165 | ||||||
| HEICO CORP / DE (000000000) | −0,24 | −0,0192 | −0,0192 | ||||||
| INTUIT INC / DE (000000000) | −0,31 | −0,0250 | −0,0250 | ||||||
| SHIFT4 PAYMENTS INC / DE (000000000) | −0,38 | −0,0304 | −0,0304 | ||||||
| AMAZON.COM INC / DE (000000000) | −0,72 | −0,0579 | −0,0579 | ||||||
| META PLATFORMS INC / DE (000000000) | −0,89 | −0,0707 | −0,0707 | ||||||
| APPLE INC / DE (000000000) | −0,92 | −0,0733 | −0,0733 | ||||||
| MICROSOFT CORP / DE (000000000) | −0,96 | −0,0763 | −0,0763 | ||||||
| NETFLIX INC / DE (000000000) | −1,04 | −0,0831 | −0,0831 | ||||||
| BROADCOM INC / DE (000000000) | −1,77 | −0,1410 | −0,1410 | ||||||
| NVIDIA CORP / DE (000000000) | −2,08 | −0,1663 | −0,1663 |