Grundläggande statistik
| Portföljvärde | $ 550 661 222 |
| Aktuella positioner | 139 |
Senaste innehav, resultat, förvaltat kapital (från 13F, 13D)
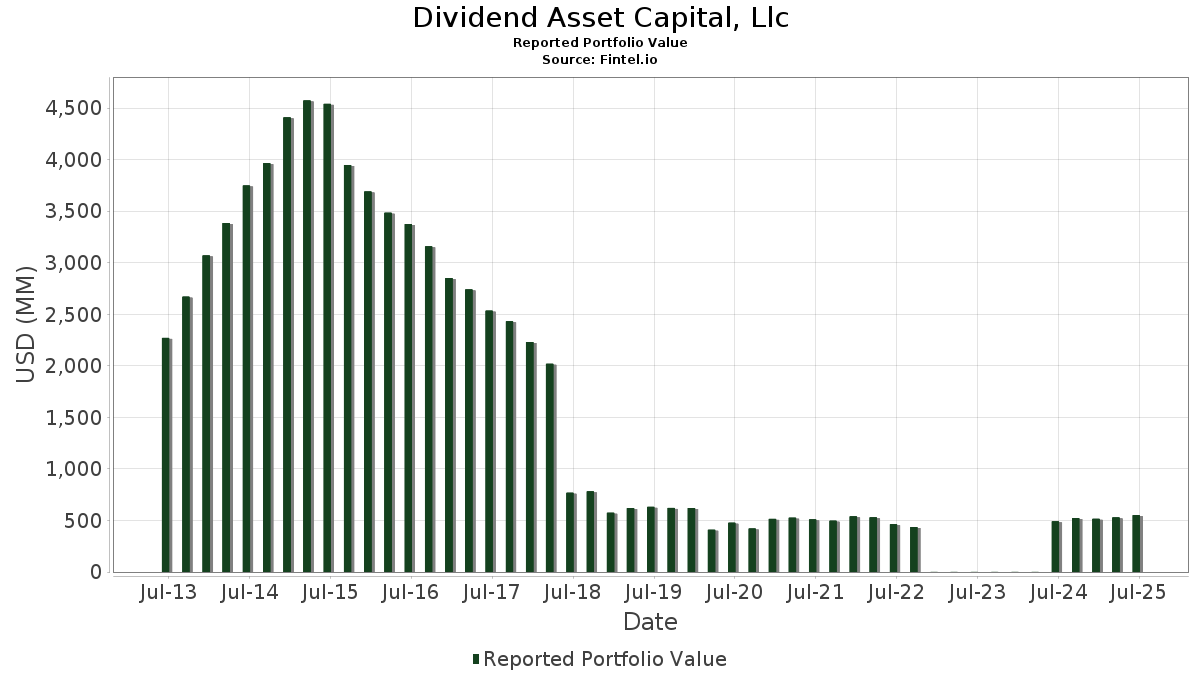
Dividend Asset Capital, Llc har redovisat 139 totala innehav i sina senaste SEC-arkiveringar. Det senaste portföljvärdet beräknas vara $ 550 661 222 USD. Faktiskt förvaltade tillgångar (AUM) är detta värde plus likvida medel (som inte redovisas). Dividend Asset Capital, Llcs största innehav är Microsoft Corporation (US:MSFT) , Costco Wholesale Corporation (US:COST) , Visa Inc. (US:V) , Novo Nordisk A/S - Depositary Receipt (Common Stock) (US:NVO) , and JPMorgan Chase & Co. (US:JPM) .
Största ökningarna detta kvartal
Vi använder förändringen i portföljallokeringen eftersom det är det mest meningsfulla måttet. Förändringar kan bero på transaktioner eller förändringar i aktiekurser.
| Värdepapper | Aktier (MM) |
Värde (MM$) |
Portfölj % av | ΔPortfölj % av |
|---|---|---|---|---|
| 0,07 | 36,87 | 6,6962 | 1,2356 | |
| 0,07 | 16,39 | 2,9758 | 1,0403 | |
| 0,03 | 7,52 | 1,3655 | 0,7039 | |
| 0,01 | 3,63 | 0,6599 | 0,6599 | |
| 0,04 | 11,00 | 1,9971 | 0,4561 | |
| 0,01 | 8,58 | 1,5574 | 0,4308 | |
| 0,06 | 16,69 | 3,0313 | 0,3646 | |
| 0,01 | 5,50 | 0,9992 | 0,2998 | |
| 0,06 | 12,90 | 2,3432 | 0,2293 | |
| 0,03 | 10,50 | 1,9073 | 0,2183 |
Största minskningarna detta kvartal
Vi använder förändringen i portföljallokeringen eftersom det är det mest meningsfulla måttet. Förändringar kan bero på transaktioner eller förändringar i aktiepriser.
| Värdepapper | Aktier (MM) |
Värde (MM$) |
Portfölj % av | ΔPortfölj % av |
|---|---|---|---|---|
| 0,20 | 16,00 | 2,9052 | −0,7539 | |
| 0,03 | 9,22 | 1,6748 | −0,7378 | |
| 0,02 | 11,28 | 2,0490 | −0,7229 | |
| 0,04 | 6,07 | 1,1027 | −0,5595 | |
| 0,39 | 12,12 | 2,2012 | −0,5589 | |
| 0,04 | 8,60 | 1,5618 | −0,2788 | |
| 0,26 | 18,11 | 3,2885 | −0,2100 | |
| 0,05 | 10,80 | 1,9605 | −0,1969 | |
| 0,04 | 3,53 | 0,6419 | −0,1604 | |
| 0,82 | 14,88 | 2,7022 | −0,1512 |
13F- och fond arkiveringar
Denna blankett lämnades in den 2025-08-14 för rapporteringsperioden 2025-06-30. Klicka på länksymbolen för att se hela transaktionshistoriken.
Uppgradera för att låsa upp premiumdata och exportera till Excel![]() .
.
| Värdepapper | Typ | Genomsnittligt aktiepris | Aktier (MM) |
ΔAktier (%) |
ΔAktier (%) |
Värde ($MM) |
Portfölj (%) |
ΔPortfölj (%) |
|
|---|---|---|---|---|---|---|---|---|---|
| MSFT / Microsoft Corporation | 0,07 | −3,55 | 36,87 | 27,81 | 6,6962 | 1,2356 | |||
| COST / Costco Wholesale Corporation | 0,03 | −1,31 | 27,50 | 3,30 | 4,9935 | −0,0447 | |||
| V / Visa Inc. | 0,05 | −1,24 | 18,27 | 0,05 | 3,3175 | −0,1383 | |||
| NVO / Novo Nordisk A/S - Depositary Receipt (Common Stock) | 0,26 | −1,44 | 18,11 | −2,03 | 3,2885 | −0,2100 | |||
| JPM / JPMorgan Chase & Co. | 0,06 | 0,24 | 16,69 | 18,48 | 3,0313 | 0,3646 | |||
| ORCL / Oracle Corporation | 0,07 | 2,47 | 16,39 | 60,24 | 2,9758 | 1,0403 | |||
| OKE / ONEOK, Inc. | 0,20 | 0,58 | 16,00 | −17,25 | 2,9052 | −0,7539 | |||
| ET / Energy Transfer LP - Limited Partnership | 0,82 | 1,21 | 14,88 | −1,29 | 2,7022 | −0,1512 | |||
| CNQ / Canadian Natural Resources Limited | 0,42 | 5,13 | 13,34 | 7,18 | 2,4217 | 0,0667 | |||
| TXN / Texas Instruments Incorporated | 0,06 | −0,01 | 12,90 | 15,54 | 2,3432 | 0,2293 | |||
| NEE / NextEra Energy, Inc. | 0,18 | 2,75 | 12,60 | 0,61 | 2,2886 | −0,0821 | |||
| AMGN / Amgen Inc. | 0,04 | 13,13 | 12,13 | 1,39 | 2,2028 | −0,0616 | |||
| EPD / Enterprise Products Partners L.P. - Limited Partnership | 0,39 | −8,49 | 12,12 | −16,88 | 2,2012 | −0,5589 | |||
| AMP / Ameriprise Financial, Inc. | 0,02 | −30,12 | 11,28 | −22,96 | 2,0490 | −0,7229 | |||
| LHX / L3Harris Technologies, Inc. | 0,04 | 12,71 | 11,00 | 35,07 | 1,9971 | 0,4561 | |||
| AIZ / Assurant, Inc. | 0,05 | 0,59 | 10,80 | −5,29 | 1,9605 | −0,1969 | |||
| HEI / HEICO Corporation | 0,03 | −4,13 | 10,50 | 17,70 | 1,9073 | 0,2183 | |||
| AMT / American Tower Corporation | 0,04 | −1,20 | 9,68 | 0,35 | 1,7573 | −0,0678 | |||
| LOW / Lowe's Companies, Inc. | 0,04 | 4,61 | 9,54 | −0,48 | 1,7330 | −0,0821 | |||
| ENB / Enbridge Inc. | 0,21 | 1,79 | 9,53 | 4,11 | 1,7310 | −0,0020 | |||
| SHW / The Sherwin-Williams Company | 0,03 | −0,91 | 9,39 | −2,56 | 1,7045 | −0,1188 | |||
| UNH / UnitedHealth Group Incorporated | 0,03 | 21,47 | 9,22 | −27,65 | 1,6748 | −0,7378 | |||
| UNP / Union Pacific Corporation | 0,04 | −9,19 | 8,60 | −11,56 | 1,5618 | −0,2788 | |||
| KLAC / KLA Corporation | 0,01 | 9,34 | 8,58 | 44,07 | 1,5574 | 0,4308 | |||
| INTU / Intuit Inc. | 0,01 | −5,05 | 7,92 | 21,80 | 1,4389 | 0,2077 | |||
| SAP / SAP SE - Depositary Receipt (Common Stock) | 0,03 | −8,83 | 7,66 | 3,29 | 1,3909 | −0,0126 | |||
| WSM / Williams-Sonoma, Inc. | 0,05 | 6,95 | 7,53 | 10,50 | 1,3669 | 0,0777 | |||
| AVGO / Broadcom Inc. | 0,03 | 30,67 | 7,52 | 115,14 | 1,3655 | 0,7039 | |||
| ZTS / Zoetis Inc. | 0,05 | 6,27 | 7,23 | 0,65 | 1,3139 | −0,0466 | |||
| WMB / The Williams Companies, Inc. | 0,11 | 4,31 | 7,11 | 9,64 | 1,2913 | 0,0638 | |||
| CTAS / Cintas Corporation | 0,03 | −1,19 | 6,73 | 7,15 | 1,2221 | 0,0334 | |||
| DOX / Amdocs Limited | 0,07 | −0,02 | 6,53 | −0,29 | 1,1853 | −0,0538 | |||
| NKE / NIKE, Inc. | 0,09 | −3,59 | 6,31 | 7,90 | 1,1461 | 0,0390 | |||
| QCOM / QUALCOMM Incorporated | 0,04 | −33,31 | 6,07 | −30,87 | 1,1027 | −0,5595 | |||
| ADP / Automatic Data Processing, Inc. | 0,02 | −0,84 | 6,02 | 0,10 | 1,0923 | −0,0451 | |||
| SYK / Stryker Corporation | 0,01 | −8,97 | 5,86 | −3,25 | 1,0639 | −0,0823 | |||
| FIX / Comfort Systems USA, Inc. | 0,01 | −10,49 | 5,50 | 48,90 | 0,9992 | 0,2998 | |||
| DPZ / Domino's Pizza, Inc. | 0,01 | 6,35 | 4,93 | 4,30 | 0,8949 | 0,0007 | |||
| AAPL / Apple Inc. | 0,02 | −0,03 | 4,60 | −7,66 | 0,8360 | −0,1076 | |||
| WDFC / WD-40 Company | 0,02 | 0,12 | 4,58 | −6,40 | 0,8318 | −0,0945 | |||
| TJX / The TJX Companies, Inc. | 0,04 | −0,65 | 4,57 | 0,73 | 0,8300 | −0,0288 | |||
| LMAT / LeMaitre Vascular, Inc. | 0,05 | 18,29 | 4,54 | 17,11 | 0,8244 | 0,0906 | |||
| WMT / Walmart Inc. | 0,04 | 0,19 | 4,30 | 11,59 | 0,7801 | 0,0515 | |||
| GS / The Goldman Sachs Group, Inc. | 0,01 | 3,63 | 0,6599 | 0,6599 | |||||
| ROP / Roper Technologies, Inc. | 0,01 | −2,46 | 3,59 | −6,22 | 0,6518 | −0,0726 | |||
| MPLX / MPLX LP - Limited Partnership | 0,07 | −4,10 | 3,56 | −7,72 | 0,6473 | −0,0837 | |||
| CHD / Church & Dwight Co., Inc. | 0,04 | −4,48 | 3,53 | −16,61 | 0,6419 | −0,1604 | |||
| CASY / Casey's General Stores, Inc. | 0,01 | −0,92 | 3,24 | 16,52 | 0,5891 | 0,0620 | |||
| HEIA / Heico Corp. - Class A | 0,01 | −2,49 | 3,03 | 19,59 | 0,5511 | 0,0708 | |||
| MCD / McDonald's Corporation | 0,01 | −3,03 | 2,95 | −9,33 | 0,5350 | −0,0798 | |||
| PAA / Plains All American Pipeline, L.P. - Limited Partnership | 0,14 | 9,51 | 2,62 | 0,31 | 0,4750 | −0,0185 | |||
| WES / Western Midstream Partners, LP - Limited Partnership | 0,06 | 0,05 | 2,50 | −5,48 | 0,4541 | −0,0466 | |||
| STE / STERIS plc | 0,01 | −0,39 | 2,48 | 5,58 | 0,4505 | 0,0058 | |||
| ECL / Ecolab Inc. | 0,01 | 0,33 | 2,47 | 6,61 | 0,4480 | 0,0101 | |||
| LMT / Lockheed Martin Corporation | 0,01 | −5,27 | 2,37 | −1,78 | 0,4312 | −0,0264 | |||
| XOM / Exxon Mobil Corporation | 0,02 | −0,27 | 2,33 | −9,58 | 0,4232 | −0,0647 | |||
| CB / Chubb Limited | 0,01 | −2,50 | 1,98 | −6,48 | 0,3590 | −0,0410 | |||
| RTX / RTX Corporation | 0,01 | −3,35 | 1,97 | 6,50 | 0,3570 | 0,0078 | |||
| JNJ / Johnson & Johnson | 0,01 | −0,02 | 1,92 | −7,95 | 0,3492 | −0,0460 | |||
| GOOGL / Alphabet Inc. | 0,01 | 3,93 | 1,87 | 18,45 | 0,3394 | 0,0407 | |||
| IBM / International Business Machines Corporation | 0,01 | 0,37 | 1,74 | 19,04 | 0,3167 | 0,0393 | |||
| TRGP / Targa Resources Corp. | 0,01 | 17,84 | 1,73 | 2,36 | 0,3149 | −0,0058 | |||
| CNI / Canadian National Railway Company | 0,01 | −4,80 | 1,47 | 1,67 | 0,2661 | −0,0068 | |||
| AMZN / Amazon.com, Inc. | 0,01 | 6,71 | 1,40 | 23,02 | 0,2535 | 0,0388 | |||
| SNA / Snap-on Incorporated | 0,00 | −3,96 | 1,39 | −11,38 | 0,2519 | −0,0442 | |||
| NVDA / NVIDIA Corporation | 0,01 | 0,00 | 1,32 | 45,86 | 0,2398 | 0,0684 | |||
| BALL / Ball Corporation | 0,02 | 0,00 | 1,32 | 7,76 | 0,2396 | 0,0078 | |||
| HESM / Hess Midstream LP | 0,03 | −2,79 | 1,29 | −11,43 | 0,2350 | −0,0417 | |||
| PG / The Procter & Gamble Company | 0,01 | −4,41 | 1,23 | −10,63 | 0,2229 | −0,0371 | |||
| SUN / Sunoco LP - Limited Partnership | 0,02 | −13,40 | 1,18 | −20,10 | 0,2139 | −0,0650 | |||
| TFC / Truist Financial Corporation | 0,03 | 0,00 | 1,18 | 4,44 | 0,2136 | 0,0005 | |||
| PPG / PPG Industries, Inc. | 0,01 | −0,50 | 1,14 | 3,53 | 0,2079 | −0,0015 | |||
| LLY / Eli Lilly and Company | 0,00 | 0,00 | 1,11 | −5,61 | 0,2016 | −0,0210 | |||
| ROST / Ross Stores, Inc. | 0,01 | −3,50 | 1,09 | −3,71 | 0,1981 | −0,0162 | |||
| CVX / Chevron Corporation | 0,01 | −7,63 | 1,08 | −20,92 | 0,1964 | −0,0625 | |||
| LNG / Cheniere Energy, Inc. | 0,00 | 72,52 | 1,07 | 81,77 | 0,1938 | 0,0825 | |||
| USAC / USA Compression Partners, LP - Limited Partnership | 0,04 | 2,52 | 1,04 | −7,63 | 0,1892 | −0,0243 | |||
| PEP / PepsiCo, Inc. | 0,01 | −4,36 | 1,02 | −15,74 | 0,1847 | −0,0439 | |||
| BA / The Boeing Company | 0,00 | −2,01 | 1,01 | 20,33 | 0,1839 | 0,0247 | |||
| MA / Mastercard Incorporated | 0,00 | 0,00 | 0,96 | 2,47 | 0,1738 | −0,0029 | |||
| ITW / Illinois Tool Works Inc. | 0,00 | −3,75 | 0,95 | −4,03 | 0,1730 | −0,0149 | |||
| EOG / EOG Resources, Inc. | 0,01 | −2,63 | 0,88 | −9,24 | 0,1607 | −0,0237 | |||
| ADI / Analog Devices, Inc. | 0,00 | 0,24 | 0,88 | 18,36 | 0,1604 | 0,0191 | |||
| CQP / Cheniere Energy Partners, L.P. - Limited Partnership | 0,02 | −4,35 | 0,86 | −18,83 | 0,1566 | −0,0445 | |||
| META / Meta Platforms, Inc. | 0,00 | 10,34 | 0,80 | 41,21 | 0,1444 | 0,0378 | |||
| KO / The Coca-Cola Company | 0,01 | 3,80 | 0,77 | 2,54 | 0,1392 | −0,0023 | |||
| AFL / Aflac Incorporated | 0,01 | 0,00 | 0,74 | −5,13 | 0,1344 | −0,0133 | |||
| BLK / BlackRock, Inc. | 0,00 | −2,11 | 0,73 | 8,48 | 0,1324 | 0,0052 | |||
| HD / The Home Depot, Inc. | 0,00 | 0,00 | 0,73 | 0,00 | 0,1321 | −0,0055 | |||
| TSLA / Tesla, Inc. | 0,00 | 4,00 | 0,70 | 27,64 | 0,1275 | 0,0233 | |||
| KNTK / Kinetik Holdings Inc. | 0,02 | 3,28 | 0,69 | −12,45 | 0,1253 | −0,0238 | |||
| LIN / Linde plc | 0,00 | 0,00 | 0,68 | 0,74 | 0,1236 | −0,0043 | |||
| BR / Broadridge Financial Solutions, Inc. | 0,00 | 0,00 | 0,62 | 0,16 | 0,1125 | −0,0045 | |||
| THG / The Hanover Insurance Group, Inc. | 0,00 | 0,33 | 0,61 | −1,92 | 0,1114 | −0,0071 | |||
| EQT / EQT Corporation | 0,01 | 0,00 | 0,61 | 9,17 | 0,1104 | 0,0050 | |||
| APO / Apollo Global Management, Inc. | 0,00 | −13,87 | 0,58 | −10,80 | 0,1051 | −0,0177 | |||
| FDS / FactSet Research Systems Inc. | 0,00 | 0,00 | 0,57 | −1,71 | 0,1044 | −0,0062 | |||
| MRK / Merck & Co., Inc. | 0,01 | 0,31 | 0,56 | −11,51 | 0,1020 | −0,0182 | |||
| BRK.B / Berkshire Hathaway Inc. | 0,00 | 14,93 | 0,56 | 4,86 | 0,1019 | 0,0006 | |||
| PEG / Public Service Enterprise Group Incorporated | 0,01 | 0,00 | 0,54 | 2,27 | 0,0981 | −0,0019 | |||
| HRL / Hormel Foods Corporation | 0,02 | −3,30 | 0,53 | −5,51 | 0,0967 | −0,0099 | |||
| PH / Parker-Hannifin Corporation | 0,00 | 0,00 | 0,52 | 14,82 | 0,0944 | 0,0088 | |||
| DHT / DHT Holdings, Inc. | 0,05 | −8,71 | 0,52 | −5,98 | 0,0943 | −0,0103 | |||
| CSCO / Cisco Systems, Inc. | 0,01 | 2,12 | 0,51 | 14,77 | 0,0933 | 0,0086 | |||
| VIG / Vanguard Specialized Funds - Vanguard Dividend Appreciation ETF | 0,00 | 15,12 | 0,51 | 21,48 | 0,0926 | 0,0131 | |||
| PM / Philip Morris International Inc. | 0,00 | 0,00 | 0,50 | 14,84 | 0,0914 | 0,0084 | |||
| SPGI / S&P Global Inc. | 0,00 | 0,21 | 0,50 | 3,97 | 0,0906 | −0,0002 | |||
| GOOG / Alphabet Inc. | 0,00 | 8,01 | 0,48 | 22,59 | 0,0877 | 0,0132 | |||
| SPY / SPDR S&P 500 ETF | 0,00 | −9,90 | 0,48 | −0,42 | 0,0869 | −0,0041 | |||
| WELL / Welltower Inc. | 0,00 | 0,00 | 0,46 | 0,44 | 0,0838 | −0,0032 | |||
| TFX / Teleflex Incorporated | 0,00 | 0,00 | 0,46 | −14,45 | 0,0830 | −0,0180 | |||
| MUB / iShares Trust - iShares National Muni Bond ETF | 0,00 | 2,25 | 0,46 | 1,34 | 0,0828 | −0,0024 | |||
| MDT / Medtronic plc | 0,01 | −15,70 | 0,45 | −18,20 | 0,0825 | −0,0227 | |||
| AM / Antero Midstream Corporation | 0,02 | −14,33 | 0,44 | −9,80 | 0,0803 | −0,0125 | |||
| GIS / General Mills, Inc. | 0,01 | 0,00 | 0,41 | −13,32 | 0,0745 | −0,0151 | |||
| AMLP / ALPS ETF Trust - Alerian MLP ETF | 0,01 | −11,71 | 0,41 | −17,01 | 0,0737 | −0,0188 | |||
| VV / Vanguard Index Funds - Vanguard Large-Cap ETF | 0,00 | 0,52 | 0,39 | 11,46 | 0,0708 | 0,0047 | |||
| VUG / Vanguard Index Funds - Vanguard Growth ETF | 0,00 | 2,09 | 0,38 | 20,75 | 0,0699 | 0,0095 | |||
| MMM / 3M Company | 0,00 | −8,21 | 0,37 | −4,86 | 0,0677 | −0,0065 | |||
| GEL / Genesis Energy, L.P. - Limited Partnership | 0,02 | −1,38 | 0,37 | 8,24 | 0,0670 | 0,0025 | |||
| ISRG / Intuitive Surgical, Inc. | 0,00 | 0,00 | 0,36 | 9,70 | 0,0659 | 0,0033 | |||
| HDB / HDFC Bank Limited - Depositary Receipt (Common Stock) | 0,00 | 0,00 | 0,36 | 15,58 | 0,0647 | 0,0063 | |||
| ELS / Equity LifeStyle Properties, Inc. | 0,01 | −2,36 | 0,33 | −9,81 | 0,0603 | −0,0093 | |||
| PSX / Phillips 66 | 0,00 | 0,00 | 0,32 | −3,30 | 0,0586 | −0,0046 | |||
| UPS / United Parcel Service, Inc. | 0,00 | 2,57 | 0,31 | −5,99 | 0,0572 | −0,0061 | |||
| ABBV / AbbVie Inc. | 0,00 | 0,00 | 0,30 | −11,37 | 0,0552 | −0,0097 | |||
| BDX / Becton, Dickinson and Company | 0,00 | −2,79 | 0,30 | −27,07 | 0,0544 | −0,0232 | |||
| CINF / Cincinnati Financial Corporation | 0,00 | 0,69 | 0,28 | 1,80 | 0,0514 | −0,0014 | |||
| WPC / W. P. Carey Inc. | 0,00 | 0,00 | 0,28 | −1,06 | 0,0510 | −0,0028 | |||
| WM / Waste Management, Inc. | 0,00 | −5,12 | 0,28 | −6,14 | 0,0500 | −0,0056 | |||
| D / Dominion Energy, Inc. | 0,00 | 0,00 | 0,27 | 0,74 | 0,0497 | −0,0017 | |||
| SXI / Standex International Corporation | 0,00 | 0,00 | 0,26 | −3,36 | 0,0472 | −0,0035 | |||
| COP / ConocoPhillips | 0,00 | 0,00 | 0,23 | −14,76 | 0,0421 | −0,0093 | |||
| GE / General Electric Company | 0,00 | −48,45 | 0,23 | −33,91 | 0,0419 | −0,0240 | |||
| DKL / Delek Logistics Partners, LP - Limited Partnership | 0,01 | 0,00 | 0,22 | −0,90 | 0,0401 | −0,0020 | |||
| MS / Morgan Stanley | 0,00 | 0,22 | 0,0392 | 0,0392 | |||||
| SCHB / Schwab Strategic Trust - Schwab U.S. Broad Market ETF | 0,01 | 0,21 | 0,0389 | 0,0389 | |||||
| GSY / Invesco Actively Managed Exchange-Traded Fund Trust - Invesco Ultra Short Duration ETF | 0,00 | 0,00 | 0,21 | 0,00 | 0,0385 | −0,0016 | |||
| WEC / WEC Energy Group, Inc. | 0,00 | −2,15 | 0,20 | −6,45 | 0,0370 | −0,0042 | |||
| MDY / SPDR S&P MidCap 400 ETF Trust | 0,00 | −100,00 | 0,00 | 0,0000 | |||||
| SHV / iShares Trust - iShares Short Treasury Bond ETF | 0,00 | −100,00 | 0,00 | 0,0000 | |||||
| TLT / iShares Trust - iShares 20+ Year Treasury Bond ETF | 0,00 | −100,00 | 0,00 | 0,0000 | |||||
| VTI / Vanguard Index Funds - Vanguard Total Stock Market ETF | 0,00 | −100,00 | 0,00 | 0,0000 | |||||
| JPST / J.P. Morgan Exchange-Traded Fund Trust - JPMorgan Ultra-Short Income ETF | 0,00 | −100,00 | 0,00 | 0,0000 | |||||
| MINT / PIMCO ETF Trust - PIMCO Enhanced Short Maturity Active Exchange-Traded Fund | 0,00 | −100,00 | 0,00 | 0,0000 |