Grundläggande statistik
| Portföljvärde | $ 36 281 433 |
| Aktuella positioner | 83 |
Senaste innehav, resultat, förvaltat kapital (från 13F, 13D)
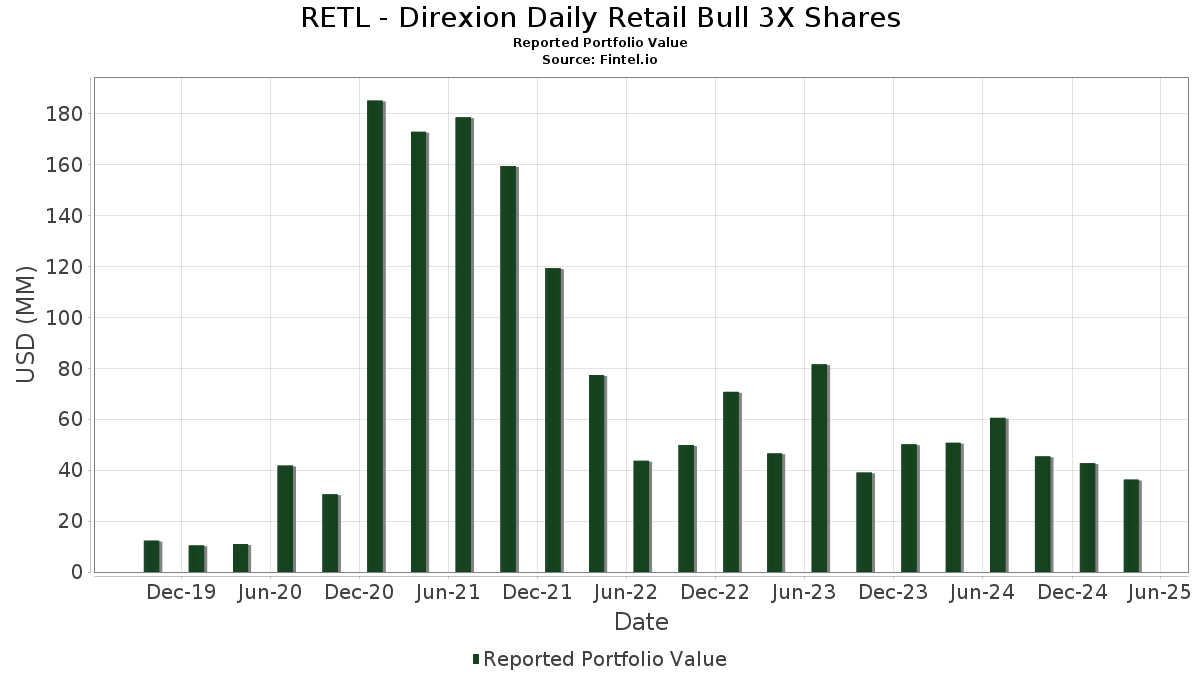
RETL - Direxion Daily Retail Bull 3X Shares har redovisat 83 totala innehav i sina senaste SEC-arkiveringar. Det senaste portföljvärdet beräknas vara $ 36 281 433 USD. Faktiskt förvaltade tillgångar (AUM) är detta värde plus likvida medel (som inte redovisas). RETL - Direxion Daily Retail Bull 3X Sharess största innehav är Grocery Outlet Holding Corp. (US:GO) , Carvana Co. (US:CVNA) , Dollar Tree, Inc. (US:DLTR) , GameStop Corp. (US:GME) , and Dollar General Corporation (US:DG) .
Största ökningarna detta kvartal
Vi använder förändringen i portföljallokeringen eftersom det är det mest meningsfulla måttet. Förändringar kan bero på transaktioner eller förändringar i aktiekurser.
| Värdepapper | Aktier (MM) |
Värde (MM$) |
Portfölj % av | ΔPortfölj % av |
|---|---|---|---|---|
| 11,04 | 32,0366 | 32,0366 | ||
| 3,66 | 10,6175 | 10,6175 | ||
| 1,94 | 5,6320 | 5,6320 | ||
| 1,20 | 3,4901 | 3,4901 | ||
| 0,01 | 0,36 | 1,0506 | 0,3716 | |
| 0,02 | 0,40 | 1,1749 | 0,3382 | |
| 0,00 | 0,40 | 1,1690 | 0,2076 | |
| 0,00 | 0,37 | 1,0740 | 0,2062 | |
| 0,02 | 0,32 | 0,9388 | 0,1888 | |
| 0,01 | 0,37 | 1,0869 | 0,1818 |
Största minskningarna detta kvartal
Vi använder förändringen i portföljallokeringen eftersom det är det mest meningsfulla måttet. Förändringar kan bero på transaktioner eller förändringar i aktiepriser.
| Värdepapper | Aktier (MM) |
Värde (MM$) |
Portfölj % av | ΔPortfölj % av |
|---|---|---|---|---|
| −1,53 | −4,4473 | −4,4473 | ||
| −1,32 | −3,8206 | −3,8206 | ||
| 0,01 | 0,24 | 0,6923 | −0,4556 | |
| 0,00 | 0,27 | 0,7694 | −0,3615 | |
| −0,12 | −0,3563 | −0,3563 | ||
| 0,01 | 0,15 | 0,4373 | −0,3028 | |
| 0,02 | 0,22 | 0,6297 | −0,3022 | |
| 0,01 | 0,26 | 0,7470 | −0,2912 | |
| 0,00 | 0,28 | 0,8105 | −0,2664 | |
| 0,01 | 0,30 | 0,8823 | −0,2475 |
13F- och fond arkiveringar
Denna blankett lämnades in den 2025-06-27 för rapporteringsperioden 2025-04-30. Klicka på länksymbolen för att se hela transaktionshistoriken.
Uppgradera för att låsa upp premiumdata och exportera till Excel![]() .
.
| Värdepapper | Typ | Genomsnittligt aktiepris | Aktier (MM) |
ΔAktier (%) |
ΔAktier (%) |
Värde ($MM) |
Portfölj (%) |
ΔPortfölj (%) |
|
|---|---|---|---|---|---|---|---|---|---|
| DREYFUS GOV'T CASH MGMT -INSTITUTIONAL CUSIP 262006208 DGCXX (#289) / STIV (N/A) | 11,04 | 32,0366 | 32,0366 | ||||||
| GOLDMAN FINL SQ TRSRY INST 506 / STIV (N/A) | 3,66 | 10,6175 | 10,6175 | ||||||
| GOLDMAN SACHS FIN GOV 465 INSTITUT / STIV (N/A) | 1,94 | 5,6320 | 5,6320 | ||||||
| S&P RETAIL SELECT INDUSTRY INDEX SWAP / DE (N/A) | 1,20 | 3,4901 | 3,4901 | ||||||
| GO / Grocery Outlet Holding Corp. | 0,02 | 13,31 | 0,40 | 17,44 | 1,1749 | 0,3382 | |||
| CVNA / Carvana Co. | 0,00 | 3,06 | 0,40 | 1,77 | 1,1690 | 0,2076 | |||
| DLTR / Dollar Tree, Inc. | 0,00 | −14,75 | 0,39 | −4,88 | 1,1332 | 0,1353 | |||
| GME / GameStop Corp. | 0,01 | −2,96 | 0,37 | 0,54 | 1,0869 | 0,1818 | |||
| DG / Dollar General Corporation | 0,00 | −21,44 | 0,37 | 3,36 | 1,0740 | 0,2062 | |||
| SFM / Sprouts Farmers Market, Inc. | 0,00 | −20,19 | 0,37 | −13,85 | 1,0673 | 0,0309 | |||
| SIG / Signet Jewelers Limited | 0,01 | 29,33 | 0,36 | 29,39 | 1,0506 | 0,3716 | |||
| PSMT / PriceSmart, Inc. | 0,00 | −14,42 | 0,36 | −4,52 | 1,0436 | 0,1288 | |||
| ULTA / Ulta Beauty, Inc. | 0,00 | −3,96 | 0,35 | −7,81 | 1,0302 | 0,0950 | |||
| CASY / Casey's General Stores, Inc. | 0,00 | −21,45 | 0,34 | −13,92 | 0,9884 | 0,0282 | |||
| WMT / Walmart Inc. | 0,00 | −17,89 | 0,34 | −18,60 | 0,9793 | −0,0282 | |||
| CHWY / Chewy, Inc. | 0,01 | −27,93 | 0,33 | −30,62 | 0,9673 | −0,2003 | |||
| TJX / The TJX Companies, Inc. | 0,00 | −19,02 | 0,33 | −16,50 | 0,9574 | −0,0021 | |||
| KR / The Kroger Co. | 0,00 | −30,47 | 0,33 | −18,61 | 0,9534 | −0,0262 | |||
| MUSA / Murphy USA Inc. | 0,00 | −11,17 | 0,33 | −11,92 | 0,9437 | 0,0469 | |||
| ROST / Ross Stores, Inc. | 0,00 | −10,47 | 0,32 | −17,35 | 0,9422 | −0,0118 | |||
| VSCO / Victoria's Secret & Co. | 0,02 | 102,59 | 0,32 | 4,87 | 0,9388 | 0,1888 | |||
| BJ / BJ's Wholesale Club Holdings, Inc. | 0,00 | −32,37 | 0,32 | −19,85 | 0,9283 | −0,0396 | |||
| ORLY / O'Reilly Automotive, Inc. | 0,00 | −28,80 | 0,32 | −22,25 | 0,9244 | −0,0694 | |||
| COST / Costco Wholesale Corporation | 0,00 | −21,04 | 0,32 | −19,75 | 0,9210 | −0,0408 | |||
| ACI / Albertsons Companies, Inc. | 0,01 | −35,59 | 0,31 | −29,48 | 0,9045 | −0,1676 | |||
| AN / AutoNation, Inc. | 0,00 | −22,06 | 0,31 | −28,07 | 0,9019 | −0,1466 | |||
| EBAY / eBay Inc. | 0,00 | −28,59 | 0,31 | −27,80 | 0,8975 | −0,1438 | |||
| BBWI / Bath & Body Works, Inc. | 0,01 | −3,56 | 0,31 | −21,88 | 0,8938 | −0,0624 | |||
| GAP / The Gap, Inc. | 0,01 | −11,65 | 0,31 | −19,63 | 0,8935 | −0,0368 | |||
| EYE / National Vision Holdings, Inc. | 0,02 | −26,40 | 0,31 | −20,31 | 0,8897 | −0,0441 | |||
| OLLI / Ollie's Bargain Outlet Holdings, Inc. | 0,00 | −18,36 | 0,31 | −22,34 | 0,8890 | −0,0687 | |||
| AZO / AutoZone, Inc. | 0,00 | −32,50 | 0,30 | −24,38 | 0,8847 | −0,0920 | |||
| FIVE / Five Below, Inc. | 0,00 | 9,56 | 0,30 | −11,37 | 0,8839 | 0,0495 | |||
| CART / Maplebear Inc. | 0,01 | −20,90 | 0,30 | −34,84 | 0,8823 | −0,2475 | |||
| BOOT / Boot Barn Holdings, Inc. | 0,00 | 5,10 | 0,30 | −31,75 | 0,8739 | −0,1988 | |||
| JWN / Nordstrom, Inc. | 0,01 | −30,12 | 0,29 | −30,33 | 0,8558 | −0,1716 | |||
| URBN / Urban Outfitters, Inc. | 0,01 | −28,32 | 0,29 | −31,79 | 0,8545 | −0,1930 | |||
| VVV / Valvoline Inc. | 0,01 | −15,47 | 0,29 | −22,13 | 0,8504 | −0,0616 | |||
| REAL / The RealReal, Inc. | 0,05 | 73,07 | 0,29 | 5,04 | 0,8492 | 0,1738 | |||
| PAG / Penske Automotive Group, Inc. | 0,00 | −23,54 | 0,29 | −28,08 | 0,8482 | −0,1396 | |||
| LAD / Lithia Motors, Inc. | 0,00 | −6,07 | 0,29 | −27,02 | 0,8414 | −0,1217 | |||
| WBA / Walgreens Boots Alliance, Inc. | 0,03 | −35,28 | 0,29 | −31,03 | 0,8403 | −0,1780 | |||
| ETSY / Etsy, Inc. | 0,01 | −3,31 | 0,29 | −23,59 | 0,8300 | −0,0772 | |||
| TSCO / Tractor Supply Company | 0,01 | −19,70 | 0,29 | −25,20 | 0,8291 | −0,0988 | |||
| DKS / DICK'S Sporting Goods, Inc. | 0,00 | −16,47 | 0,28 | −34,71 | 0,8262 | −0,2323 | |||
| BKE / The Buckle, Inc. | 0,01 | 7,68 | 0,28 | −21,33 | 0,8253 | −0,0533 | |||
| DDS / Dillard's, Inc. | 0,00 | −7,51 | 0,28 | −31,63 | 0,8182 | −0,1815 | |||
| SAH / Sonic Automotive, Inc. | 0,00 | −22,98 | 0,28 | −37,02 | 0,8105 | −0,2664 | |||
| GPI / Group 1 Automotive, Inc. | 0,00 | −27,01 | 0,28 | −35,35 | 0,8073 | −0,2396 | |||
| AMZN / Amazon.com, Inc. | 0,00 | −14,64 | 0,27 | −33,82 | 0,7961 | −0,2098 | |||
| BURL / Burlington Stores, Inc. | 0,00 | −10,54 | 0,27 | −29,09 | 0,7931 | −0,1430 | |||
| AEO / American Eagle Outfitters, Inc. | 0,03 | 13,55 | 0,27 | −25,96 | 0,7890 | −0,1023 | |||
| BBY / Best Buy Co., Inc. | 0,00 | −11,72 | 0,27 | −31,39 | 0,7878 | −0,1737 | |||
| ANF / Abercrombie & Fitch Co. | 0,00 | 32,08 | 0,27 | −23,21 | 0,7783 | −0,0698 | |||
| TGT / Target Corporation | 0,00 | −6,61 | 0,27 | −34,48 | 0,7737 | −0,2151 | |||
| WINA / Winmark Corporation | 0,00 | 0,68 | 0,27 | −6,99 | 0,7734 | 0,0777 | |||
| ABG / Asbury Automotive Group, Inc. | 0,00 | −22,56 | 0,27 | −43,01 | 0,7694 | −0,3615 | |||
| SBH / Sally Beauty Holdings, Inc. | 0,03 | 3,18 | 0,26 | −22,81 | 0,7690 | −0,0639 | |||
| KMX / CarMax, Inc. | 0,00 | −11,69 | 0,26 | −33,25 | 0,7646 | −0,1949 | |||
| AAP / Advance Auto Parts, Inc. | 0,01 | −10,75 | 0,26 | −39,81 | 0,7470 | −0,2912 | |||
| CAL / Caleres, Inc. | 0,02 | 9,09 | 0,26 | −9,57 | 0,7428 | 0,0574 | |||
| ASO / Academy Sports and Outdoors, Inc. | 0,01 | −10,53 | 0,25 | −35,42 | 0,7202 | −0,2150 | |||
| RVLV / Revolve Group, Inc. | 0,01 | 16,60 | 0,24 | −26,73 | 0,7107 | −0,0996 | |||
| M / Macy's, Inc. | 0,02 | −12,28 | 0,24 | −35,81 | 0,7037 | −0,2122 | |||
| UPBD / Upbound Group, Inc. | 0,01 | 1,95 | 0,24 | −30,95 | 0,7010 | −0,1474 | |||
| WRBY / Warby Parker Inc. | 0,01 | −15,29 | 0,24 | −49,58 | 0,6923 | −0,4556 | |||
| IMKTA / Ingles Markets, Incorporated | 0,00 | −31,69 | 0,24 | −36,46 | 0,6907 | −0,2176 | |||
| BBW / Build-A-Bear Workshop, Inc. | 0,01 | −9,97 | 0,23 | −24,92 | 0,6739 | −0,0779 | |||
| FL / Foot Locker, Inc. | 0,02 | 3,04 | 0,23 | −37,06 | 0,6727 | −0,2201 | |||
| KSS / Kohl's Corporation | 0,03 | 26,37 | 0,23 | −36,03 | 0,6677 | −0,2041 | |||
| MNRO / Monro, Inc. | 0,02 | 7,85 | 0,22 | −23,43 | 0,6358 | −0,0593 | |||
| CWH / Camping World Holdings, Inc. | 0,02 | 8,27 | 0,22 | −43,60 | 0,6297 | −0,3022 | |||
| SFIX / Stitch Fix, Inc. | 0,06 | 62,35 | 0,19 | 12,28 | 0,5598 | 0,1441 | |||
| ODP / The ODP Corporation | 0,01 | −2,09 | 0,19 | −40,94 | 0,5514 | −0,2273 | |||
| HZO / MarineMax, Inc. | 0,01 | −11,42 | 0,19 | −37,58 | 0,5417 | −0,1823 | |||
| WMK / Weis Markets, Inc. | 0,00 | −32,07 | 0,17 | −13,99 | 0,4848 | 0,0155 | |||
| GCO / Genesco Inc. | 0,01 | 116,49 | 0,16 | 0,61 | 0,4777 | 0,0812 | |||
| SCVL / Shoe Carnival, Inc. | 0,01 | −23,01 | 0,15 | −50,66 | 0,4373 | −0,3028 | |||
| CRMT / America's Car-Mart, Inc. | 0,00 | −19,94 | 0,12 | −22,01 | 0,3620 | −0,0265 | |||
| ARKO / Arko Corp. | 0,02 | 85,60 | 0,08 | 5,63 | 0,2200 | 0,0457 | |||
| S&P RETAIL SELECT INDUSTRY INDEX SWAP / DE (N/A) | −0,12 | −0,3563 | −0,3563 | ||||||
| S&P RETAIL SELECT INDUSTRY INDEX SWAP / DE (N/A) | −1,32 | −3,8206 | −3,8206 | ||||||
| S&P RETAIL SELECT INDUSTRY INDEX SWAP / DE (N/A) | −1,53 | −4,4473 | −4,4473 |