Grundläggande statistik
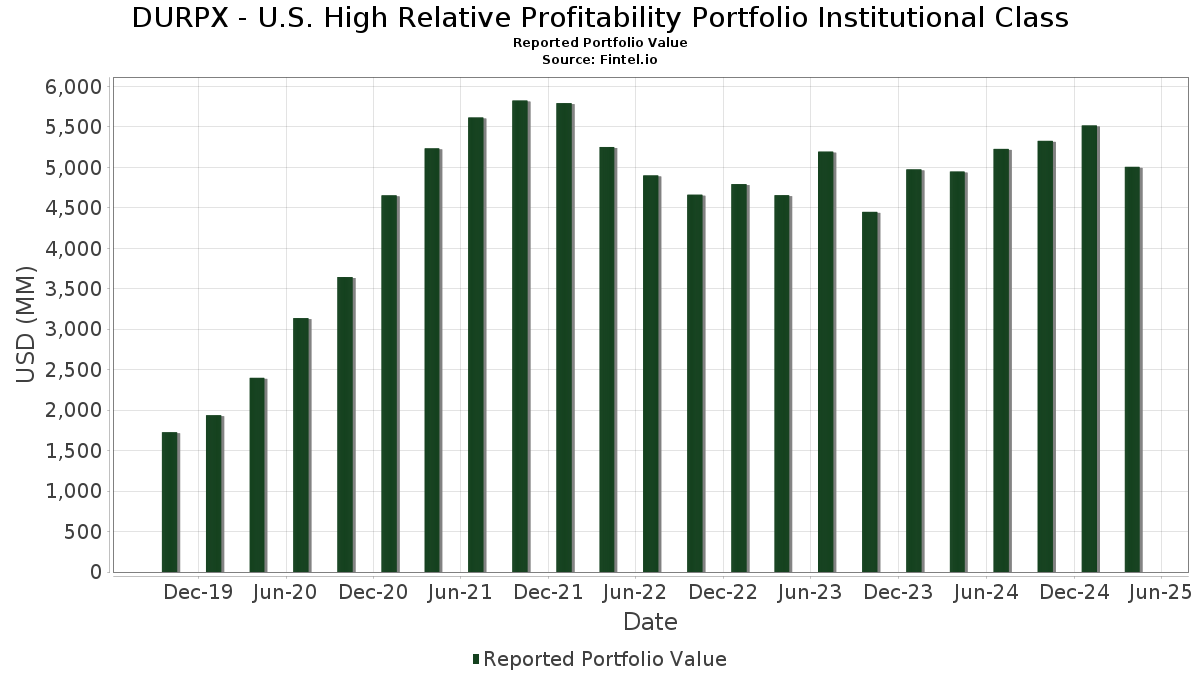
| Portföljvärde | $ 5 005 245 511 |
| Aktuella positioner | 149 |
Senaste innehav, resultat, förvaltat kapital (från 13F, 13D)
DURPX - U.S. High Relative Profitability Portfolio Institutional Class har redovisat 149 totala innehav i sina senaste SEC-arkiveringar. Det senaste portföljvärdet beräknas vara $ 5 005 245 511 USD. Faktiskt förvaltade tillgångar (AUM) är detta värde plus likvida medel (som inte redovisas). DURPX - U.S. High Relative Profitability Portfolio Institutional Classs största innehav är Apple Inc. (US:AAPL) , NVIDIA Corporation (US:NVDA) , Visa Inc. (US:V) , Eli Lilly and Company (US:LLY) , and Microsoft Corporation (US:MSFT) . DURPX - U.S. High Relative Profitability Portfolio Institutional Classs nya positioner inkluderar Willis Towers Watson Public Limited Company (US:WTW) , EMCOR Group, Inc. (US:EME) , Carlisle Companies Incorporated (US:CSL) , BJ's Wholesale Club Holdings, Inc. (US:BJ) , and Tapestry, Inc. (US:TPR) .
Största ökningarna detta kvartal
Vi använder förändringen i portföljallokeringen eftersom det är det mest meningsfulla måttet. Förändringar kan bero på transaktioner eller förändringar i aktiekurser.
| Värdepapper | Aktier (MM) |
Värde (MM$) |
Portfölj % av | ΔPortfölj % av |
|---|---|---|---|---|
| 0,67 | 104,57 | 2,1121 | 1,5173 | |
| 0,67 | 108,53 | 2,1922 | 1,3505 | |
| 45,68 | 45,68 | 0,9227 | 0,9227 | |
| 0,59 | 26,57 | 0,5366 | 0,5366 | |
| 1,51 | 321,10 | 6,4857 | 0,5275 | |
| 0,81 | 158,88 | 3,2090 | 0,4391 | |
| 0,71 | 246,86 | 4,9862 | 0,3943 | |
| 0,18 | 181,01 | 3,6560 | 0,3162 | |
| 0,04 | 15,08 | 0,3047 | 0,2208 | |
| 0,60 | 64,18 | 1,2964 | 0,2133 |
Största minskningarna detta kvartal
Vi använder förändringen i portföljallokeringen eftersom det är det mest meningsfulla måttet. Förändringar kan bero på transaktioner eller förändringar i aktiepriser.
| Värdepapper | Aktier (MM) |
Värde (MM$) |
Portfölj % av | ΔPortfölj % av |
|---|---|---|---|---|
| 0,04 | 17,78 | 0,3592 | −0,7067 | |
| 1,04 | 12,06 | 0,2435 | −0,3483 | |
| 0,05 | 9,39 | 0,1896 | −0,2862 | |
| 0,22 | 68,01 | 1,3736 | −0,2844 | |
| 0,57 | 23,89 | 0,4826 | −0,2315 | |
| 0,08 | 5,76 | 0,1163 | −0,2190 | |
| 0,15 | 55,63 | 1,1236 | −0,2059 | |
| 0,09 | 24,77 | 0,5004 | −0,2006 | |
| 0,11 | 59,51 | 1,2019 | −0,1963 | |
| 0,06 | 18,70 | 0,3777 | −0,1874 |
13F- och fond arkiveringar
Denna blankett lämnades in den 2025-06-26 för rapporteringsperioden 2025-04-30. Klicka på länksymbolen för att se hela transaktionshistoriken.
Uppgradera för att låsa upp premiumdata och exportera till Excel![]() .
.
| Värdepapper | Typ | Genomsnittligt aktiepris | Aktier (MM) |
ΔAktier (%) |
ΔAktier (%) |
Värde ($MM) |
Portfölj (%) |
ΔPortfölj (%) |
|
|---|---|---|---|---|---|---|---|---|---|
| AAPL / Apple Inc. | 1,51 | 10,71 | 321,10 | −0,32 | 6,4857 | 0,5275 | |||
| NVDA / NVIDIA Corporation | 2,48 | 0,00 | 270,17 | −9,29 | 5,4570 | −0,0518 | |||
| V / Visa Inc. | 0,71 | −1,63 | 246,86 | −0,56 | 4,9862 | 0,3943 | |||
| LLY / Eli Lilly and Company | 0,24 | −16,28 | 219,46 | −7,21 | 4,4328 | 0,0581 | |||
| MSFT / Microsoft Corporation | 0,49 | −3,01 | 193,52 | −7,63 | 3,9087 | 0,0334 | |||
| COST / Costco Wholesale Corporation | 0,18 | −1,23 | 181,01 | 0,25 | 3,6560 | 0,3162 | |||
| ABBV / AbbVie Inc. | 0,81 | 0,00 | 158,88 | 6,09 | 3,2090 | 0,4391 | |||
| MA / Mastercard Incorporated | 0,26 | −9,07 | 140,31 | −10,28 | 2,8340 | −0,0585 | |||
| HD / The Home Depot, Inc. | 0,37 | −1,52 | 133,01 | −13,83 | 2,6865 | −0,1685 | |||
| IBM / International Business Machines Corporation | 0,46 | −2,57 | 112,25 | −7,86 | 2,2673 | 0,0139 | |||
| PG / The Procter & Gamble Company | 0,67 | 143,53 | 108,53 | 138,51 | 2,1922 | 1,3505 | |||
| JNJ / Johnson & Johnson | 0,67 | 216,52 | 104,57 | 225,18 | 2,1121 | 1,5173 | |||
| PEP / PepsiCo, Inc. | 0,66 | 0,00 | 89,04 | −10,03 | 1,7985 | −0,0320 | |||
| ORCL / Oracle Corporation | 0,61 | 0,00 | 85,81 | −17,25 | 1,7333 | −0,1849 | |||
| AMGN / Amgen Inc. | 0,26 | 0,00 | 76,72 | 1,93 | 1,5496 | 0,1574 | |||
| CAT / Caterpillar Inc. | 0,22 | −8,88 | 68,01 | −24,13 | 1,3736 | −0,2844 | |||
| UNP / Union Pacific Corporation | 0,31 | −0,78 | 65,96 | −13,65 | 1,3322 | −0,0805 | |||
| GILD / Gilead Sciences, Inc. | 0,60 | 0,00 | 64,18 | 9,61 | 1,2964 | 0,2133 | |||
| TJX / The TJX Companies, Inc. | 0,47 | −12,32 | 60,97 | −9,59 | 1,2315 | −0,0158 | |||
| AXP / American Express Company | 0,22 | 0,00 | 59,66 | −16,08 | 1,2051 | −0,1099 | |||
| META / Meta Platforms, Inc. | 0,11 | −1,18 | 59,51 | −21,28 | 1,2019 | −0,1963 | |||
| HON / Honeywell International Inc. | 0,28 | −0,04 | 59,02 | −5,94 | 1,1922 | 0,0315 | |||
| ADBE / Adobe Inc. | 0,15 | −9,71 | 55,63 | −22,61 | 1,1236 | −0,2059 | |||
| LMT / Lockheed Martin Corporation | 0,11 | 0,00 | 53,52 | 3,20 | 1,0811 | 0,1218 | |||
| RCL / Royal Caribbean Cruises Ltd. | 0,24 | 0,00 | 51,82 | −19,39 | 1,0466 | −0,1423 | |||
| AMP / Ameriprise Financial, Inc. | 0,11 | 0,00 | 50,15 | −13,31 | 1,0129 | −0,0571 | |||
| GVMXX / State Street Institutional Investment Trust - State Street Institutional US Govt Money Market Fnd Premier Cls | 48,55 | 3,40 | 48,55 | 3,40 | 0,9807 | 0,1122 | |||
| ADP / Automatic Data Processing, Inc. | 0,16 | −16,00 | 47,22 | −16,67 | 0,9537 | −0,0943 | |||
| DFA Short Term Investment Fund / STIV (000000000) | 45,68 | 45,68 | 0,9227 | 0,9227 | |||||
| LNG / Cheniere Energy, Inc. | 0,20 | 0,00 | 45,53 | 3,34 | 0,9197 | 0,1047 | |||
| WM / Waste Management, Inc. | 0,19 | −11,22 | 44,46 | −5,93 | 0,8980 | 0,0238 | |||
| BMY / Bristol-Myers Squibb Company | 0,88 | −5,89 | 43,98 | −19,86 | 0,8883 | −0,1267 | |||
| ROST / Ross Stores, Inc. | 0,30 | −0,45 | 41,89 | −8,10 | 0,8462 | 0,0030 | |||
| KR / The Kroger Co. | 0,54 | −27,27 | 39,04 | −14,79 | 0,7885 | −0,0589 | |||
| TRGP / Targa Resources Corp. | 0,22 | 0,00 | 38,24 | −13,16 | 0,7725 | −0,0421 | |||
| PAYX / Paychex, Inc. | 0,25 | −11,03 | 36,27 | −11,36 | 0,7325 | −0,0243 | |||
| KLAC / KLA Corporation | 0,05 | −14,72 | 36,05 | −18,83 | 0,7281 | −0,0933 | |||
| VST / Vistra Corp. | 0,27 | 0,00 | 35,46 | −22,85 | 0,7161 | −0,1339 | |||
| LRCX / Lam Research Corporation | 0,48 | −14,60 | 34,10 | −24,48 | 0,6887 | −0,1464 | |||
| URI / United Rentals, Inc. | 0,05 | −9,20 | 32,39 | −24,37 | 0,6541 | −0,1379 | |||
| ITW / Illinois Tool Works Inc. | 0,13 | −0,75 | 32,24 | −8,12 | 0,6512 | 0,0022 | |||
| SHW / The Sherwin-Williams Company | 0,09 | −22,44 | 31,94 | −23,57 | 0,6450 | −0,1279 | |||
| GWW / W.W. Grainger, Inc. | 0,03 | 1,36 | 30,62 | −2,30 | 0,6184 | 0,0388 | |||
| ZTS / Zoetis Inc. | 0,19 | −5,69 | 29,24 | −13,69 | 0,5906 | −0,0360 | |||
| UPS / United Parcel Service, Inc. | 0,30 | 0,00 | 28,83 | −16,57 | 0,5823 | −0,0569 | |||
| SYY / Sysco Corporation | 0,40 | −1,08 | 28,78 | −3,14 | 0,5813 | 0,0317 | |||
| MCO / Moody's Corporation | 0,06 | −3,70 | 28,34 | −12,63 | 0,5724 | −0,0276 | |||
| KMB / Kimberly-Clark Corporation | 0,21 | −14,34 | 28,19 | −13,15 | 0,5693 | −0,0309 | |||
| ADSK / Autodesk, Inc. | 0,10 | 0,00 | 28,06 | −11,91 | 0,5667 | −0,0224 | |||
| IDXX / IDEXX Laboratories, Inc. | 0,06 | −10,62 | 26,92 | −8,37 | 0,5438 | 0,0003 | |||
| GM / General Motors Company | 0,59 | 26,57 | 0,5366 | 0,5366 | |||||
| VRT / Vertiv Holdings Co | 0,31 | −4,77 | 26,27 | −30,52 | 0,5306 | −0,1687 | |||
| FERG / Ferguson Enterprises Inc. | 0,15 | −7,73 | 26,17 | −13,57 | 0,5286 | −0,0315 | |||
| MSI / Motorola Solutions, Inc. | 0,06 | 0,00 | 24,82 | −6,15 | 0,5013 | 0,0122 | |||
| LULU / lululemon athletica inc. | 0,09 | 0,00 | 24,77 | −34,63 | 0,5004 | −0,2006 | |||
| IT / Gartner, Inc. | 0,06 | 0,00 | 24,53 | −22,43 | 0,4955 | −0,0894 | |||
| APP / AppLovin Corporation | 0,09 | 0,00 | 24,49 | −27,13 | 0,4947 | −0,1270 | |||
| CTAS / Cintas Corporation | 0,12 | −22,54 | 24,47 | −18,25 | 0,4943 | −0,0594 | |||
| DAL / Delta Air Lines, Inc. | 0,57 | 0,00 | 23,89 | −38,12 | 0,4826 | −0,2315 | |||
| TSCO / Tractor Supply Company | 0,46 | −7,55 | 23,27 | −13,92 | 0,4700 | −0,0300 | |||
| VRSK / Verisk Analytics, Inc. | 0,08 | −9,20 | 23,16 | −6,36 | 0,4677 | 0,0103 | |||
| HES / Hess Corporation | 0,17 | 0,00 | 22,41 | −7,18 | 0,4526 | 0,0061 | |||
| CMG / Chipotle Mexican Grill, Inc. | 0,44 | −0,29 | 22,36 | −13,67 | 0,4517 | −0,0275 | |||
| CL / Colgate-Palmolive Company | 0,24 | −5,86 | 22,34 | 0,10 | 0,4511 | 0,0384 | |||
| DRI / Darden Restaurants, Inc. | 0,11 | 0,00 | 21,79 | 2,76 | 0,4400 | 0,0479 | |||
| LPLA / LPL Financial Holdings Inc. | 0,07 | 0,00 | 21,30 | −12,84 | 0,4302 | −0,0218 | |||
| BR / Broadridge Financial Solutions, Inc. | 0,09 | −2,24 | 21,02 | −0,53 | 0,4247 | 0,0337 | |||
| CSX / CSX Corporation | 0,74 | 0,53 | 20,70 | −14,15 | 0,4180 | −0,0279 | |||
| TGT / Target Corporation | 0,21 | 0,00 | 20,20 | −29,88 | 0,4080 | −0,1248 | |||
| UAL / United Airlines Holdings, Inc. | 0,29 | 0,00 | 20,10 | −34,98 | 0,4060 | −0,1658 | |||
| COR / Cencora, Inc. | 0,06 | −46,84 | 18,70 | −38,80 | 0,3777 | −0,1874 | |||
| TRV / The Travelers Companies, Inc. | 0,07 | 0,00 | 18,27 | 7,73 | 0,3690 | 0,0553 | |||
| FLT / Corpay, Inc. | 0,06 | 0,00 | 18,08 | −14,49 | 0,3652 | −0,0259 | |||
| MMM / 3M Company | 0,13 | 78,73 | 18,07 | 63,13 | 0,3650 | 0,1601 | |||
| WSM / Williams-Sonoma, Inc. | 0,12 | −4,79 | 17,82 | −30,42 | 0,3600 | −0,1138 | |||
| DE / Deere & Company | 0,04 | −68,27 | 17,78 | −69,14 | 0,3592 | −0,7067 | |||
| ULTA / Ulta Beauty, Inc. | 0,04 | 0,00 | 17,14 | −4,01 | 0,3462 | 0,0159 | |||
| EXPE / Expedia Group, Inc. | 0,11 | 0,00 | 16,88 | −8,20 | 0,3408 | 0,0008 | |||
| CDW / CDW Corporation | 0,10 | 0,00 | 16,64 | −19,37 | 0,3362 | −0,0456 | |||
| DVN / Devon Energy Corporation | 0,52 | −3,25 | 15,67 | −13,72 | 0,3166 | −0,0194 | |||
| TT / Trane Technologies plc | 0,04 | 214,73 | 15,08 | 232,61 | 0,3047 | 0,2208 | |||
| AON / Aon plc | 0,04 | 186,24 | 14,67 | 173,90 | 0,2963 | 0,1972 | |||
| COP / ConocoPhillips | 0,16 | −29,44 | 14,07 | −36,37 | 0,2843 | −0,1248 | |||
| NKE / NIKE, Inc. | 0,24 | −18,07 | 13,59 | −39,92 | 0,2745 | −0,1439 | |||
| MPC / Marathon Petroleum Corporation | 0,10 | −25,30 | 13,50 | −29,55 | 0,2727 | −0,0818 | |||
| NTAP / NetApp, Inc. | 0,15 | −17,19 | 13,18 | −39,13 | 0,2662 | −0,1343 | |||
| BURL / Burlington Stores, Inc. | 0,06 | 0,00 | 12,94 | −20,74 | 0,2614 | −0,0406 | |||
| HSY / The Hershey Company | 0,08 | 0,00 | 12,77 | 12,02 | 0,2580 | 0,0471 | |||
| NRG / NRG Energy, Inc. | 0,11 | 0,00 | 12,43 | 6,97 | 0,2510 | 0,0361 | |||
| CHTR / Charter Communications, Inc. | 0,03 | 0,00 | 12,41 | 13,42 | 0,2507 | 0,0483 | |||
| BBY / Best Buy Co., Inc. | 0,18 | −7,64 | 12,23 | −28,26 | 0,2470 | −0,0683 | |||
| US23320U4058 / The DFA Investment Trust Company | 1,04 | −62,31 | 12,06 | −62,32 | 0,2435 | −0,3483 | |||
| VLO / Valero Energy Corporation | 0,10 | −2,39 | 11,76 | −14,80 | 0,2375 | −0,0178 | |||
| EQH / Equitable Holdings, Inc. | 0,22 | −8,77 | 11,12 | −17,11 | 0,2246 | −0,0235 | |||
| OMC / Omnicom Group Inc. | 0,14 | 0,00 | 10,88 | −12,25 | 0,2198 | −0,0096 | |||
| WAT / Waters Corporation | 0,03 | 0,00 | 10,36 | −16,31 | 0,2093 | −0,0197 | |||
| OXY / Occidental Petroleum Corporation | 0,26 | −12,60 | 10,13 | −26,17 | 0,2045 | −0,0491 | |||
| GDDY / GoDaddy Inc. | 0,05 | 0,00 | 9,80 | −11,44 | 0,1980 | −0,0067 | |||
| NXPI / NXP Semiconductors N.V. | 0,05 | −58,71 | 9,39 | −63,51 | 0,1896 | −0,2862 | |||
| FAST / Fastenal Company | 0,11 | −1,35 | 9,10 | 9,07 | 0,1838 | 0,0295 | |||
| MO / Altria Group, Inc. | 0,15 | −52,92 | 9,02 | −46,69 | 0,1821 | −0,1307 | |||
| FTNT / Fortinet, Inc. | 0,09 | 740,84 | 8,99 | 765,35 | 0,1816 | 0,1624 | |||
| BAH / Booz Allen Hamilton Holding Corporation | 0,07 | 0,00 | 8,94 | −6,97 | 0,1805 | 0,0028 | |||
| MMC / Marsh & McLennan Companies, Inc. | 0,04 | 0,00 | 8,77 | 3,96 | 0,1770 | 0,0211 | |||
| TPL / Texas Pacific Land Corporation | 0,01 | 52,34 | 8,25 | 51,36 | 0,1667 | 0,0658 | |||
| DKS / DICK'S Sporting Goods, Inc. | 0,04 | 0,00 | 8,15 | −21,80 | 0,1645 | −0,0281 | |||
| ROL / Rollins, Inc. | 0,14 | 0,00 | 7,76 | 15,41 | 0,1567 | 0,0324 | |||
| LVS / Las Vegas Sands Corp. | 0,21 | 0,40 | 7,56 | −19,67 | 0,1526 | −0,0214 | |||
| LII / Lennox International Inc. | 0,01 | 0,00 | 7,19 | −7,70 | 0,1452 | 0,0011 | |||
| EBAY / eBay Inc. | 0,09 | 36,65 | 6,40 | 38,05 | 0,1293 | 0,0435 | |||
| XOM / Exxon Mobil Corporation | 0,06 | 0,00 | 6,26 | −1,12 | 0,1264 | 0,0093 | |||
| JBL / Jabil Inc. | 0,04 | 0,00 | 6,22 | −9,77 | 0,1256 | −0,0019 | |||
| KO / The Coca-Cola Company | 0,08 | −72,21 | 5,76 | −68,25 | 0,1163 | −0,2190 | |||
| VLTO / Veralto Corporation | 0,05 | 9 932,00 | 4,81 | 9 331,37 | 0,0972 | 0,0962 | |||
| BLDR / Builders FirstSource, Inc. | 0,04 | 0,00 | 4,65 | −28,49 | 0,0938 | −0,0263 | |||
| MTD / Mettler-Toledo International Inc. | 0,00 | −17,08 | 4,41 | −34,95 | 0,0890 | −0,0363 | |||
| WTW / Willis Towers Watson Public Limited Company | 0,01 | 3,98 | 0,0803 | 0,0803 | |||||
| AVY / Avery Dennison Corporation | 0,02 | 0,00 | 3,96 | −7,86 | 0,0800 | 0,0005 | |||
| LYV / Live Nation Entertainment, Inc. | 0,03 | 52,13 | 3,91 | 39,30 | 0,0790 | 0,0271 | |||
| GEN / Gen Digital Inc. | 0,15 | 93,53 | 3,77 | 86,09 | 0,0762 | 0,0387 | |||
| DVA / DaVita Inc. | 0,02 | −17,34 | 3,49 | −33,59 | 0,0706 | −0,0267 | |||
| ODFL / Old Dominion Freight Line, Inc. | 0,02 | −29,62 | 3,42 | −41,88 | 0,0691 | −0,0397 | |||
| NVR / NVR, Inc. | 0,00 | 27,22 | 3,16 | 13,09 | 0,0639 | 0,0122 | |||
| ROK / Rockwell Automation, Inc. | 0,01 | 0,00 | 3,08 | −11,05 | 0,0621 | −0,0018 | |||
| Future / DE (000000000) | 3,07 | 0,0619 | 0,0619 | ||||||
| CLX / The Clorox Company | 0,02 | −45,76 | 2,97 | −51,36 | 0,0600 | −0,0530 | |||
| ALLE / Allegion plc | 0,02 | 0,00 | 2,56 | 4,88 | 0,0516 | 0,0065 | |||
| EME / EMCOR Group, Inc. | 0,01 | 2,44 | 0,0493 | 0,0493 | |||||
| EXPD / Expeditors International of Washington, Inc. | 0,02 | 2 594,80 | 2,22 | 2 512,94 | 0,0449 | 0,0433 | |||
| POOL / Pool Corporation | 0,01 | −51,89 | 2,16 | −59,04 | 0,0436 | −0,0539 | |||
| EOG / EOG Resources, Inc. | 0,02 | 0,00 | 2,08 | −12,29 | 0,0419 | −0,0018 | |||
| SCCO / Southern Copper Corporation | 0,02 | 0,73 | 1,97 | −1,60 | 0,0397 | 0,0028 | |||
| TXN / Texas Instruments Incorporated | 0,01 | 0,00 | 1,74 | −13,30 | 0,0352 | −0,0020 | |||
| CSL / Carlisle Companies Incorporated | 0,00 | 1,32 | 0,0267 | 0,0267 | |||||
| SOLV / Solventum Corporation | 0,02 | 0,00 | 1,17 | −10,72 | 0,0237 | −0,0006 | |||
| XPO / XPO, Inc. | 0,01 | −75,42 | 1,08 | −80,50 | 0,0219 | −0,0809 | |||
| MCHP / Microchip Technology Incorporated | 0,02 | −78,96 | 0,85 | −82,16 | 0,0172 | −0,0712 | |||
| BJ / BJ's Wholesale Club Holdings, Inc. | 0,01 | 0,85 | 0,0172 | 0,0172 | |||||
| MAS / Masco Corporation | 0,01 | 0,00 | 0,73 | −23,54 | 0,0148 | −0,0029 | |||
| LECO / Lincoln Electric Holdings, Inc. | 0,00 | 0,00 | 0,66 | −11,37 | 0,0132 | −0,0004 | |||
| WMG / Warner Music Group Corp. | 0,02 | 0,00 | 0,65 | −4,30 | 0,0130 | 0,0006 | |||
| TPR / Tapestry, Inc. | 0,01 | 0,60 | 0,0121 | 0,0121 | |||||
| CCK / Crown Holdings, Inc. | 0,01 | 0,00 | 0,56 | 9,63 | 0,0113 | 0,0019 | |||
| IQV / IQVIA Holdings Inc. | 0,00 | −78,21 | 0,24 | −83,22 | 0,0049 | −0,0218 | |||
| DXCM / DexCom, Inc. | 0,00 | −47,73 | 0,21 | −57,11 | 0,0043 | −0,0049 | |||
| SCI / Service Corporation International | 0,00 | 0,00 | 0,18 | 2,27 | 0,0037 | 0,0004 | |||
| AMAT / Applied Materials, Inc. | 0,00 | 0,00 | 0,07 | −16,67 | 0,0014 | −0,0001 | |||
| MTCH / Match Group, Inc. | 0,00 | 0,00 | 0,06 | −17,57 | 0,0012 | −0,0001 | |||
| LYB / LyondellBasell Industries N.V. | 0,00 | 0,00 | 0,06 | −23,38 | 0,0012 | −0,0002 | |||
| DECK / Deckers Outdoor Corporation | 0,00 | −100,00 | 0,00 | −100,00 | −0,1150 |