Grundläggande statistik
| Portföljvärde | $ 134 605 943 |
| Aktuella positioner | 128 |
Senaste innehav, resultat, förvaltat kapital (från 13F, 13D)
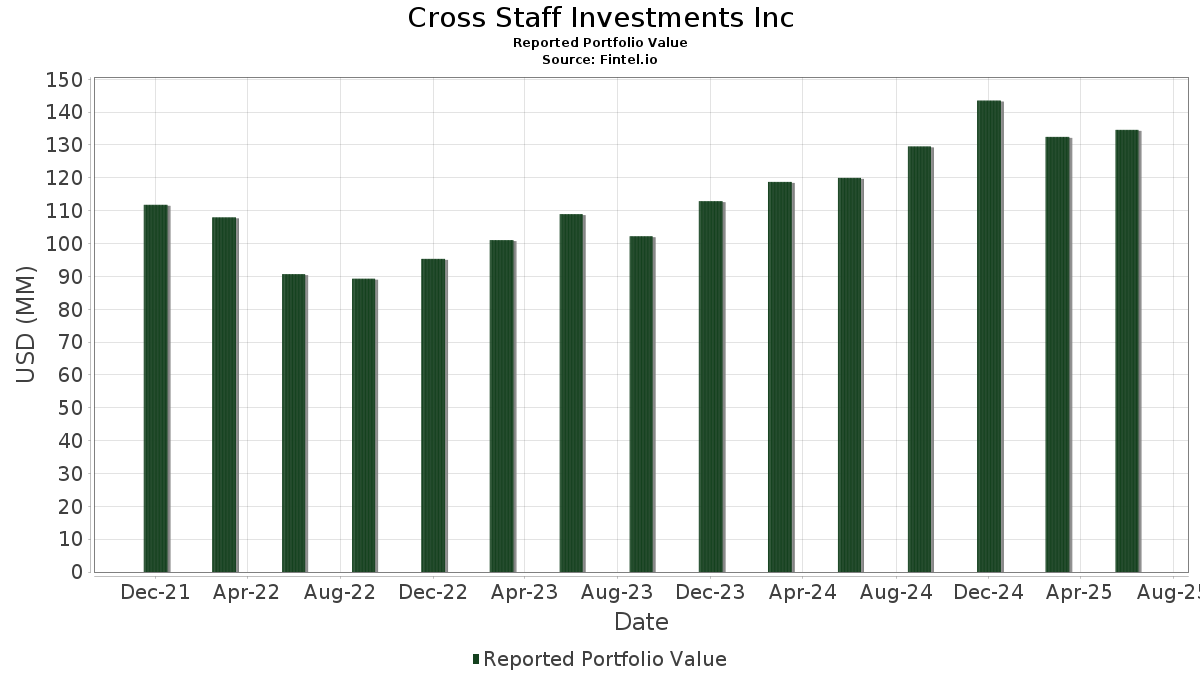
Cross Staff Investments Inc har redovisat 128 totala innehav i sina senaste SEC-arkiveringar. Det senaste portföljvärdet beräknas vara $ 134 605 943 USD. Faktiskt förvaltade tillgångar (AUM) är detta värde plus likvida medel (som inte redovisas). Cross Staff Investments Incs största innehav är Apple Inc. (US:AAPL) , Berkshire Hathaway Inc. (US:BRK.B) , Amazon.com, Inc. (US:AMZN) , Blackstone Inc. (US:BX) , and Microsoft Corporation (US:MSFT) . Cross Staff Investments Incs nya positioner inkluderar MercadoLibre, Inc. (US:MELI) , Palantir Technologies Inc. (US:PLTR) , IonQ, Inc. (US:IONQ) , ESAB Corporation (US:ESAB) , and CSX Corporation (US:CSX) .
Största ökningarna detta kvartal
Vi använder förändringen i portföljallokeringen eftersom det är det mest meningsfulla måttet. Förändringar kan bero på transaktioner eller förändringar i aktiekurser.
| Värdepapper | Aktier (MM) |
Värde (MM$) |
Portfölj % av | ΔPortfölj % av |
|---|---|---|---|---|
| 0,01 | 4,68 | 3,4798 | 0,7832 | |
| 0,03 | 5,89 | 4,3785 | 0,7484 | |
| 0,02 | 2,47 | 1,8322 | 0,6655 | |
| 0,01 | 2,76 | 2,0496 | 0,4466 | |
| 0,00 | 0,52 | 0,3883 | 0,3883 | |
| 0,18 | 0,98 | 0,7245 | 0,3308 | |
| 0,00 | 0,75 | 0,5539 | 0,3258 | |
| 0,00 | 0,41 | 0,3038 | 0,3038 | |
| 0,01 | 2,74 | 2,0379 | 0,2787 | |
| 0,00 | 1,04 | 0,7741 | 0,2590 |
Största minskningarna detta kvartal
Vi använder förändringen i portföljallokeringen eftersom det är det mest meningsfulla måttet. Förändringar kan bero på transaktioner eller förändringar i aktiepriser.
| Värdepapper | Aktier (MM) |
Värde (MM$) |
Portfölj % av | ΔPortfölj % av |
|---|---|---|---|---|
| 0,08 | 2,16 | 1,6033 | −4,7354 | |
| 0,55 | 2,09 | 1,5547 | −0,6021 | |
| 0,02 | 7,70 | 5,7193 | −0,5000 | |
| 0,05 | 9,49 | 7,0476 | −0,4187 | |
| 0,00 | 0,23 | 0,1725 | −0,1750 | |
| 0,01 | 1,33 | 0,9884 | −0,1385 | |
| 0,01 | 1,04 | 0,7738 | −0,1171 | |
| 0,01 | 1,08 | 0,7987 | −0,1169 | |
| 0,01 | 0,92 | 0,6847 | −0,1167 | |
| 0,01 | 0,76 | 0,5652 | −0,1140 |
13F- och fond arkiveringar
Denna blankett lämnades in den 2025-07-24 för rapporteringsperioden 2025-06-30. Klicka på länksymbolen för att se hela transaktionshistoriken.
Uppgradera för att låsa upp premiumdata och exportera till Excel![]() .
.
| Värdepapper | Typ | Genomsnittligt aktiepris | Aktier (MM) |
ΔAktier (%) |
ΔAktier (%) |
Värde ($MM) |
Portfölj (%) |
ΔPortfölj (%) |
|
|---|---|---|---|---|---|---|---|---|---|
| AAPL / Apple Inc. | 0,05 | 3,85 | 9,49 | −4,08 | 7,0476 | −0,4187 | |||
| BRK.B / Berkshire Hathaway Inc. | 0,02 | 2,45 | 7,70 | −6,55 | 5,7193 | −0,5000 | |||
| AMZN / Amazon.com, Inc. | 0,03 | 6,29 | 5,89 | 22,57 | 4,3785 | 0,7484 | |||
| BX / Blackstone Inc. | 0,04 | 0,45 | 5,70 | 7,51 | 4,2331 | 0,2315 | |||
| MSFT / Microsoft Corporation | 0,01 | −1,04 | 4,68 | 31,13 | 3,4798 | 0,7832 | |||
| LNG / Cheniere Energy, Inc. | 0,01 | 23,45 | 2,76 | 29,91 | 2,0496 | 0,4466 | |||
| CAT / Caterpillar Inc. | 0,01 | 0,00 | 2,74 | 17,73 | 2,0379 | 0,2787 | |||
| GOOGL / Alphabet Inc. | 0,01 | −1,32 | 2,62 | 12,47 | 1,9433 | 0,1874 | |||
| SCHB / Schwab Strategic Trust - Schwab U.S. Broad Market ETF | 0,11 | 1,01 | 2,56 | 11,83 | 1,9035 | 0,1735 | |||
| NVDA / NVIDIA Corporation | 0,02 | 9,47 | 2,47 | 59,61 | 1,8322 | 0,6655 | |||
| V / Visa Inc. | 0,01 | 6,62 | 2,42 | 8,05 | 1,7959 | 0,1066 | |||
| KKR / KKR & Co. Inc. | 0,02 | 1,45 | 2,32 | 16,74 | 1,7253 | 0,2236 | |||
| MOAT / VanEck ETF Trust - VanEck Morningstar Wide Moat ETF | 0,02 | 0,90 | 2,27 | 7,53 | 1,6876 | 0,0928 | |||
| CRK / Comstock Resources, Inc. | 0,08 | −81,11 | 2,16 | −74,30 | 1,6033 | −4,7354 | |||
| ATLX / Atlas Lithium Corporation | 0,55 | 0,18 | 2,09 | −26,78 | 1,5547 | −0,6021 | |||
| HD / The Home Depot, Inc. | 0,01 | −0,70 | 2,08 | −0,67 | 1,5425 | −0,0353 | |||
| GOOG / Alphabet Inc. | 0,01 | 0,00 | 2,03 | 13,54 | 1,5077 | 0,1584 | |||
| LLY / Eli Lilly and Company | 0,00 | 0,00 | 1,98 | −5,58 | 1,4710 | −0,1127 | |||
| SCHX / Schwab Strategic Trust - Schwab U.S. Large-Cap ETF | 0,08 | −0,44 | 1,91 | 10,20 | 1,4214 | 0,1107 | |||
| COST / Costco Wholesale Corporation | 0,00 | −2,62 | 1,84 | 1,94 | 1,3680 | 0,0043 | |||
| MA / Mastercard Incorporated | 0,00 | 3,77 | 1,75 | 6,33 | 1,2990 | 0,0579 | |||
| IBM / International Business Machines Corporation | 0,01 | −0,44 | 1,68 | 18,05 | 1,2494 | 0,1738 | |||
| DE / Deere & Company | 0,00 | 0,00 | 1,56 | 8,32 | 1,1616 | 0,0721 | |||
| JPM / JPMorgan Chase & Co. | 0,01 | 0,02 | 1,50 | 18,19 | 1,1153 | 0,1565 | |||
| AMT / American Tower Corporation | 0,01 | 4,54 | 1,41 | 6,17 | 1,0477 | 0,0450 | |||
| TDG / TransDigm Group Incorporated | 0,00 | −4,20 | 1,39 | 5,32 | 1,0303 | 0,0362 | |||
| BKNG / Booking Holdings Inc. | 0,00 | 0,00 | 1,38 | 25,64 | 1,0236 | 0,1959 | |||
| BRO / Brown & Brown, Inc. | 0,01 | 0,00 | 1,33 | −10,86 | 0,9884 | −0,1385 | |||
| VOO / Vanguard Index Funds - Vanguard S&P 500 ETF | 0,00 | 0,00 | 1,32 | 10,49 | 0,9790 | 0,0790 | |||
| VTI / Vanguard Index Funds - Vanguard Total Stock Market ETF | 0,00 | −0,46 | 1,31 | 10,08 | 0,9744 | 0,0749 | |||
| PG / The Procter & Gamble Company | 0,01 | 0,00 | 1,27 | −6,55 | 0,9442 | −0,0820 | |||
| NOC / Northrop Grumman Corporation | 0,00 | 0,00 | 1,12 | −2,35 | 0,8339 | −0,0338 | |||
| AZO / AutoZone, Inc. | 0,00 | 0,00 | 1,11 | −2,62 | 0,8274 | −0,0361 | |||
| DHR / Danaher Corporation | 0,01 | 0,04 | 1,09 | −3,63 | 0,8093 | −0,0439 | |||
| STZ / Constellation Brands, Inc. | 0,01 | 0,00 | 1,08 | −11,30 | 0,7987 | −0,1169 | |||
| GVIP / Goldman Sachs ETF Trust - Goldman Sachs Hedge Industry VIP ETF | 0,01 | 7,14 | 1,07 | 25,76 | 0,7942 | 0,1525 | |||
| JNJ / Johnson & Johnson | 0,01 | −0,36 | 1,05 | −8,24 | 0,7781 | −0,0834 | |||
| FICO / Fair Isaac Corporation | 0,00 | 54,05 | 1,04 | 52,64 | 0,7741 | 0,2590 | |||
| XOM / Exxon Mobil Corporation | 0,01 | −2,64 | 1,04 | −11,78 | 0,7738 | −0,1171 | |||
| PAYX / Paychex, Inc. | 0,01 | −3,59 | 0,98 | −9,12 | 0,7264 | −0,0856 | |||
| IBKR / Interactive Brokers Group, Inc. | 0,18 | 5 487,33 | 0,98 | 87,14 | 0,7245 | 0,3308 | |||
| YUM / Yum! Brands, Inc. | 0,01 | 0,00 | 0,97 | −5,81 | 0,7222 | −0,0571 | |||
| PM / Philip Morris International Inc. | 0,01 | 0,00 | 0,96 | 14,68 | 0,7144 | 0,0817 | |||
| PEP / PepsiCo, Inc. | 0,01 | −1,41 | 0,92 | −13,20 | 0,6847 | −0,1167 | |||
| TPL / Texas Pacific Land Corporation | 0,00 | 16,73 | 0,92 | −6,98 | 0,6841 | −0,0626 | |||
| CSCO / Cisco Systems, Inc. | 0,01 | −0,71 | 0,90 | 11,69 | 0,6675 | 0,0599 | |||
| ITW / Illinois Tool Works Inc. | 0,00 | 0,00 | 0,89 | −0,22 | 0,6605 | −0,0127 | |||
| VRSN / VeriSign, Inc. | 0,00 | 0,00 | 0,77 | 13,88 | 0,5729 | 0,0612 | |||
| NOW / ServiceNow, Inc. | 0,00 | 36,36 | 0,77 | 76,43 | 0,5728 | 0,2423 | |||
| CB / Chubb Limited | 0,00 | 0,00 | 0,77 | −4,01 | 0,5702 | −0,0337 | |||
| DUK / Duke Energy Corporation | 0,01 | −4,90 | 0,76 | −8,10 | 0,5653 | −0,0590 | |||
| CVX / Chevron Corporation | 0,01 | −1,21 | 0,76 | −15,46 | 0,5652 | −0,1140 | |||
| HON / Honeywell International Inc. | 0,00 | 0,00 | 0,75 | 9,88 | 0,5540 | 0,0421 | |||
| AVGO / Broadcom Inc. | 0,00 | 49,94 | 0,75 | 146,69 | 0,5539 | 0,3258 | |||
| BRK.A / Berkshire Hathaway Inc. | 0,00 | 0,00 | 0,73 | −8,77 | 0,5414 | −0,0613 | |||
| MKL / Markel Group Inc. | 0,00 | 0,00 | 0,72 | 6,84 | 0,5342 | 0,0261 | |||
| WMT / Walmart Inc. | 0,01 | 0,00 | 0,70 | 11,43 | 0,5220 | 0,0458 | |||
| NOBL / ProShares Trust - ProShares S&P 500 Dividend Aristocrats ETF | 0,01 | −5,71 | 0,69 | −7,14 | 0,5125 | −0,0479 | |||
| KO / The Coca-Cola Company | 0,01 | 0,00 | 0,68 | −1,30 | 0,5072 | −0,0145 | |||
| ED / Consolidated Edison, Inc. | 0,01 | −0,74 | 0,68 | −9,85 | 0,5031 | −0,0644 | |||
| AFL / Aflac Incorporated | 0,01 | 0,00 | 0,65 | −5,22 | 0,4858 | −0,0347 | |||
| DFUS / Dimensional ETF Trust - Dimensional U.S. Equity Market ETF | 0,01 | 0,00 | 0,64 | 10,71 | 0,4768 | 0,0396 | |||
| COF / Capital One Financial Corporation | 0,00 | 0,00 | 0,64 | 18,81 | 0,4742 | 0,0681 | |||
| XMPT / VanEck ETF Trust - VanEck CEF Muni Income ETF | 0,03 | 0,00 | 0,63 | −2,93 | 0,4678 | −0,0220 | |||
| MO / Altria Group, Inc. | 0,01 | −1,09 | 0,63 | −3,40 | 0,4649 | −0,0240 | |||
| XYL / Xylem Inc. | 0,00 | 0,00 | 0,62 | 8,20 | 0,4613 | 0,0284 | |||
| MMM / 3M Company | 0,00 | 0,00 | 0,62 | 3,68 | 0,4612 | 0,0091 | |||
| MRK / Merck & Co., Inc. | 0,01 | 0,00 | 0,59 | −11,90 | 0,4351 | −0,0662 | |||
| MCO / Moody's Corporation | 0,00 | 0,00 | 0,58 | 7,58 | 0,4330 | 0,0245 | |||
| NEAR / iShares U.S. ETF Trust - iShares Short Duration Bond Active ETF | 0,01 | −7,06 | 0,55 | −6,52 | 0,4050 | −0,0358 | |||
| ORLY / O'Reilly Automotive, Inc. | 0,01 | 1 400,00 | 0,54 | −5,76 | 0,4018 | −0,0308 | |||
| SO / The Southern Company | 0,01 | 0,00 | 0,54 | −0,19 | 0,3981 | −0,0070 | |||
| VPU / Vanguard World Fund - Vanguard Utilities ETF | 0,00 | 0,00 | 0,52 | 3,36 | 0,3889 | 0,0065 | |||
| MELI / MercadoLibre, Inc. | 0,00 | 0,52 | 0,3883 | 0,3883 | |||||
| SCHD / Schwab Strategic Trust - Schwab U.S. Dividend Equity ETF | 0,02 | 0,00 | 0,52 | −5,11 | 0,3863 | −0,0279 | |||
| LYV / Live Nation Entertainment, Inc. | 0,00 | 0,00 | 0,51 | 16,03 | 0,3821 | 0,0470 | |||
| ISRG / Intuitive Surgical, Inc. | 0,00 | 0,00 | 0,51 | 9,72 | 0,3779 | 0,0279 | |||
| TGT / Target Corporation | 0,00 | 0,00 | 0,46 | −5,34 | 0,3427 | −0,0257 | |||
| MDLZ / Mondelez International, Inc. | 0,01 | −1,29 | 0,45 | −1,94 | 0,3376 | −0,0120 | |||
| BN / Brookfield Corporation | 0,01 | 0,00 | 0,45 | 17,80 | 0,3350 | 0,0465 | |||
| META / Meta Platforms, Inc. | 0,00 | 49,14 | 0,45 | 91,45 | 0,3328 | 0,1558 | |||
| AMD / Advanced Micro Devices, Inc. | 0,00 | −31,91 | 0,45 | −5,89 | 0,3325 | −0,0268 | |||
| DFUV / Dimensional ETF Trust - Dimensional US Marketwide Value ETF | 0,01 | 0,00 | 0,44 | 2,57 | 0,3264 | 0,0031 | |||
| CL / Colgate-Palmolive Company | 0,00 | 0,00 | 0,44 | −2,90 | 0,3241 | −0,0154 | |||
| MIRA / MIRA Pharmaceuticals, Inc. | 0,36 | −1,10 | 0,43 | 21,91 | 0,3231 | 0,0542 | |||
| SRE / Sempra | 0,01 | 0,00 | 0,42 | 6,27 | 0,3152 | 0,0136 | |||
| DFAS / Dimensional ETF Trust - Dimensional U.S. Small Cap ETF | 0,01 | 0,00 | 0,41 | 6,70 | 0,3076 | 0,0145 | |||
| VZ / Verizon Communications Inc. | 0,01 | 2,45 | 0,41 | −2,39 | 0,3043 | −0,0121 | |||
| PLTR / Palantir Technologies Inc. | 0,00 | 0,41 | 0,3038 | 0,3038 | |||||
| MEAR / iShares U.S. ETF Trust - iShares Short Maturity Municipal Bond Active ETF | 0,01 | 0,00 | 0,40 | 0,25 | 0,2988 | −0,0046 | |||
| T / AT&T Inc. | 0,01 | 0,01 | 0,40 | 2,31 | 0,2966 | 0,0021 | |||
| VRSK / Verisk Analytics, Inc. | 0,00 | 0,00 | 0,39 | 4,61 | 0,2870 | 0,0084 | |||
| SPLV / Invesco Exchange-Traded Fund Trust II - Invesco S&P 500 Low Volatility ETF | 0,01 | 0,00 | 0,37 | −2,61 | 0,2777 | −0,0118 | |||
| LHX / L3Harris Technologies, Inc. | 0,00 | 0,00 | 0,36 | 20,07 | 0,2669 | 0,0406 | |||
| COP / ConocoPhillips | 0,00 | 0,00 | 0,36 | −14,63 | 0,2652 | −0,0502 | |||
| MAS / Masco Corporation | 0,01 | 0,00 | 0,33 | −7,48 | 0,2486 | −0,0243 | |||
| IR / Ingersoll Rand Inc. | 0,00 | 0,00 | 0,33 | 3,75 | 0,2472 | 0,0055 | |||
| HEI / HEICO Corporation | 0,00 | 0,00 | 0,33 | 22,85 | 0,2437 | 0,0420 | |||
| BMY / Bristol-Myers Squibb Company | 0,01 | −1,29 | 0,32 | −25,18 | 0,2369 | −0,0844 | |||
| O / Realty Income Corporation | 0,01 | 0,00 | 0,32 | −0,63 | 0,2359 | −0,0055 | |||
| PFE / Pfizer Inc. | 0,01 | 0,01 | 0,31 | −4,28 | 0,2329 | −0,0145 | |||
| NDAQ / Nasdaq, Inc. | 0,00 | 0,00 | 0,31 | 17,74 | 0,2325 | 0,0321 | |||
| ALL / The Allstate Corporation | 0,00 | 0,00 | 0,30 | −2,90 | 0,2243 | −0,0101 | |||
| TYL / Tyler Technologies, Inc. | 0,00 | 0,00 | 0,30 | 2,07 | 0,2202 | 0,0008 | |||
| YUMC / Yum China Holdings, Inc. | 0,01 | 0,00 | 0,29 | −14,08 | 0,2179 | −0,0399 | |||
| ETN / Eaton Corporation plc | 0,00 | 0,00 | 0,29 | 31,53 | 0,2175 | 0,0492 | |||
| VEEV / Veeva Systems Inc. | 0,00 | 0,00 | 0,29 | 24,24 | 0,2139 | 0,0391 | |||
| PSX / Phillips 66 | 0,00 | 0,00 | 0,28 | −3,44 | 0,2094 | −0,0108 | |||
| ECL / Ecolab Inc. | 0,00 | 0,00 | 0,27 | 6,32 | 0,2002 | 0,0088 | |||
| ROKU / Roku, Inc. | 0,00 | 0,00 | 0,26 | 24,64 | 0,1959 | 0,0364 | |||
| SPY / SPDR S&P 500 ETF | 0,00 | 0,26 | 0,1919 | 0,1919 | |||||
| SCHA / Schwab Strategic Trust - Schwab U.S. Small-Cap ETF | 0,01 | 0,01 | 0,25 | 8,30 | 0,1844 | 0,0109 | |||
| BR / Broadridge Financial Solutions, Inc. | 0,00 | 0,00 | 0,24 | 0,41 | 0,1805 | −0,0025 | |||
| ENB / Enbridge Inc. | 0,01 | 0,00 | 0,24 | 2,15 | 0,1772 | 0,0012 | |||
| TSM / Taiwan Semiconductor Manufacturing Company Limited - Depositary Receipt (Common Stock) | 0,00 | 0,24 | 0,1750 | 0,1750 | |||||
| RTX / RTX Corporation | 0,00 | 0,00 | 0,23 | 10,43 | 0,1735 | 0,0136 | |||
| GIS / General Mills, Inc. | 0,00 | −2,17 | 0,23 | −15,27 | 0,1732 | −0,0344 | |||
| ADBE / Adobe Inc. | 0,00 | −50,00 | 0,23 | −49,57 | 0,1725 | −0,1750 | |||
| CBZ / CBIZ, Inc. | 0,00 | 0,00 | 0,22 | −5,29 | 0,1598 | −0,0120 | |||
| IONQ / IonQ, Inc. | 0,01 | 0,21 | 0,1596 | 0,1596 | |||||
| XPRO / Expro Group Holdings N.V. | 0,00 | 0,00 | 0,21 | −21,97 | 0,1537 | −0,0463 | |||
| DVN / Devon Energy Corporation | 0,01 | 0,00 | 0,20 | −15,06 | 0,1512 | −0,0294 | |||
| SYK / Stryker Corporation | 0,00 | 0,20 | 0,1493 | 0,1493 | |||||
| ESAB / ESAB Corporation | 0,00 | 0,20 | 0,1492 | 0,1492 | |||||
| TMP / Tompkins Financial Corporation | 0,00 | 0,00 | 0,20 | 0,00 | 0,1487 | −0,0030 | |||
| CSX / CSX Corporation | 0,00 | 0,09 | 0,0655 | 0,0655 | |||||
| RVYL / Ryvyl Inc. | 0,02 | −7,84 | 0,02 | −23,08 | 0,0156 | −0,0044 | |||
| B0Y / American Rebel Holdings, Inc. | 0,01 | 0,02 | 0,0131 | 0,0131 | |||||
| VNOM / Viper Energy, Inc. | 0,00 | −100,00 | 0,00 | 0,0000 | |||||
| SHYD / VanEck ETF Trust - VanEck Short High Yield Muni ETF | 0,00 | −100,00 | 0,00 | 0,0000 | |||||
| ROP / Roper Technologies, Inc. | 0,00 | −100,00 | 0,00 | 0,0000 |