Grundläggande statistik
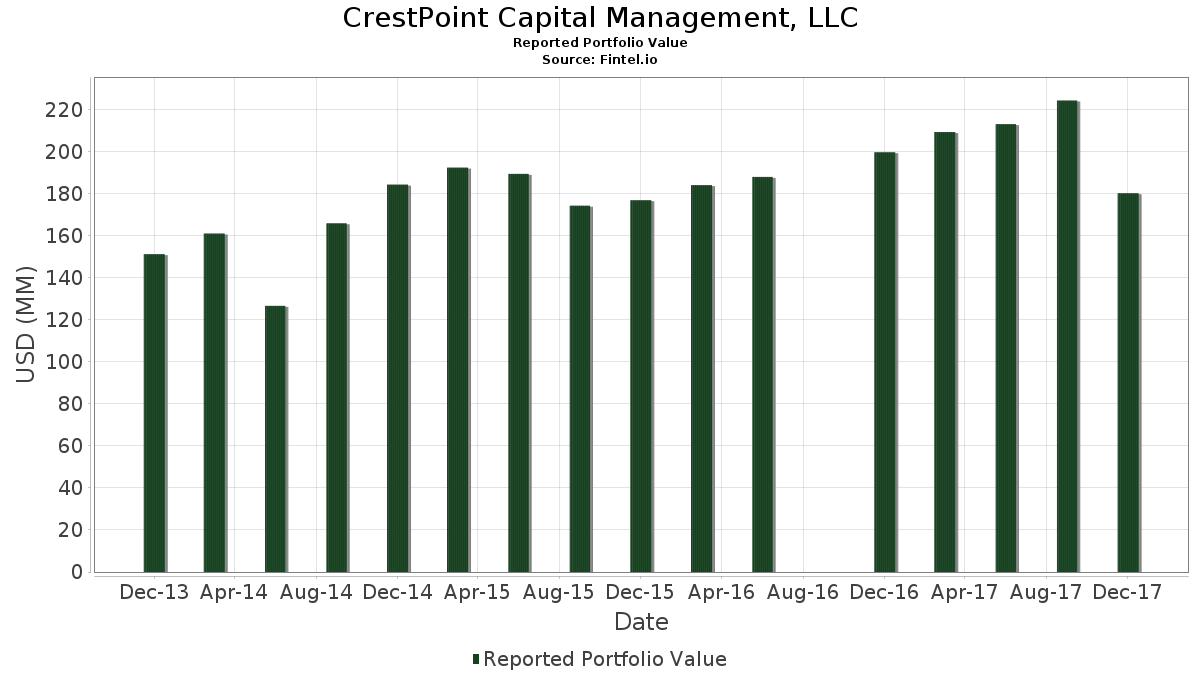
| Portföljvärde | $ 180 174 000 |
| Aktuella positioner | 184 |
Senaste innehav, resultat, förvaltat kapital (från 13F, 13D)
CrestPoint Capital Management, LLC har redovisat 184 totala innehav i sina senaste SEC-arkiveringar. Det senaste portföljvärdet beräknas vara $ 180 174 000 USD. Faktiskt förvaltade tillgångar (AUM) är detta värde plus likvida medel (som inte redovisas). CrestPoint Capital Management, LLCs största innehav är Exxon Mobil Corporation (US:XOM) , Microsoft Corporation (US:MSFT) , Abbott Laboratories (US:ABT) , Apple Inc. (US:AAPL) , and Meta Platforms, Inc. (US:META) . CrestPoint Capital Management, LLCs nya positioner inkluderar Tapestry, Inc. (US:TPR) , National Health Investors, Inc. (US:NHI) , Cimarex Energy Co. (US:XEC) , Teleflex Incorporated (US:TFX) , and Arthur J. Gallagher & Co. (US:AJG) .
Största ökningarna detta kvartal
Vi använder förändringen i portföljallokeringen eftersom det är det mest meningsfulla måttet. Förändringar kan bero på transaktioner eller förändringar i aktiekurser.
| Värdepapper | Aktier (MM) |
Värde (MM$) |
Portfölj % av | ΔPortfölj % av |
|---|---|---|---|---|
| 0,02 | 1,95 | 1,0817 | 1,0817 | |
| 0,04 | 1,65 | 0,9169 | 0,9169 | |
| 0,07 | 1,61 | 0,8952 | 0,8952 | |
| 0,03 | 1,60 | 0,8886 | 0,8886 | |
| 0,05 | 1,55 | 0,8608 | 0,8608 | |
| 0,02 | 1,51 | 0,8397 | 0,8397 | |
| 0,02 | 1,38 | 0,7648 | 0,7648 | |
| 0,04 | 1,38 | 0,7632 | 0,7632 | |
| 0,01 | 1,22 | 0,6771 | 0,6771 | |
| 0,02 | 1,20 | 0,6660 | 0,6660 |
Största minskningarna detta kvartal
Vi använder förändringen i portföljallokeringen eftersom det är det mest meningsfulla måttet. Förändringar kan bero på transaktioner eller förändringar i aktiepriser.
| Värdepapper | Aktier (MM) |
Värde (MM$) |
Portfölj % av | ΔPortfölj % av |
|---|---|---|---|---|
| 0,00 | 0,00 | −0,5930 | ||
| 0,02 | 0,45 | 0,2475 | −0,4931 | |
| 0,00 | 0,00 | −0,4860 | ||
| 0,00 | 0,42 | 0,2337 | −0,4517 | |
| 0,00 | 0,00 | −0,4508 | ||
| 0,01 | 0,95 | 0,5278 | −0,4241 | |
| 0,01 | 0,84 | 0,4651 | −0,4227 | |
| 0,00 | 0,00 | −0,4169 | ||
| 0,00 | 0,00 | −0,4053 | ||
| 0,00 | 0,00 | −0,4013 |
13F- och fond arkiveringar
Denna blankett lämnades in den 2018-01-17 för rapporteringsperioden 2017-12-31. Klicka på länksymbolen för att se hela transaktionshistoriken.
Uppgradera för att låsa upp premiumdata och exportera till Excel![]() .
.
| Värdepapper | Typ | Genomsnittligt aktiepris | Aktier (MM) |
ΔAktier (%) |
ΔAktier (%) |
Värde ($MM) |
Portfölj (%) |
ΔPortfölj (%) |
|
|---|---|---|---|---|---|---|---|---|---|
| XOM / Exxon Mobil Corporation | 0,08 | −10,93 | 7,02 | −9,12 | 3,8985 | 0,4522 | |||
| MSFT / Microsoft Corporation | 0,05 | −25,31 | 4,14 | −14,23 | 2,2978 | 0,1455 | |||
| ABT / Abbott Laboratories | 0,07 | −11,95 | 3,78 | −5,82 | 2,1002 | 0,3086 | |||
| AAPL / Apple Inc. | 0,02 | −25,17 | 3,72 | −17,83 | 2,0663 | 0,0460 | |||
| META / Meta Platforms, Inc. | 0,02 | −26,41 | 3,69 | −24,01 | 2,0469 | −0,1170 | |||
| MPC / Marathon Petroleum Corporation | 0,05 | −1,85 | 3,51 | 15,46 | 1,9481 | 0,5926 | |||
| JNJ / Johnson & Johnson | 0,02 | −25,67 | 3,12 | −20,10 | 1,7294 | −0,0095 | |||
| GOOGL / Alphabet Inc. | 0,00 | 0,00 | 2,84 | 8,18 | 1,5785 | 0,4062 | |||
| VTI / Vanguard Index Funds - Vanguard Total Stock Market ETF | 0,02 | 0,00 | 2,80 | 5,98 | 1,5541 | 0,3760 | |||
| V / Visa Inc. | 0,02 | −35,83 | 2,74 | −30,49 | 1,5185 | −0,2365 | |||
| INTC / Intel Corporation | 0,06 | −30,15 | 2,71 | −15,34 | 1,5013 | 0,0767 | |||
| MHK / Mohawk Industries, Inc. | 0,01 | −40,13 | 2,51 | −33,25 | 1,3937 | −0,2838 | |||
| AMG / Affiliated Managers Group, Inc. | 0,01 | 0,00 | 2,44 | 8,10 | 1,3554 | 0,3481 | |||
| SO / The Southern Company | 0,05 | 22,77 | 2,25 | 20,14 | 1,2516 | 0,4146 | |||
| APH / Amphenol Corporation | 0,03 | 0,00 | 2,24 | 3,75 | 1,2427 | 0,2805 | |||
| HD / The Home Depot, Inc. | 0,01 | 0,00 | 2,20 | 15,92 | 1,2205 | 0,3746 | |||
| ANTM / Anthem Inc | 0,01 | 0,00 | 2,16 | 18,49 | 1,1988 | 0,3860 | |||
| GPS / The Gap, Inc. | 0,06 | −0,16 | 2,13 | 15,12 | 1,1833 | 0,3575 | |||
| MCHP / Microchip Technology Incorporated | 0,02 | 0,00 | 2,13 | −2,12 | 1,1805 | 0,2116 | |||
| AMZN / Amazon.com, Inc. | 0,00 | 41,67 | 1,99 | 72,27 | 1,1034 | 0,5888 | |||
| FRT / Federal Realty Investment Trust | 0,01 | −25,76 | 1,95 | −20,62 | 1,0834 | −0,0130 | |||
| POST / Post Holdings, Inc. | 0,02 | 30,16 | 1,95 | 16,85 | 1,0817 | 1,0817 | |||
| NWSA / News Corporation | 0,12 | −32,65 | 1,87 | −17,65 | 1,0357 | 0,0253 | |||
| BMY / Bristol-Myers Squibb Company | 0,03 | 0,00 | 1,81 | −3,87 | 1,0068 | 0,1654 | |||
| T / AT&T Inc. | 0,05 | −29,91 | 1,78 | −30,42 | 0,9863 | −0,1525 | |||
| BRK.B / Berkshire Hathaway Inc. | 0,01 | −18,52 | 1,74 | −11,92 | 0,9680 | 0,0851 | |||
| TSN / Tyson Foods, Inc. | 0,02 | 0,00 | 1,71 | 15,14 | 0,9496 | 0,2870 | |||
| SWK / Stanley Black & Decker, Inc. | 0,01 | 0,00 | 1,66 | 12,36 | 0,9230 | 0,2631 | |||
| MBFI / MB Financial, Inc. | 0,04 | 0,00 | 1,65 | −1,08 | 0,9169 | 0,9169 | |||
| CRT / Cross Timbers Royalty Trust | 0,11 | 0,00 | 1,62 | 0,62 | 0,8975 | 0,1809 | |||
| JBLU / JetBlue Airways Corporation | 0,07 | 0,00 | 1,61 | 20,55 | 0,8952 | 0,8952 | |||
| US0549371070 / BB&T Corp. | 0,03 | 0,00 | 1,60 | 5,96 | 0,8886 | 0,8886 | |||
| US9487411038 / Weingarten Realty Investors | 0,05 | −0,84 | 1,55 | 2,65 | 0,8608 | 0,8608 | |||
| PEP / PepsiCo, Inc. | 0,01 | 12,39 | 1,52 | 20,97 | 0,8453 | 0,2839 | |||
| MDP / Meredith Holdings Corp | 0,02 | −0,43 | 1,51 | 18,57 | 0,8397 | 0,8397 | |||
| CSCO / Cisco Systems, Inc. | 0,04 | −32,41 | 1,50 | −23,07 | 0,8331 | −0,0368 | |||
| WMT / Walmart Inc. | 0,01 | −38,33 | 1,46 | −22,08 | 0,8109 | −0,0252 | |||
| AMGN / Amgen Inc. | 0,01 | 0,00 | 1,46 | −6,70 | 0,8109 | 0,1126 | |||
| SAIC / Science Applications International Corporation | 0,02 | 0,00 | 1,38 | 14,55 | 0,7648 | 0,7648 | |||
| CNK / Cinemark Holdings, Inc. | 0,04 | −0,50 | 1,38 | −4,38 | 0,7632 | 0,7632 | |||
| BWA / BorgWarner Inc. | 0,03 | 0,00 | 1,36 | −0,29 | 0,7543 | 0,1465 | |||
| RPM / RPM International Inc. | 0,03 | 0,00 | 1,33 | 2,08 | 0,7360 | 0,1567 | |||
| DOW / Dow Inc. | 0,02 | −46,28 | 1,31 | −44,74 | 0,7293 | −0,3310 | |||
| NKE / NIKE, Inc. | 0,02 | 0,00 | 1,26 | 20,73 | 0,7015 | 0,2347 | |||
| RTX / RTX Corporation | 0,01 | −45,20 | 1,24 | −39,81 | 0,6866 | −0,2297 | |||
| PSX / Phillips 66 | 0,01 | −30,29 | 1,23 | −23,02 | 0,6849 | −0,0299 | |||
| BKH / Black Hills Corporation | 0,02 | 0,00 | 1,22 | −12,73 | 0,6771 | 0,0538 | |||
| DNB / Dun & Bradstreet Holdings, Inc. | 0,01 | 186,11 | 1,22 | 191,17 | 0,6771 | 0,6771 | |||
| ZION / Zions Bancorporation, National Association | 0,02 | 0,00 | 1,20 | 7,82 | 0,6660 | 0,6660 | |||
| OC / Owens Corning | 0,01 | −22,16 | 1,20 | −7,51 | 0,6632 | 0,6632 | |||
| NNN / NNN REIT, Inc. | 0,03 | −1,08 | 1,19 | 2,42 | 0,6583 | 0,6583 | |||
| STT / State Street Corporation | 0,01 | −13,43 | 1,13 | −11,56 | 0,6283 | 0,0575 | |||
| SIGI / Selective Insurance Group, Inc. | 0,02 | 0,00 | 1,12 | 8,94 | 0,6222 | 0,6222 | |||
| SLB / Schlumberger Limited | 0,02 | 9,40 | 1,10 | 5,68 | 0,6094 | 0,1461 | |||
| FAST / Fastenal Company | 0,02 | −36,54 | 1,08 | −23,84 | 0,6011 | −0,0330 | |||
| BIIB / Biogen Inc. | 0,00 | 0,00 | 1,08 | 1,69 | 0,6011 | 0,1262 | |||
| LLY / Eli Lilly and Company | 0,01 | −17,42 | 1,08 | −18,48 | 0,6000 | 0,0087 | |||
| TPR / Tapestry, Inc. | 0,02 | 1,01 | 0,5595 | 0,5595 | |||||
| WFC / Wells Fargo & Company | 0,02 | −50,75 | 0,99 | −45,81 | 0,5522 | −0,2664 | |||
| NHI / National Health Investors, Inc. | 0,01 | 0,99 | 0,5478 | 0,5478 | |||||
| FNF / Fidelity National Financial, Inc. | 0,03 | 68,92 | 0,98 | 39,74 | 0,5445 | 0,5445 | |||
| CNC / Centene Corporation | 0,01 | −19,83 | 0,98 | −16,40 | 0,5434 | 0,5434 | |||
| KMT / Kennametal Inc. | 0,02 | 0,00 | 0,98 | 20,00 | 0,5428 | 0,5428 | |||
| HAL / Halliburton Company | 0,02 | −31,85 | 0,97 | −27,60 | 0,5400 | −0,0592 | |||
| FE / FirstEnergy Corp. | 0,03 | −44,64 | 0,96 | −44,98 | 0,5356 | −0,2465 | |||
| CTAS / Cintas Corporation | 0,01 | −58,78 | 0,95 | −55,46 | 0,5278 | −0,4241 | |||
| DLX / Deluxe Corporation | 0,01 | 0,00 | 0,94 | 5,35 | 0,5245 | 0,5245 | |||
| KEYS / Keysight Technologies, Inc. | 0,02 | 70,68 | 0,94 | 70,40 | 0,5239 | 0,2769 | |||
| CBT / Cabot Corporation | 0,02 | −0,65 | 0,94 | 9,66 | 0,5228 | 0,5228 | |||
| NDAQ / Nasdaq, Inc. | 0,01 | −8,27 | 0,94 | −9,21 | 0,5201 | 0,5201 | |||
| CMCSA / Comcast Corporation | 0,02 | 0,00 | 0,92 | 4,09 | 0,5090 | 0,1161 | |||
| US8865471085 / Tiffany & Co. | 0,01 | 0,00 | 0,92 | 13,24 | 0,5078 | 0,5078 | |||
| VEEV / Veeva Systems Inc. | 0,02 | 70,53 | 0,90 | 67,16 | 0,4973 | 0,4973 | |||
| ABBV / AbbVie Inc. | 0,01 | −1,08 | 0,89 | 7,75 | 0,4940 | 0,1257 | |||
| CDNS / Cadence Design Systems, Inc. | 0,02 | −49,04 | 0,89 | −45,98 | 0,4923 | −0,2398 | |||
| RTN / Raytheon Co. | 0,00 | 0,00 | 0,86 | 0,70 | 0,4795 | 0,0970 | |||
| LAD / Lithia Motors, Inc. | 0,01 | −13,79 | 0,85 | −18,62 | 0,4729 | 0,4729 | |||
| RYN / Rayonier Inc. | 0,03 | 0,85 | 0,4723 | 0,4723 | |||||
| MRK / Merck & Co., Inc. | 0,01 | −52,09 | 0,84 | −57,91 | 0,4651 | −0,4227 | |||
| CME / CME Group Inc. | 0,01 | 216,67 | 0,83 | 240,98 | 0,4618 | 0,4618 | |||
| JPM / JPMorgan Chase & Co. | 0,01 | −57,06 | 0,81 | −51,92 | 0,4512 | −0,3028 | |||
| FMC / FMC Corporation | 0,01 | −36,84 | 0,80 | −33,08 | 0,4412 | −0,0885 | |||
| SBNY / Signature Bank | 0,01 | 137,50 | 0,78 | 154,72 | 0,4340 | 0,2971 | |||
| PFE / Pfizer Inc. | 0,02 | 0,00 | 0,78 | 1,43 | 0,4340 | 0,0902 | |||
| ULTI / Ultimate Software Group, Inc. (The) | 0,00 | −46,97 | 0,76 | −38,93 | 0,4240 | 0,4240 | |||
| COST / Costco Wholesale Corporation | 0,00 | 0,00 | 0,73 | 13,26 | 0,4029 | 0,4029 | |||
| MET / MetLife, Inc. | 0,01 | −23,12 | 0,72 | −25,16 | 0,4013 | −0,0294 | |||
| LLL / JX Luxventure Limited | 0,00 | 12,50 | 0,71 | 18,08 | 0,3952 | 0,1263 | |||
| PCAR / PACCAR Inc | 0,01 | −53,30 | 0,70 | −54,11 | 0,3907 | −0,2933 | |||
| ROST / Ross Stores, Inc. | 0,01 | −19,44 | 0,70 | 0,14 | 0,3874 | 0,0766 | |||
| TTC / The Toro Company | 0,01 | 0,00 | 0,69 | 5,02 | 0,3835 | 0,0901 | |||
| EEFT / Euronet Worldwide, Inc. | 0,01 | 0,00 | 0,68 | −11,07 | 0,3791 | 0,0366 | |||
| BBWI / Bath & Body Works, Inc. | 0,01 | 0,00 | 0,67 | 44,59 | 0,3708 | 0,3708 | |||
| SNA / Snap-on Incorporated | 0,00 | −2,56 | 0,66 | 13,94 | 0,3674 | 0,1084 | |||
| PACW / Pacwest Bancorp | 0,01 | −10,88 | 0,66 | −11,05 | 0,3663 | 0,3663 | |||
| DIS / The Walt Disney Company | 0,01 | 0,00 | 0,66 | 9,15 | 0,3641 | 0,0961 | |||
| EFX / Equifax Inc. | 0,01 | 0,00 | 0,65 | 11,32 | 0,3602 | 0,3602 | |||
| LRCX / Lam Research Corporation | 0,00 | 0,00 | 0,64 | −0,62 | 0,3574 | 0,3574 | |||
| RDN / Radian Group Inc. | 0,03 | −21,61 | 0,64 | −13,58 | 0,3569 | 0,3569 | |||
| OI / O-I Glass, Inc. | 0,03 | 56,76 | 0,64 | 38,28 | 0,3569 | 0,3569 | |||
| GOOG / Alphabet Inc. | 0,00 | 0,00 | 0,63 | 9,20 | 0,3491 | 0,0923 | |||
| XEC / Cimarex Energy Co. | 0,01 | 0,61 | 0,3386 | 0,3386 | |||||
| ALK / Alaska Air Group, Inc. | 0,01 | 12,16 | 0,61 | 8,16 | 0,3386 | 0,3386 | |||
| PRU / Prudential Financial, Inc. | 0,01 | −30,26 | 0,61 | −24,63 | 0,3380 | −0,0223 | |||
| AET / Aetna, Inc. | 0,00 | 0,00 | 0,59 | 13,33 | 0,3302 | 0,0961 | |||
| NWL / Newell Brands Inc. | 0,02 | −24,80 | 0,59 | −45,57 | 0,3275 | 0,3275 | |||
| QCOM / QUALCOMM Incorporated | 0,01 | −23,53 | 0,58 | −5,51 | 0,3236 | 0,0485 | |||
| SSNC / SS&C Technologies Holdings, Inc. | 0,01 | 0,00 | 0,56 | 0,90 | 0,3125 | 0,0637 | |||
| US92220P1057 / Varian Medical Systems, Inc. | 0,00 | −28,99 | 0,55 | −21,01 | 0,3025 | 0,3025 | |||
| HON / Honeywell International Inc. | 0,00 | 6,06 | 0,54 | 14,74 | 0,2980 | 0,0894 | |||
| IP / International Paper Company | 0,01 | 0,00 | 0,53 | 1,91 | 0,2958 | 0,0626 | |||
| CELG / Celgene Corp. | 0,01 | 0,00 | 0,53 | −28,49 | 0,2953 | −0,0365 | |||
| KO / The Coca-Cola Company | 0,01 | −63,75 | 0,53 | −63,06 | 0,2953 | −0,3468 | |||
| BKNG / Booking Holdings Inc. | 0,00 | −57,14 | 0,52 | −59,36 | 0,2892 | −0,2825 | |||
| DE / Deere & Company | 0,00 | 0,00 | 0,52 | 24,64 | 0,2864 | 0,2864 | |||
| UNH / UnitedHealth Group Incorporated | 0,00 | 9,52 | 0,51 | 23,36 | 0,2814 | 0,0981 | |||
| HPE / Hewlett Packard Enterprise Company | 0,03 | −0,58 | 0,49 | −2,96 | 0,2725 | 0,2725 | |||
| NOC / Northrop Grumman Corporation | 0,00 | 0,00 | 0,49 | 6,74 | 0,2725 | 0,0674 | |||
| FAF / First American Financial Corporation | 0,01 | 1,16 | 0,49 | 13,49 | 0,2708 | 0,0791 | |||
| IAC / IAC Inc. | 0,00 | 0,00 | 0,48 | 3,92 | 0,2647 | 0,0601 | |||
| TJX / The TJX Companies, Inc. | 0,01 | −32,61 | 0,47 | −30,09 | 0,2631 | −0,0392 | |||
| LNT / Alliant Energy Corporation | 0,01 | 0,00 | 0,47 | 2,63 | 0,2603 | 0,0565 | |||
| AFG / American Financial Group, Inc. | 0,00 | −44,87 | 0,47 | −42,13 | 0,2592 | −0,1006 | |||
| EXC / Exelon Corporation | 0,01 | 0,00 | 0,47 | 4,49 | 0,2581 | 0,2581 | |||
| CAIAF / CA Immobilien Anlagen AG | 0,01 | 0,46 | 0,2570 | 0,2570 | |||||
| C.WSA / Citigroup, Inc. | 0,00 | 0,00 | 0,46 | 14,93 | 0,2564 | 0,0772 | |||
| AMT / American Tower Corporation | 0,00 | 0,00 | 0,46 | 4,58 | 0,2536 | 0,0588 | |||
| MDSO / Medidata Solutions, Inc. | 0,01 | −54,19 | 0,45 | −62,81 | 0,2498 | 0,2498 | |||
| FDX / FedEx Corporation | 0,00 | −41,94 | 0,45 | −35,77 | 0,2492 | −0,0625 | |||
| KMI / Kinder Morgan, Inc. | 0,02 | −71,48 | 0,45 | −73,15 | 0,2475 | −0,4931 | |||
| SBAC / SBA Communications Corporation | 0,00 | 0,00 | 0,44 | 13,37 | 0,2448 | 0,2448 | |||
| CTSH / Cognizant Technology Solutions Corporation | 0,01 | 0,00 | 0,44 | −2,22 | 0,2442 | 0,2442 | |||
| OKE / ONEOK, Inc. | 0,01 | −40,58 | 0,44 | −42,75 | 0,2431 | −0,0980 | |||
| TXRH / Texas Roadhouse, Inc. | 0,01 | 0,00 | 0,44 | 7,11 | 0,2425 | 0,2425 | |||
| CSX / CSX Corporation | 0,01 | 0,00 | 0,42 | 1,44 | 0,2353 | 0,0489 | |||
| TWX / Warner Media LLC | 0,00 | −69,33 | 0,42 | −72,61 | 0,2337 | −0,4517 | |||
| BA / The Boeing Company | 0,00 | 0,00 | 0,41 | 16,01 | 0,2292 | 0,0705 | |||
| ACM / AECOM | 0,01 | −2,73 | 0,40 | −1,73 | 0,2209 | 0,2209 | |||
| TFX / Teleflex Incorporated | 0,00 | 0,40 | 0,2209 | 0,2209 | |||||
| DHR / Danaher Corporation | 0,00 | 0,00 | 0,39 | 8,33 | 0,2165 | 0,0559 | |||
| SCU / Sculptor Capital Management Inc - Class A | 0,01 | 0,39 | 0,2165 | 0,2165 | |||||
| PG / The Procter & Gamble Company | 0,00 | −38,46 | 0,37 | −37,73 | 0,2042 | −0,0593 | |||
| BFAM / Bright Horizons Family Solutions Inc. | 0,00 | 0,00 | 0,37 | 9,23 | 0,2037 | 0,2037 | |||
| US69354M1080 / PRA Health Sciences Inc | 0,00 | 11,11 | 0,36 | 32,85 | 0,2020 | 0,2020 | |||
| KEX / Kirby Corporation | 0,01 | 1,89 | 0,36 | 3,14 | 0,2004 | 0,2004 | |||
| GGG / Graco Inc. | 0,01 | 200,00 | 0,35 | 9,63 | 0,1959 | 0,0523 | |||
| OSK / Oshkosh Corporation | 0,00 | −5,13 | 0,34 | 4,35 | 0,1865 | 0,0429 | |||
| MGM / MGM Resorts International | 0,01 | 0,00 | 0,33 | 2,51 | 0,1815 | 0,0393 | |||
| NSC / Norfolk Southern Corporation | 0,00 | −69,44 | 0,32 | −66,49 | 0,1771 | −0,2474 | |||
| TMUS / T-Mobile US, Inc. | 0,01 | 0,00 | 0,32 | 3,25 | 0,1765 | 0,1765 | |||
| NFG / National Fuel Gas Company | 0,01 | 0,00 | 0,31 | −3,10 | 0,1737 | 0,1737 | |||
| DLB / Dolby Laboratories, Inc. | 0,00 | 0,00 | 0,30 | 7,80 | 0,1687 | 0,1687 | |||
| WEX / WEX Inc. | 0,00 | 0,00 | 0,30 | 25,85 | 0,1648 | 0,1648 | |||
| KR / The Kroger Co. | 0,01 | 0,00 | 0,29 | 36,62 | 0,1615 | 0,0665 | |||
| BAX / Baxter International Inc. | 0,00 | −48,86 | 0,29 | −47,28 | 0,1615 | −0,0846 | |||
| HBI / Hanesbrands Inc. | 0,01 | −14,38 | 0,29 | −27,41 | 0,1587 | 0,1587 | |||
| GD / General Dynamics Corporation | 0,00 | −17,65 | 0,28 | −18,34 | 0,1582 | 0,0026 | |||
| UNP / Union Pacific Corporation | 0,00 | 0,00 | 0,27 | 15,52 | 0,1487 | 0,0453 | |||
| HII / Huntington Ingalls Industries, Inc. | 0,00 | 0,00 | 0,26 | 4,02 | 0,1437 | 0,0327 | |||
| MMM / 3M Company | 0,00 | 0,00 | 0,26 | 12,12 | 0,1437 | 0,0408 | |||
| GE / General Electric Company | 0,01 | 0,00 | 0,26 | −27,61 | 0,1426 | −0,0157 | |||
| AWK / American Water Works Company, Inc. | 0,00 | 0,00 | 0,26 | 12,78 | 0,1421 | 0,0409 | |||
| WBA / Walgreens Boots Alliance, Inc. | 0,00 | −57,83 | 0,25 | −60,37 | 0,1410 | −0,1448 | |||
| RS / Reliance, Inc. | 0,00 | −9,38 | 0,25 | 2,05 | 0,1382 | 0,1382 | |||
| IPG / The Interpublic Group of Companies, Inc. | 0,01 | 0,00 | 0,25 | −3,12 | 0,1376 | 0,0235 | |||
| AJG / Arthur J. Gallagher & Co. | 0,00 | 0,25 | 0,1371 | 0,1371 | |||||
| ACC / American Campus Communities Inc. | 0,01 | 0,25 | 0,1365 | 0,1365 | |||||
| FRC / First Republic Bank | 0,00 | 0,00 | 0,24 | −16,78 | 0,1349 | 0,1349 | |||
| US21871D1037 / Corelogic Inc | 0,01 | 0,00 | 0,23 | 0,00 | 0,1282 | 0,0252 | |||
| UPS / United Parcel Service, Inc. | 0,00 | −61,22 | 0,23 | −61,56 | 0,1254 | −0,1367 | |||
| EVR / Evercore Inc. | 0,00 | −7,41 | 0,23 | 3,69 | 0,1249 | 0,1249 | |||
| USFD / US Foods Holding Corp. | 0,01 | 0,22 | 0,1243 | 0,1243 | |||||
| MDLZ / Mondelez International, Inc. | 0,01 | 0,00 | 0,22 | 5,69 | 0,1238 | 0,0297 | |||
| RE / Everest Re Group Ltd | 0,00 | 0,00 | 0,22 | −3,07 | 0,1227 | 0,1227 | |||
| ABC / Amerisource Bergen Corp. | 0,00 | −11,11 | 0,22 | −1,35 | 0,1221 | 0,0227 | |||
| THS / TreeHouse Foods, Inc. | 0,00 | −16,98 | 0,22 | −39,28 | 0,1210 | 0,1210 | |||
| ANET / Arista Networks Inc | 0,00 | 0,21 | 0,1177 | 0,1177 | |||||
| US3024451011 / FLIR Systems, Inc. | 0,00 | 0,21 | 0,1166 | 0,1166 | |||||
| PVH / PVH Corp. | 0,00 | −77,27 | 0,21 | −75,24 | 0,1143 | −0,2566 | |||
| EL / The Estée Lauder Companies Inc. | 0,00 | 0,20 | 0,1132 | 0,1132 | |||||
| EMN / Eastman Chemical Company | 0,00 | 0,20 | 0,1132 | 0,1132 | |||||
| SRCL / Stericycle, Inc. | 0,00 | 0,00 | 0,20 | −5,12 | 0,1132 | 0,1132 | |||
| COL / Rockwell Collins, Inc. | 0,00 | 0,20 | 0,1127 | 0,1127 | |||||
| AABA / Altaba Inc | 0,00 | −78,03 | 0,20 | −76,77 | 0,1127 | 0,1127 | |||
| BDC / Belden Inc. | 0,00 | −100,00 | 0,00 | −100,00 | 0,0000 | 0,0000 | |||
| EIX / Edison International | 0,00 | −100,00 | 0,00 | −100,00 | −0,4508 | ||||
| CNP / CenterPoint Energy, Inc. | 0,00 | −100,00 | 0,00 | −100,00 | −0,4860 | ||||
| ARW / Arrow Electronics, Inc. | 0,00 | −100,00 | 0,00 | −100,00 | −0,3335 | ||||
| CVS / CVS Health Corporation | 0,00 | −100,00 | 0,00 | −100,00 | −0,3193 | ||||
| SPG / Simon Property Group, Inc. | 0,00 | −100,00 | 0,00 | −100,00 | −0,1578 | ||||
| LHX / L3Harris Technologies, Inc. | 0,00 | −100,00 | 0,00 | −100,00 | −0,2876 | ||||
| WHR / Whirlpool Corporation | 0,00 | −100,00 | 0,00 | −100,00 | −0,1070 | ||||
| LH / Labcorp Holdings Inc. | 0,00 | −100,00 | 0,00 | −100,00 | −0,2421 | ||||
| AMAT / Applied Materials, Inc. | 0,00 | −100,00 | 0,00 | −100,00 | −0,3300 | ||||
| TUP / Tupperware Brands Corporation | 0,00 | −100,00 | 0,00 | −100,00 | −0,4053 | ||||
| GS / The Goldman Sachs Group, Inc. | 0,00 | −100,00 | 0,00 | −100,00 | −0,1904 | ||||
| DRE / Duke Realty Corporation - Preferred Security | 0,00 | −100,00 | 0,00 | −100,00 | −0,1360 | ||||
| TSS / Total System Services, Inc. | 0,00 | −100,00 | 0,00 | −100,00 | −0,5930 | ||||
| CMA / Comerica Incorporated | 0,00 | −100,00 | 0,00 | −100,00 | −0,2925 | ||||
| SHW / The Sherwin-Williams Company | 0,00 | −100,00 | 0,00 | −100,00 | −0,3032 | ||||
| HPQ / HP Inc. | 0,00 | −100,00 | 0,00 | −100,00 | 0,0000 | 0,0000 | |||
| KHC / The Kraft Heinz Company | 0,00 | −100,00 | 0,00 | −100,00 | −0,1520 | ||||
| OA / Orbital ATK, Inc. | 0,00 | −100,00 | 0,00 | −100,00 | 0,0000 | 0,0000 | |||
| JW.A / John Wiley & Sons Inc. - Class A | 0,00 | −100,00 | 0,00 | −100,00 | 0,0000 | 0,0000 | |||
| BUFF / Innovator ETFs Trust - Innovator Laddered Allocation Power Buffer ETF | 0,00 | −100,00 | 0,00 | −100,00 | 0,0000 | 0,0000 | |||
| ILMN / Illumina, Inc. | 0,00 | −100,00 | 0,00 | −100,00 | 0,0000 | 0,0000 | |||
| PPC / Pilgrim's Pride Corporation | 0,00 | −100,00 | 0,00 | −100,00 | 0,0000 | 0,0000 | |||
| MA / Mastercard Incorporated | 0,00 | −100,00 | 0,00 | −100,00 | −0,2644 | ||||
| PAG / Penske Automotive Group, Inc. | 0,00 | −100,00 | 0,00 | −100,00 | −0,3817 | ||||
| PGR / The Progressive Corporation | 0,00 | −100,00 | 0,00 | −100,00 | −0,4169 | ||||
| TROW / T. Rowe Price Group, Inc. | 0,00 | −100,00 | 0,00 | −100,00 | 0,0000 | 0,0000 | |||
| USG / USCF ETF Trust - USCF Gold Strategy Plus Income Fund | 0,00 | −100,00 | 0,00 | −100,00 | 0,0000 | 0,0000 | |||
| ARMK / Aramark | 0,00 | −100,00 | 0,00 | −100,00 | 0,0000 | 0,0000 | |||
| VSAT / Viasat, Inc. | 0,00 | −100,00 | 0,00 | −100,00 | 0,0000 | 0,0000 | |||
| CATY / Cathay General Bancorp | 0,00 | −100,00 | 0,00 | −100,00 | 0,0000 | 0,0000 | |||
| O / Realty Income Corporation | 0,00 | −100,00 | 0,00 | −100,00 | 0,0000 | 0,0000 | |||
| MKTX / MarketAxess Holdings Inc. | 0,00 | −100,00 | 0,00 | −100,00 | 0,0000 | 0,0000 | |||
| ED / Consolidated Edison, Inc. | 0,00 | −100,00 | 0,00 | −100,00 | 0,0000 | 0,0000 | |||
| CAH / Cardinal Health, Inc. | 0,00 | −100,00 | 0,00 | −100,00 | −0,3728 | ||||
| TDY / Teledyne Technologies Incorporated | 0,00 | −100,00 | 0,00 | −100,00 | 0,0000 | 0,0000 | |||
| MKC / McCormick & Company, Incorporated | 0,00 | −100,00 | 0,00 | −100,00 | 0,0000 | 0,0000 | |||
| ALL / The Allstate Corporation | 0,00 | −100,00 | 0,00 | −100,00 | −0,2457 | ||||
| AXP / American Express Company | 0,00 | −100,00 | 0,00 | −100,00 | −0,3023 | ||||
| FLR / Fluor Corporation | 0,00 | −100,00 | 0,00 | −100,00 | 0,0000 | 0,0000 | |||
| EPR / EPR Properties | 0,00 | −100,00 | 0,00 | −100,00 | −0,4013 | ||||
| 04685W103 / athenahealth, Inc. | 0,00 | −100,00 | 0,00 | −100,00 | 0,0000 | 0,0000 | |||
| US0153511094 / Alexion Pharmaceuticals, Inc. | 0,00 | −100,00 | 0,00 | −100,00 | −0,2377 | ||||
| AGCO / AGCO Corporation | 0,00 | −100,00 | 0,00 | −100,00 | 0,0000 | ||||
| VIAB / Viacom, Inc. | 0,00 | −100,00 | 0,00 | −100,00 | 0,0000 | 0,0000 | |||
| FL / Foot Locker, Inc. | 0,00 | −100,00 | 0,00 | −100,00 | 0,0000 | 0,0000 | |||
| BERY / Berry Global Group, Inc. | 0,00 | −100,00 | 0,00 | −100,00 | 0,0000 | ||||
| BMS / Bemis Co., Inc. | 0,00 | −100,00 | 0,00 | −100,00 | 0,0000 | 0,0000 |