Grundläggande statistik
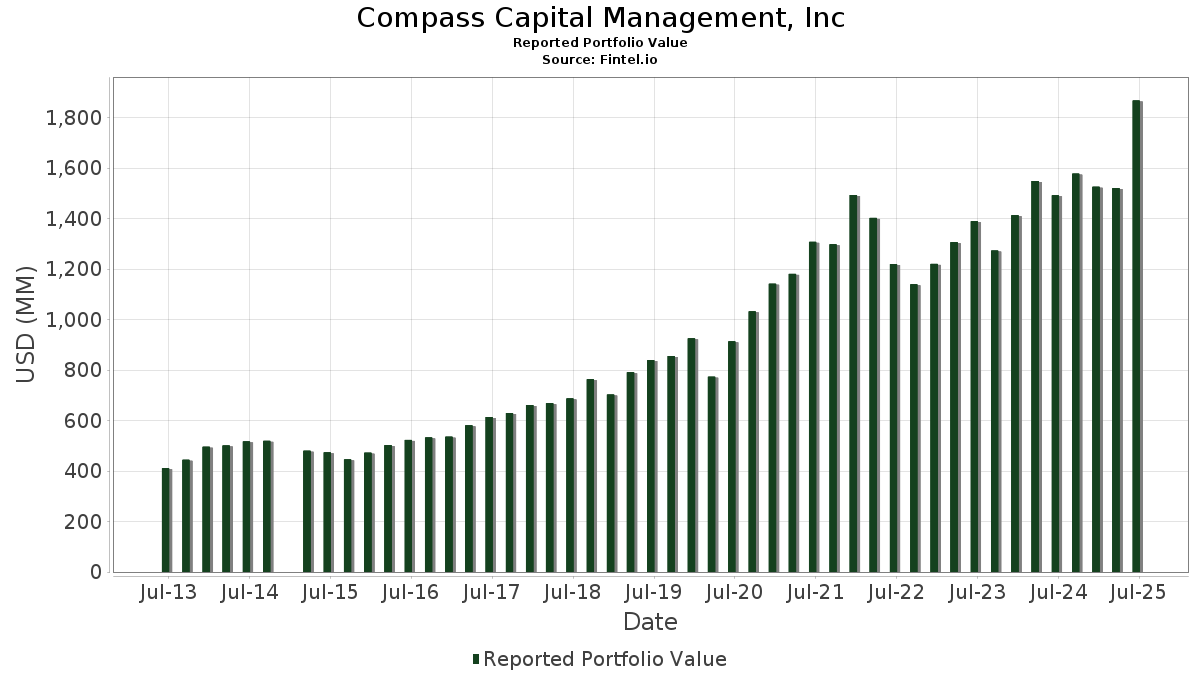
| Portföljvärde | $ 1 867 176 486 |
| Aktuella positioner | 63 |
Senaste innehav, resultat, förvaltat kapital (från 13F, 13D)
Compass Capital Management, Inc har redovisat 63 totala innehav i sina senaste SEC-arkiveringar. Det senaste portföljvärdet beräknas vara $ 1 867 176 486 USD. Faktiskt förvaltade tillgångar (AUM) är detta värde plus likvida medel (som inte redovisas). Compass Capital Management, Incs största innehav är Microsoft Corporation (US:MSFT) , Amphenol Corporation (US:APH) , Fiserv, Inc. (US:FI) , Visa Inc. (US:V) , and Intercontinental Exchange, Inc. (US:ICE) . Compass Capital Management, Incs nya positioner inkluderar Palo Alto Networks, Inc. (US:PANW) , ServiceNow, Inc. (US:NOW) , Royal Caribbean Cruises Ltd. (US:RCL) , Marriott International, Inc. (US:MAR) , and Mastercard Incorporated (US:MA) .
Största ökningarna detta kvartal
Vi använder förändringen i portföljallokeringen eftersom det är det mest meningsfulla måttet. Förändringar kan bero på transaktioner eller förändringar i aktiekurser.
| Värdepapper | Aktier (MM) |
Värde (MM$) |
Portfölj % av | ΔPortfölj % av |
|---|---|---|---|---|
| 0,10 | 20,74 | 1,1108 | 1,1108 | |
| 0,02 | 18,94 | 1,0143 | 1,0143 | |
| 0,06 | 18,85 | 1,0097 | 1,0097 | |
| 0,19 | 94,12 | 5,0410 | 0,9796 | |
| 0,06 | 17,46 | 0,9352 | 0,9352 | |
| 0,03 | 17,37 | 0,9302 | 0,9302 | |
| 0,11 | 16,07 | 0,8607 | 0,8607 | |
| 0,07 | 15,32 | 0,8207 | 0,8207 | |
| 0,03 | 14,80 | 0,7928 | 0,7928 | |
| 0,05 | 14,38 | 0,7699 | 0,7699 |
Största minskningarna detta kvartal
Vi använder förändringen i portföljallokeringen eftersom det är det mest meningsfulla måttet. Förändringar kan bero på transaktioner eller förändringar i aktiepriser.
| Värdepapper | Aktier (MM) |
Värde (MM$) |
Portfölj % av | ΔPortfölj % av |
|---|---|---|---|---|
| 0,58 | 55,28 | 2,9606 | −1,0811 | |
| 0,29 | 63,34 | 3,3920 | −1,0040 | |
| 0,37 | 57,00 | 3,0526 | −1,0010 | |
| 0,19 | 66,69 | 3,5719 | −0,9987 | |
| 0,20 | 60,15 | 3,2212 | −0,9510 | |
| 0,11 | 59,55 | 3,1894 | −0,8848 | |
| 0,14 | 59,81 | 3,2032 | −0,8623 | |
| 0,50 | 57,14 | 3,0601 | −0,8613 | |
| 0,18 | 61,09 | 3,2717 | −0,8329 | |
| 0,13 | 58,74 | 3,1457 | −0,7119 |
13F- och fond arkiveringar
Denna blankett lämnades in den 2025-08-07 för rapporteringsperioden 2025-06-30. Klicka på länksymbolen för att se hela transaktionshistoriken.
Uppgradera för att låsa upp premiumdata och exportera till Excel![]() .
.
| Värdepapper | Typ | Genomsnittligt aktiepris | Aktier (MM) |
ΔAktier (%) |
ΔAktier (%) |
Värde ($MM) |
Portfölj (%) |
ΔPortfölj (%) |
|
|---|---|---|---|---|---|---|---|---|---|
| MSFT / Microsoft Corporation | 0,19 | 15,04 | 94,12 | 52,43 | 5,0410 | 0,9796 | |||
| APH / Amphenol Corporation | 0,84 | −8,66 | 82,72 | 37,52 | 4,4304 | 0,4738 | |||
| FI / Fiserv, Inc. | 0,40 | 39,79 | 69,53 | 9,14 | 3,7237 | −0,4665 | |||
| V / Visa Inc. | 0,19 | −5,27 | 66,69 | −4,03 | 3,5719 | −0,9987 | |||
| ICE / Intercontinental Exchange, Inc. | 0,36 | −3,79 | 66,30 | 2,33 | 3,5508 | −0,7105 | |||
| SYK / Stryker Corporation | 0,17 | −1,57 | 66,24 | 4,61 | 3,5476 | −0,6170 | |||
| FAST / Fastenal Company | 1,53 | 87,87 | 64,07 | 1,75 | 3,4316 | −0,7102 | |||
| CHKP / Check Point Software Technologies Ltd. | 0,29 | −2,38 | 63,34 | −5,24 | 3,3920 | −1,0040 | |||
| GOOGL / Alphabet Inc. | 0,36 | 1,04 | 62,79 | 15,15 | 3,3628 | −0,2238 | |||
| WMT / Walmart Inc. | 0,63 | −3,40 | 61,99 | 7,60 | 3,3200 | −0,4694 | |||
| TMO / Thermo Fisher Scientific Inc. | 0,15 | 35,84 | 61,57 | 10,69 | 3,2975 | −0,3610 | |||
| SHW / The Sherwin-Williams Company | 0,18 | −0,45 | 61,09 | −2,11 | 3,2717 | −0,8329 | |||
| ADP / Automatic Data Processing, Inc. | 0,20 | −6,07 | 60,15 | −5,18 | 3,2212 | −0,9510 | |||
| MSI / Motorola Solutions, Inc. | 0,14 | 0,75 | 59,81 | −3,24 | 3,2032 | −0,8623 | |||
| MRK / Merck & Co., Inc. | 0,75 | 26,13 | 59,75 | 11,23 | 3,2003 | −0,3331 | |||
| QCOM / QUALCOMM Incorporated | 0,37 | 3,73 | 59,64 | 7,54 | 3,1939 | −0,4533 | |||
| ROP / Roper Technologies, Inc. | 0,11 | −0,00 | 59,55 | −3,86 | 3,1894 | −0,8848 | |||
| ACN / Accenture plc | 0,20 | 6,78 | 58,82 | 2,28 | 3,1501 | −0,6321 | |||
| LIN / Linde plc | 0,13 | −0,61 | 58,74 | 0,14 | 3,1457 | −0,7119 | |||
| EXPD / Expeditors International of Washington, Inc. | 0,50 | 0,87 | 57,14 | −4,17 | 3,0601 | −0,8613 | |||
| ITW / Illinois Tool Works Inc. | 0,23 | 0,75 | 57,06 | 0,45 | 3,0560 | −0,6804 | |||
| JNJ / Johnson & Johnson | 0,37 | 0,41 | 57,00 | −7,52 | 3,0526 | −1,0010 | |||
| DHR / Danaher Corporation | 0,28 | 6,69 | 55,56 | 2,81 | 2,9756 | −0,5788 | |||
| CHD / Church & Dwight Co., Inc. | 0,58 | 3,04 | 55,28 | −10,04 | 2,9606 | −1,0811 | |||
| FDX / FedEx Corporation | 0,24 | 7,98 | 54,27 | 0,69 | 2,9065 | −0,6386 | |||
| PANW / Palo Alto Networks, Inc. | 0,10 | 20,74 | 1,1108 | 1,1108 | |||||
| NOW / ServiceNow, Inc. | 0,02 | 18,94 | 1,0143 | 1,0143 | |||||
| RCL / Royal Caribbean Cruises Ltd. | 0,06 | 18,85 | 1,0097 | 1,0097 | |||||
| MAR / Marriott International, Inc. | 0,06 | 17,46 | 0,9352 | 0,9352 | |||||
| MA / Mastercard Incorporated | 0,03 | 17,37 | 0,9302 | 0,9302 | |||||
| RTX / RTX Corporation | 0,11 | 16,07 | 0,8607 | 0,8607 | |||||
| AMZN / Amazon.com, Inc. | 0,07 | 15,32 | 0,8207 | 0,8207 | |||||
| ISRG / Intuitive Surgical, Inc. | 0,03 | 14,80 | 0,7928 | 0,7928 | |||||
| AAPL / Apple Inc. | 0,07 | 407,27 | 14,39 | 368,52 | 0,7709 | 0,5688 | |||
| CRM / Salesforce, Inc. | 0,05 | 14,38 | 0,7699 | 0,7699 | |||||
| LLY / Eli Lilly and Company | 0,02 | 6 991,15 | 14,37 | 6 615,89 | 0,7697 | 0,7556 | |||
| BA / The Boeing Company | 0,06 | 13,25 | 0,7095 | 0,7095 | |||||
| 0VQD / Chubb Limited | 0,04 | 12,54 | 0,6715 | 0,6715 | |||||
| CAT / Caterpillar Inc. | 0,03 | 11,83 | 0,6338 | 0,6338 | |||||
| HD / The Home Depot, Inc. | 0,03 | 2 543,14 | 10,45 | 2 544,56 | 0,5595 | 0,5335 | |||
| ZTS / Zoetis Inc. | 0,06 | 9,37 | 0,5018 | 0,5018 | |||||
| SBUX / Starbucks Corporation | 0,10 | 9,33 | 0,4995 | 0,4995 | |||||
| BRK.A / Berkshire Hathaway Inc. | 0,00 | 0,00 | 8,75 | −8,73 | 0,4684 | −0,1618 | |||
| DAL / Delta Air Lines, Inc. | 0,18 | 8,72 | 0,4671 | 0,4671 | |||||
| DVN / Devon Energy Corporation | 0,23 | 7,38 | 0,3951 | 0,3951 | |||||
| GEV / GE Vernova Inc. | 0,01 | 3,30 | 0,1770 | 0,1770 | |||||
| JPM / JPMorgan Chase & Co. | 0,01 | 2,80 | 0,1500 | 0,1500 | |||||
| DE / Deere & Company | 0,01 | 2,76 | 0,1476 | 0,1476 | |||||
| SPGI / S&P Global Inc. | 0,00 | 1,57 | 0,0840 | 0,0840 | |||||
| BLK / BlackRock, Inc. | 0,00 | 1,26 | 0,0674 | 0,0674 | |||||
| MCD / McDonald's Corporation | 0,00 | 5,47 | 1,13 | −1,40 | 0,0603 | −0,0148 | |||
| BP / BP p.l.c. - Depositary Receipt (Common Stock) | 0,04 | 1,12 | 0,0602 | 0,0602 | |||||
| XOM / Exxon Mobil Corporation | 0,01 | 0,83 | 0,0443 | 0,0443 | |||||
| OMC / Omnicom Group Inc. | 0,01 | 0,00 | 0,78 | −13,18 | 0,0416 | −0,0173 | |||
| 1AMGN / Amgen Inc. | 0,00 | 0,65 | 0,0351 | 0,0351 | |||||
| HON / Honeywell International Inc. | 0,00 | 0,61 | 0,0324 | 0,0324 | |||||
| PAYX / Paychex, Inc. | 0,00 | 0,54 | 0,0290 | 0,0290 | |||||
| SPY / SPDR S&P 500 ETF | 0,00 | 32,62 | 0,54 | 46,72 | 0,0288 | 0,0047 | |||
| TGT / Target Corporation | 0,01 | −11,64 | 0,53 | −16,59 | 0,0286 | −0,0134 | |||
| PEP / PepsiCo, Inc. | 0,00 | 0,00 | 0,50 | −11,82 | 0,0268 | −0,0106 | |||
| SLB / Schlumberger Limited | 0,01 | 0,27 | 0,0147 | 0,0147 | |||||
| EMR / Emerson Electric Co. | 0,00 | 0,24 | 0,0129 | 0,0129 | |||||
| DIS / The Walt Disney Company | 0,00 | −50,71 | 0,22 | −38,06 | 0,0120 | −0,0118 |