Grundläggande statistik
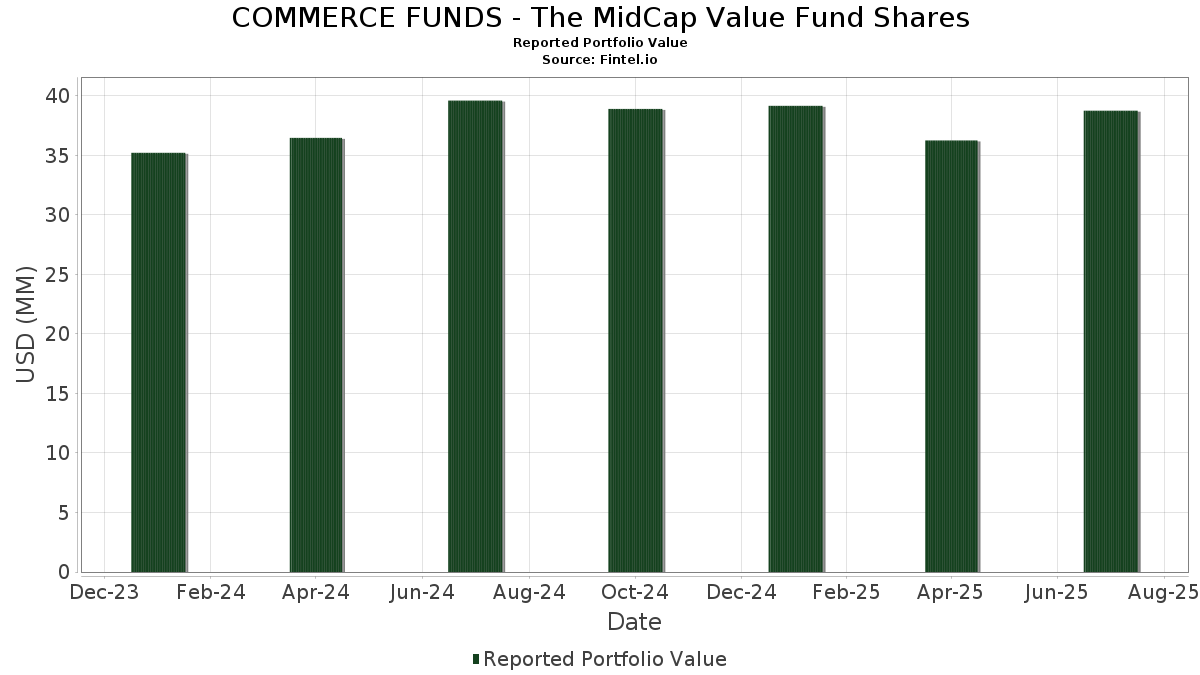
| Portföljvärde | $ 36 244 096 |
| Aktuella positioner | 82 |
Senaste innehav, resultat, förvaltat kapital (från 13F, 13D)
COMMERCE FUNDS - The MidCap Value Fund Shares har redovisat 82 totala innehav i sina senaste SEC-arkiveringar. Det senaste portföljvärdet beräknas vara $ 36 244 096 USD. Faktiskt förvaltade tillgångar (AUM) är detta värde plus likvida medel (som inte redovisas). COMMERCE FUNDS - The MidCap Value Fund Sharess största innehav är iShares Trust - iShares Russell Mid-Cap Value ETF (US:IWS) , State Street Institutional Investment Trust - State Street Institutional US Govt Money Market Fnd Premier Cls (US:GVMXX) , Allegion plc (US:ALLE) , ResMed Inc. (US:RMD) , and Digital Realty Trust, Inc. (US:DLR) . COMMERCE FUNDS - The MidCap Value Fund Sharess nya positioner inkluderar Motorola Solutions, Inc. (US:MSI) , Lowe's Companies, Inc. (US:LOW) , Gen Digital Inc. (US:GEN) , Prologis, Inc. (US:PLD) , and Regions Financial Corporation (US:RF) .
Största ökningarna detta kvartal
Vi använder förändringen i portföljallokeringen eftersom det är det mest meningsfulla måttet. Förändringar kan bero på transaktioner eller förändringar i aktiekurser.
| Värdepapper | Aktier (MM) |
Värde (MM$) |
Portfölj % av | ΔPortfölj % av |
|---|---|---|---|---|
| 0,00 | 0,46 | 1,2779 | 1,2779 | |
| 0,00 | 0,44 | 1,2110 | 1,2110 | |
| 0,00 | 0,44 | 1,2073 | 1,2073 | |
| 0,02 | 0,42 | 1,1704 | 1,1704 | |
| 0,00 | 0,42 | 1,1594 | 1,1594 | |
| 0,02 | 0,42 | 1,1563 | 1,1563 | |
| 0,01 | 0,41 | 1,1446 | 1,1446 | |
| 0,00 | 0,41 | 1,1260 | 1,1260 | |
| 0,93 | 0,93 | 2,5700 | 0,9725 | |
| 0,00 | 0,47 | 1,3111 | 0,2614 |
Största minskningarna detta kvartal
Vi använder förändringen i portföljallokeringen eftersom det är det mest meningsfulla måttet. Förändringar kan bero på transaktioner eller förändringar i aktiepriser.
| Värdepapper | Aktier (MM) |
Värde (MM$) |
Portfölj % av | ΔPortfölj % av |
|---|---|---|---|---|
| 0,00 | 0,00 | −1,0468 | ||
| 0,01 | 1,10 | 3,0531 | −0,7077 | |
| 0,01 | 0,34 | 0,9272 | −0,3114 | |
| 0,00 | 0,39 | 1,0752 | −0,2732 | |
| 0,00 | 0,40 | 1,1046 | −0,2346 | |
| 0,01 | 0,41 | 1,1247 | −0,1705 | |
| 0,01 | 0,39 | 1,0672 | −0,1665 | |
| 0,00 | 0,45 | 1,2338 | −0,1617 | |
| 0,01 | 0,39 | 1,0743 | −0,1592 | |
| 0,01 | 0,38 | 1,0417 | −0,1581 |
13F- och fond arkiveringar
Denna blankett lämnades in den 2025-06-17 för rapporteringsperioden 2025-04-30. Klicka på länksymbolen för att se hela transaktionshistoriken.
Uppgradera för att låsa upp premiumdata och exportera till Excel![]() .
.
| Värdepapper | Typ | Genomsnittligt aktiepris | Aktier (MM) |
ΔAktier (%) |
ΔAktier (%) |
Värde ($MM) |
Portfölj (%) |
ΔPortfölj (%) |
|
|---|---|---|---|---|---|---|---|---|---|
| IWS / iShares Trust - iShares Russell Mid-Cap Value ETF | 0,01 | −18,18 | 1,10 | −24,90 | 3,0531 | −0,7077 | |||
| GVMXX / State Street Institutional Investment Trust - State Street Institutional US Govt Money Market Fnd Premier Cls | 0,93 | 48,86 | 0,93 | 48,88 | 2,5700 | 0,9725 | |||
| ALLE / Allegion plc | 0,00 | 4,95 | 0,49 | 10,18 | 1,3464 | 0,2145 | |||
| RMD / ResMed Inc. | 0,00 | 5,19 | 0,48 | 5,51 | 1,3240 | 0,1614 | |||
| DLR / Digital Realty Trust, Inc. | 0,00 | 17,96 | 0,47 | 15,61 | 1,3111 | 0,2614 | |||
| DGX / Quest Diagnostics Incorporated | 0,00 | −11,04 | 0,47 | −2,67 | 1,3101 | 0,0631 | |||
| LHX / L3Harris Technologies, Inc. | 0,00 | 4,15 | 0,47 | 8,06 | 1,2982 | 0,1868 | |||
| CME / CME Group Inc. | 0,00 | −15,08 | 0,47 | −0,43 | 1,2941 | 0,0905 | |||
| ED / Consolidated Edison, Inc. | 0,00 | −17,09 | 0,47 | −0,21 | 1,2853 | 0,0928 | |||
| OHI / Omega Healthcare Investors, Inc. | 0,01 | −1,00 | 0,46 | 4,27 | 1,2848 | 0,1452 | |||
| MSI / Motorola Solutions, Inc. | 0,00 | 0,46 | 1,2779 | 1,2779 | |||||
| RS / Reliance, Inc. | 0,00 | 4,58 | 0,46 | 4,30 | 1,2745 | 0,1418 | |||
| LH / Labcorp Holdings Inc. | 0,00 | −4,76 | 0,46 | −8,23 | 1,2655 | −0,0089 | |||
| SO / The Southern Company | 0,00 | −10,99 | 0,46 | −2,56 | 1,2647 | 0,0636 | |||
| WEC / WEC Energy Group, Inc. | 0,00 | −14,21 | 0,46 | −5,20 | 1,2606 | 0,0283 | |||
| LAMR / Lamar Advertising Company | 0,00 | 11,73 | 0,46 | 0,66 | 1,2581 | 0,1008 | |||
| HAS / Hasbro, Inc. | 0,01 | 1,17 | 0,45 | 8,35 | 1,2565 | 0,1827 | |||
| EXR / Extra Space Storage Inc. | 0,00 | 8,03 | 0,45 | 2,72 | 1,2532 | 0,1250 | |||
| INGR / Ingredion Incorporated | 0,00 | 3,33 | 0,45 | 0,44 | 1,2517 | 0,1003 | |||
| STE / STERIS plc | 0,00 | −7,78 | 0,45 | −6,22 | 1,2515 | 0,0186 | |||
| PNW / Pinnacle West Capital Corporation | 0,00 | −9,01 | 0,45 | −0,44 | 1,2481 | 0,0885 | |||
| TPL / Texas Pacific Land Corporation | 0,00 | −1,41 | 0,45 | −1,96 | 1,2467 | 0,0691 | |||
| JCI / Johnson Controls International plc | 0,01 | −4,36 | 0,45 | 2,74 | 1,2463 | 0,1253 | |||
| REG / Regency Centers Corporation | 0,01 | −1,35 | 0,45 | −0,88 | 1,2408 | 0,0825 | |||
| SYY / Sysco Corporation | 0,01 | 7,47 | 0,45 | 5,19 | 1,2343 | 0,1490 | |||
| DOX / Amdocs Limited | 0,01 | −7,44 | 0,45 | −7,08 | 1,2338 | 0,0059 | |||
| DRI / Darden Restaurants, Inc. | 0,00 | −20,39 | 0,45 | −18,17 | 1,2338 | −0,1617 | |||
| K / Kellanova | 0,01 | −7,94 | 0,45 | −6,69 | 1,2329 | 0,0092 | |||
| AVB / AvalonBay Communities, Inc. | 0,00 | 2,17 | 0,45 | −3,05 | 1,2303 | 0,0549 | |||
| CNA / CNA Financial Corporation | 0,01 | −4,75 | 0,44 | −6,60 | 1,2152 | 0,0127 | |||
| UGI / UGI Corporation | 0,01 | −19,54 | 0,44 | −14,09 | 1,2148 | −0,0944 | |||
| LOW / Lowe's Companies, Inc. | 0,00 | 0,44 | 1,2110 | 1,2110 | |||||
| WMB / The Williams Companies, Inc. | 0,01 | −13,50 | 0,44 | −8,58 | 1,2083 | −0,0149 | |||
| PPG / PPG Industries, Inc. | 0,00 | 7,93 | 0,44 | 1,86 | 1,2079 | 0,1103 | |||
| CLX / The Clorox Company | 0,00 | 0,44 | 1,2073 | 1,2073 | |||||
| STT / State Street Corporation | 0,00 | 3,58 | 0,43 | −10,17 | 1,1967 | −0,0364 | |||
| LNT / Alliant Energy Corporation | 0,01 | −8,91 | 0,43 | −5,70 | 1,1901 | 0,0240 | |||
| MSCI / MSCI Inc. | 0,00 | 3,95 | 0,43 | −5,08 | 1,1901 | 0,0303 | |||
| HBAN / Huntington Bancshares Incorporated | 0,03 | 8,50 | 0,43 | −8,32 | 1,1898 | −0,0114 | |||
| CTSH / Cognizant Technology Solutions Corporation | 0,01 | −0,51 | 0,43 | −11,39 | 1,1833 | −0,0525 | |||
| OZK / Bank OZK | 0,01 | 0,55 | 0,43 | −15,78 | 1,1820 | −0,1148 | |||
| ZTS / Zoetis Inc. | 0,00 | 3,02 | 0,43 | −5,75 | 1,1778 | 0,0219 | |||
| SWKS / Skyworks Solutions, Inc. | 0,01 | 25,76 | 0,43 | −8,80 | 1,1751 | −0,0188 | |||
| UNM / Unum Group | 0,01 | −14,13 | 0,42 | −12,58 | 1,1740 | −0,0681 | |||
| ROK / Rockwell Automation, Inc. | 0,00 | 8,54 | 0,42 | −3,42 | 1,1739 | 0,0490 | |||
| ITW / Illinois Tool Works Inc. | 0,00 | 2,91 | 0,42 | −4,72 | 1,1735 | 0,0337 | |||
| TROW / T. Rowe Price Group, Inc. | 0,00 | 25,56 | 0,42 | −4,93 | 1,1722 | 0,0316 | |||
| GEN / Gen Digital Inc. | 0,02 | 0,42 | 1,1704 | 1,1704 | |||||
| DOV / Dover Corporation | 0,00 | 6,00 | 0,42 | −11,16 | 1,1672 | −0,0489 | |||
| SEE / Sealed Air Corporation | 0,02 | 20,63 | 0,42 | −4,54 | 1,1646 | 0,0356 | |||
| PLD / Prologis, Inc. | 0,00 | 0,42 | 1,1594 | 1,1594 | |||||
| USB / U.S. Bancorp | 0,01 | 12,94 | 0,42 | −4,78 | 1,1578 | 0,0343 | |||
| RF / Regions Financial Corporation | 0,02 | 0,42 | 1,1563 | 1,1563 | |||||
| OMC / Omnicom Group Inc. | 0,01 | 7,97 | 0,42 | −5,23 | 1,1545 | 0,0270 | |||
| TNL / Travel + Leisure Co. | 0,01 | 7,83 | 0,41 | −12,84 | 1,1449 | −0,0708 | |||
| CMCSA / Comcast Corporation | 0,01 | 0,41 | 1,1446 | 1,1446 | |||||
| APD / Air Products and Chemicals, Inc. | 0,00 | 2,35 | 0,41 | −17,23 | 1,1425 | −0,1349 | |||
| TGT / Target Corporation | 0,00 | 22,67 | 0,41 | −13,96 | 1,1425 | −0,0866 | |||
| ESS / Essex Property Trust, Inc. | 0,00 | −5,43 | 0,41 | −7,19 | 1,1418 | 0,0029 | |||
| EMR / Emerson Electric Co. | 0,00 | 8,71 | 0,41 | −11,94 | 1,1416 | −0,0597 | |||
| TFC / Truist Financial Corporation | 0,01 | 6,54 | 0,41 | −14,37 | 1,1385 | −0,0896 | |||
| KEY / KeyCorp | 0,03 | 8,25 | 0,41 | −10,72 | 1,1301 | −0,0403 | |||
| MPC / Marathon Petroleum Corporation | 0,00 | 0,41 | 1,1260 | 1,1260 | |||||
| THO / THOR Industries, Inc. | 0,01 | 26,12 | 0,41 | −11,14 | 1,1258 | −0,0471 | |||
| MET / MetLife, Inc. | 0,01 | −5,84 | 0,41 | −18,15 | 1,1248 | −0,1439 | |||
| GLW / Corning Incorporated | 0,01 | −5,71 | 0,41 | −19,76 | 1,1247 | −0,1705 | |||
| FDX / FedEx Corporation | 0,00 | 14,54 | 0,41 | −9,19 | 1,1219 | −0,0194 | |||
| CMI / Cummins Inc. | 0,00 | 12,20 | 0,41 | −7,53 | 1,1206 | 0,0001 | |||
| BBY / Best Buy Co., Inc. | 0,01 | 11,93 | 0,40 | −13,15 | 1,1151 | −0,0717 | |||
| LSTR / Landstar System, Inc. | 0,00 | 17,52 | 0,40 | −4,31 | 1,1067 | 0,0372 | |||
| BDX / Becton, Dickinson and Company | 0,00 | −8,75 | 0,40 | −23,71 | 1,1046 | −0,2346 | |||
| PFG / Principal Financial Group, Inc. | 0,01 | −6,47 | 0,40 | −15,92 | 1,0953 | −0,1096 | |||
| VLO / Valero Energy Corporation | 0,00 | −3,57 | 0,39 | −15,88 | 1,0844 | −0,1077 | |||
| OSK / Oshkosh Corporation | 0,00 | 2,54 | 0,39 | −26,19 | 1,0752 | −0,2732 | |||
| AAP / Advance Auto Parts, Inc. | 0,01 | 19,46 | 0,39 | −19,50 | 1,0743 | −0,1592 | |||
| LFUS / Littelfuse, Inc. | 0,00 | 14,29 | 0,39 | −12,67 | 1,0681 | −0,0625 | |||
| EMN / Eastman Chemical Company | 0,01 | 6,36 | 0,39 | −17,70 | 1,0672 | −0,1343 | |||
| TKR / The Timken Company | 0,01 | 0,00 | 0,39 | −19,92 | 1,0672 | −0,1665 | |||
| LAZ / Lazard, Inc. | 0,01 | 12,28 | 0,38 | −19,83 | 1,0417 | −0,1581 | |||
| NXST / Nexstar Media Group, Inc. | 0,00 | −10,83 | 0,38 | −12,99 | 1,0381 | −0,0648 | |||
| OKE / ONEOK, Inc. | 0,00 | 0,00 | 0,37 | −15,40 | 1,0184 | −0,0961 | |||
| SWK / Stanley Black & Decker, Inc. | 0,01 | 1,64 | 0,34 | −30,79 | 0,9272 | −0,3114 | |||
| BC / Brunswick Corporation | 0,00 | −100,00 | 0,00 | −100,00 | −1,0468 |