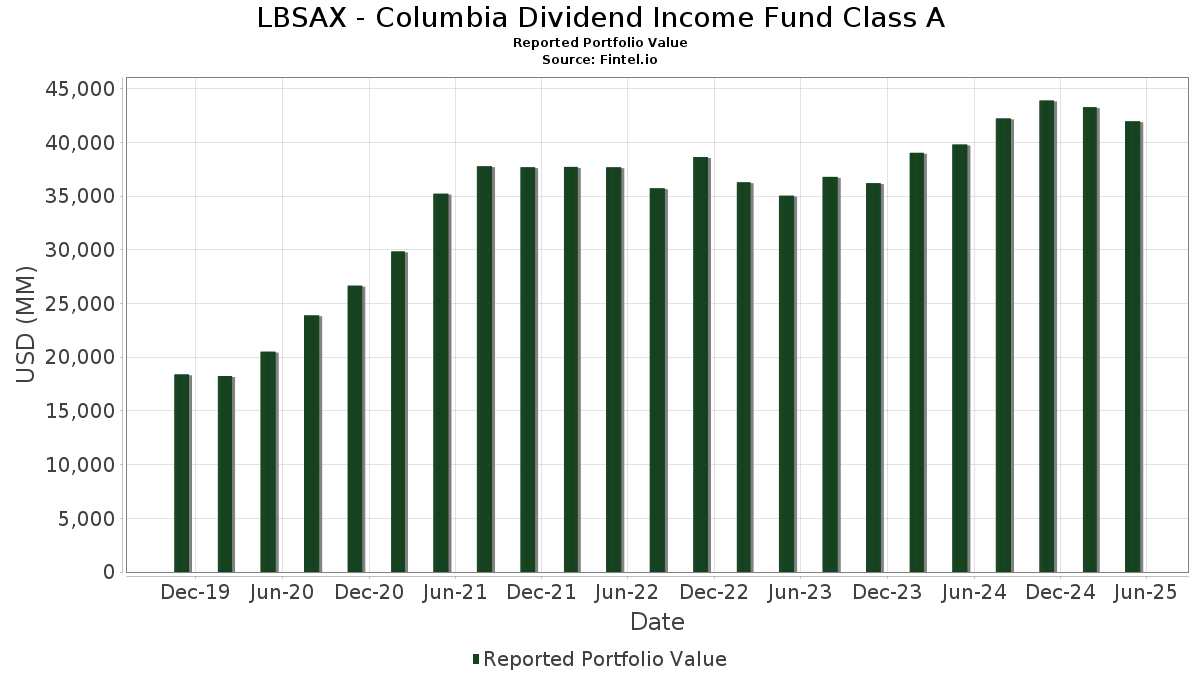
Grundläggande statistik
| Portföljvärde | $ 41 957 332 122 |
| Aktuella positioner | 80 |
Senaste innehav, resultat, förvaltat kapital (från 13F, 13D)
LBSAX - Columbia Dividend Income Fund Class A har redovisat 80 totala innehav i sina senaste SEC-arkiveringar. Det senaste portföljvärdet beräknas vara $ 41 957 332 122 USD. Faktiskt förvaltade tillgångar (AUM) är detta värde plus likvida medel (som inte redovisas). LBSAX - Columbia Dividend Income Fund Class As största innehav är JPMorgan Chase & Co. (US:JPM) , Microsoft Corporation (US:MSFT) , Walmart Inc. (US:WMT) , Johnson & Johnson (US:JNJ) , and Exxon Mobil Corporation (US:XOM) . LBSAX - Columbia Dividend Income Fund Class As nya positioner inkluderar Altria Group, Inc. (US:MO) , Welltower Inc. (US:WELL) , .
Största ökningarna detta kvartal
Vi använder förändringen i portföljallokeringen eftersom det är det mest meningsfulla måttet. Förändringar kan bero på transaktioner eller förändringar i aktiekurser.
| Värdepapper | Aktier (MM) |
Värde (MM$) |
Portfölj % av | ΔPortfölj % av |
|---|---|---|---|---|
| 1,75 | 487,44 | 1,1598 | 0,7467 | |
| 5,15 | 311,90 | 0,7421 | 0,7421 | |
| 1,55 | 247,51 | 0,5889 | 0,5889 | |
| 2,03 | 223,01 | 0,5306 | 0,5306 | |
| 4,09 | 989,76 | 2,3550 | 0,4543 | |
| 0,79 | 252,29 | 0,6003 | 0,3494 | |
| 5,45 | 616,16 | 1,4661 | 0,3367 | |
| 0,84 | 129,29 | 0,3076 | 0,3076 | |
| 2,52 | 798,72 | 1,9005 | 0,2757 | |
| 1,31 | 564,36 | 1,3428 | 0,2614 |
Största minskningarna detta kvartal
Vi använder förändringen i portföljallokeringen eftersom det är det mest meningsfulla måttet. Förändringar kan bero på transaktioner eller förändringar i aktiepriser.
| Värdepapper | Aktier (MM) |
Värde (MM$) |
Portfölj % av | ΔPortfölj % av |
|---|---|---|---|---|
| 1,14 | 345,13 | 0,8212 | −1,2114 | |
| 4,17 | 570,66 | 1,3578 | −0,7152 | |
| 4,46 | 829,42 | 1,9735 | −0,4868 | |
| 3,20 | 246,05 | 0,5854 | −0,3743 | |
| 2,59 | 280,73 | 0,6680 | −0,3395 | |
| 1,24 | 226,39 | 0,5387 | −0,2872 | |
| 3,47 | 188,29 | 0,4480 | −0,2843 | |
| 2,26 | 291,42 | 0,6934 | −0,2729 | |
| 9,02 | 435,71 | 1,0367 | −0,2175 | |
| 12,51 | 1 235,44 | 2,9396 | −0,1909 |
13F- och fond arkiveringar
Denna blankett lämnades in den 2025-07-25 för rapporteringsperioden 2025-05-31. Klicka på länksymbolen för att se hela transaktionshistoriken.
Uppgradera för att låsa upp premiumdata och exportera till Excel![]() .
.
| Värdepapper | Typ | Genomsnittligt aktiepris | Aktier (MM) |
ΔAktier (%) |
ΔAktier (%) |
Värde ($MM) |
Portfölj (%) |
ΔPortfölj (%) |
|
|---|---|---|---|---|---|---|---|---|---|
| JPM / JPMorgan Chase & Co. | 7,03 | −1,03 | 1 856,92 | −1,27 | 4,4183 | 0,0792 | |||
| MSFT / Microsoft Corporation | 3,05 | −10,42 | 1 404,45 | 3,88 | 3,3417 | 0,2228 | |||
| WMT / Walmart Inc. | 12,51 | −9,06 | 1 235,44 | −8,96 | 2,9396 | −0,1909 | |||
| JNJ / Johnson & Johnson | 6,81 | −1,03 | 1 057,68 | −6,91 | 2,5166 | −0,1046 | |||
| XOM / Exxon Mobil Corporation | 10,30 | 8,45 | 1 053,51 | −0,34 | 2,5067 | 0,0679 | |||
| PG / The Procter & Gamble Company | 5,95 | −1,03 | 1 011,61 | −3,28 | 2,4070 | −0,0059 | |||
| AVGO / Broadcom Inc. | 4,09 | −1,03 | 989,76 | 20,13 | 2,3550 | 0,4543 | |||
| HD / The Home Depot, Inc. | 2,53 | −1,03 | 930,70 | −8,09 | 2,2145 | −0,1217 | |||
| CSCO / Cisco Systems, Inc. | 14,55 | −1,03 | 917,07 | −2,68 | 2,1821 | 0,0081 | |||
| CB / Chubb Limited | 2,87 | 6,75 | 853,45 | 11,14 | 2,0307 | 0,2591 | |||
| BAC / Bank of America Corporation | 19,13 | −1,03 | 844,20 | −5,26 | 2,0087 | −0,0470 | |||
| ABBV / AbbVie Inc. | 4,46 | −12,65 | 829,42 | −22,23 | 1,9735 | −0,4868 | |||
| WFC / Wells Fargo & Company | 10,72 | −1,03 | 801,72 | −5,50 | 1,9076 | −0,0497 | |||
| T / AT&T Inc. | 28,78 | −1,03 | 800,08 | 0,38 | 1,9037 | 0,0649 | |||
| IBM / International Business Machines Corporation | 3,08 | −1,03 | 798,81 | 1,57 | 1,9007 | 0,0863 | |||
| ACN / Accenture plc | 2,52 | 24,75 | 798,72 | 13,41 | 1,9005 | 0,2757 | |||
| MMC / Marsh & McLennan Companies, Inc. | 3,36 | −1,03 | 784,05 | −2,77 | 1,8656 | 0,0053 | |||
| PH / Parker-Hannifin Corporation | 1,14 | −1,03 | 759,89 | −1,59 | 1,8081 | 0,0266 | |||
| MCD / McDonald's Corporation | 2,37 | −1,03 | 743,28 | 0,74 | 1,7686 | 0,0665 | |||
| 19766H239 / COLUMBIA SHORT TERM CASH FUND | 727,29 | −10,14 | 727,07 | −10,16 | 1,7300 | −0,1370 | |||
| HON / Honeywell International Inc. | 3,14 | −1,03 | 712,30 | 5,38 | 1,6948 | 0,1354 | |||
| CMCSA / Comcast Corporation | 19,82 | −1,03 | 685,17 | −4,64 | 1,6303 | −0,0274 | |||
| ADI / Analog Devices, Inc. | 3,20 | −1,03 | 683,88 | −7,95 | 1,6272 | −0,0867 | |||
| CME / CME Group Inc. | 2,32 | −1,03 | 670,57 | 12,71 | 1,5955 | 0,2230 | |||
| ADP / Automatic Data Processing, Inc. | 2,05 | −1,03 | 665,71 | 2,22 | 1,5840 | 0,0816 | |||
| ABT / Abbott Laboratories | 4,78 | −1,03 | 638,56 | −4,21 | 1,5194 | −0,0184 | |||
| MS / Morgan Stanley | 4,83 | −1,03 | 618,71 | −4,81 | 1,4721 | −0,0273 | |||
| DIS / The Walt Disney Company | 5,45 | 26,71 | 616,16 | 25,86 | 1,4661 | 0,3367 | |||
| V / Visa Inc. | 1,69 | 8,33 | 615,36 | 9,07 | 1,4642 | 0,1627 | |||
| BK / The Bank of New York Mellon Corporation | 6,89 | −1,03 | 610,14 | −1,41 | 1,4518 | 0,0241 | |||
| CVX / Chevron Corporation | 4,17 | −26,31 | 570,66 | −36,49 | 1,3578 | −0,7152 | |||
| TT / Trane Technologies plc | 1,31 | −1,03 | 564,36 | 20,40 | 1,3428 | 0,2614 | |||
| WM / Waste Management, Inc. | 2,26 | −1,03 | 544,27 | 2,45 | 1,2950 | 0,0695 | |||
| LIN / Linde plc | 1,13 | −1,03 | 530,08 | −0,92 | 1,2613 | 0,0271 | |||
| BLK / BlackRock, Inc. | 0,54 | −1,03 | 528,43 | −0,82 | 1,2573 | 0,0282 | |||
| SO / The Southern Company | 5,61 | 7,59 | 504,93 | 7,85 | 1,2014 | 0,1213 | |||
| UNP / Union Pacific Corporation | 2,26 | −1,03 | 501,27 | −11,07 | 1,1927 | −0,1077 | |||
| MDLZ / Mondelez International, Inc. | 7,41 | −1,03 | 499,88 | 3,99 | 1,1894 | 0,0805 | |||
| KO / The Coca-Cola Company | 6,84 | −16,44 | 493,26 | −15,40 | 1,1737 | −0,1714 | |||
| PNC / The PNC Financial Services Group, Inc. | 2,82 | −1,03 | 490,25 | −10,37 | 1,1665 | −0,0953 | |||
| GD / General Dynamics Corporation | 1,75 | 146,89 | 487,44 | 172,19 | 1,1598 | 0,7467 | |||
| NOC / Northrop Grumman Corporation | 0,98 | −1,03 | 474,77 | 3,91 | 1,1297 | 0,0756 | |||
| ETR / Entergy Corporation | 5,67 | 8,20 | 472,11 | 3,21 | 1,1233 | 0,0680 | |||
| TJX / The TJX Companies, Inc. | 3,68 | −1,03 | 466,70 | 0,67 | 1,1104 | 0,0409 | |||
| BMY / Bristol-Myers Squibb Company | 9,02 | −1,03 | 435,71 | −19,85 | 1,0367 | −0,2175 | |||
| KLAC / KLA Corporation | 0,55 | −1,03 | 420,05 | 5,68 | 0,9995 | 0,0825 | |||
| ITW / Illinois Tool Works Inc. | 1,62 | −1,03 | 396,19 | −8,12 | 0,9427 | −0,0520 | |||
| LRCX / Lam Research Corporation | 4,84 | −1,03 | 391,32 | 4,19 | 0,9311 | 0,0647 | |||
| MDT / Medtronic plc | 4,66 | −1,03 | 387,05 | −10,75 | 0,9209 | −0,0795 | |||
| UNH / UnitedHealth Group Incorporated | 1,14 | −38,38 | 345,13 | −60,83 | 0,8212 | −1,2114 | |||
| MO / Altria Group, Inc. | 5,15 | 311,90 | 0,7421 | 0,7421 | |||||
| AEP / American Electric Power Company, Inc. | 2,96 | −1,03 | 306,04 | −3,42 | 0,7282 | −0,0028 | |||
| COP / ConocoPhillips | 3,58 | 39,61 | 305,84 | 20,18 | 0,7277 | 0,1406 | |||
| VLO / Valero Energy Corporation | 2,26 | −29,48 | 291,42 | −30,43 | 0,6934 | −0,2729 | |||
| CSX / CSX Corporation | 9,18 | −1,03 | 290,12 | −2,33 | 0,6903 | 0,0051 | |||
| EOG / EOG Resources, Inc. | 2,59 | −24,84 | 280,73 | −35,72 | 0,6680 | −0,3395 | |||
| EBAY / eBay Inc. | 3,68 | −1,03 | 269,42 | 11,86 | 0,6411 | 0,0854 | |||
| WEC / WEC Energy Group, Inc. | 2,42 | −1,03 | 260,47 | −0,33 | 0,6198 | 0,0168 | |||
| ETN / Eaton Corporation plc | 0,79 | 112,54 | 252,29 | 132,01 | 0,6003 | 0,3494 | |||
| TEL / TE Connectivity plc | 1,55 | 247,51 | 0,5889 | 0,5889 | |||||
| MRK / Merck & Co., Inc. | 3,20 | −28,99 | 246,05 | −40,86 | 0,5854 | −0,3743 | |||
| PEP / PepsiCo, Inc. | 1,77 | −1,03 | 232,54 | −15,23 | 0,5533 | −0,0795 | |||
| AEE / Ameren Corporation | 2,36 | −1,03 | 228,90 | −5,59 | 0,5447 | −0,0147 | |||
| TXN / Texas Instruments Incorporated | 1,24 | −32,22 | 226,39 | −36,76 | 0,5387 | −0,2872 | |||
| GILD / Gilead Sciences, Inc. | 2,03 | 223,01 | 0,5306 | 0,5306 | |||||
| PKG / Packaging Corporation of America | 1,14 | −1,03 | 220,35 | −10,28 | 0,5243 | −0,0423 | |||
| CMI / Cummins Inc. | 0,68 | −1,03 | 218,61 | −13,58 | 0,5202 | −0,0634 | |||
| NEE / NextEra Energy, Inc. | 2,92 | −1,03 | 205,93 | −0,37 | 0,4900 | 0,0132 | |||
| AVB / AvalonBay Communities, Inc. | 0,98 | −1,03 | 203,57 | −9,52 | 0,4844 | −0,0347 | |||
| PEG / Public Service Enterprise Group Incorporated | 2,41 | −1,03 | 195,69 | −1,18 | 0,4656 | 0,0088 | |||
| GIS / General Mills, Inc. | 3,47 | −33,73 | 188,29 | −40,69 | 0,4480 | −0,2843 | |||
| PLD / Prologis, Inc. | 1,73 | −1,03 | 187,75 | −13,27 | 0,4467 | −0,0526 | |||
| PSA / Public Storage | 0,61 | −1,03 | 187,65 | 0,53 | 0,4465 | 0,0159 | |||
| BX / Blackstone Inc. | 1,34 | −1,03 | 185,58 | −14,79 | 0,4416 | −0,0608 | |||
| CMS / CMS Energy Corporation | 2,60 | −1,03 | 182,33 | −4,85 | 0,4338 | −0,0082 | |||
| QCOM / QUALCOMM Incorporated | 1,24 | −1,03 | 179,85 | −8,57 | 0,4279 | −0,0259 | |||
| AVY / Avery Dennison Corporation | 0,96 | −1,03 | 169,96 | −6,42 | 0,4044 | −0,0146 | |||
| DTE / DTE Energy Company | 1,15 | −1,03 | 156,64 | 1,15 | 0,3727 | 0,0155 | |||
| BDX / Becton, Dickinson and Company | 0,90 | −1,03 | 154,96 | −24,26 | 0,3687 | −0,1033 | |||
| WELL / Welltower Inc. | 0,84 | 129,29 | 0,3076 | 0,3076 |