Grundläggande statistik
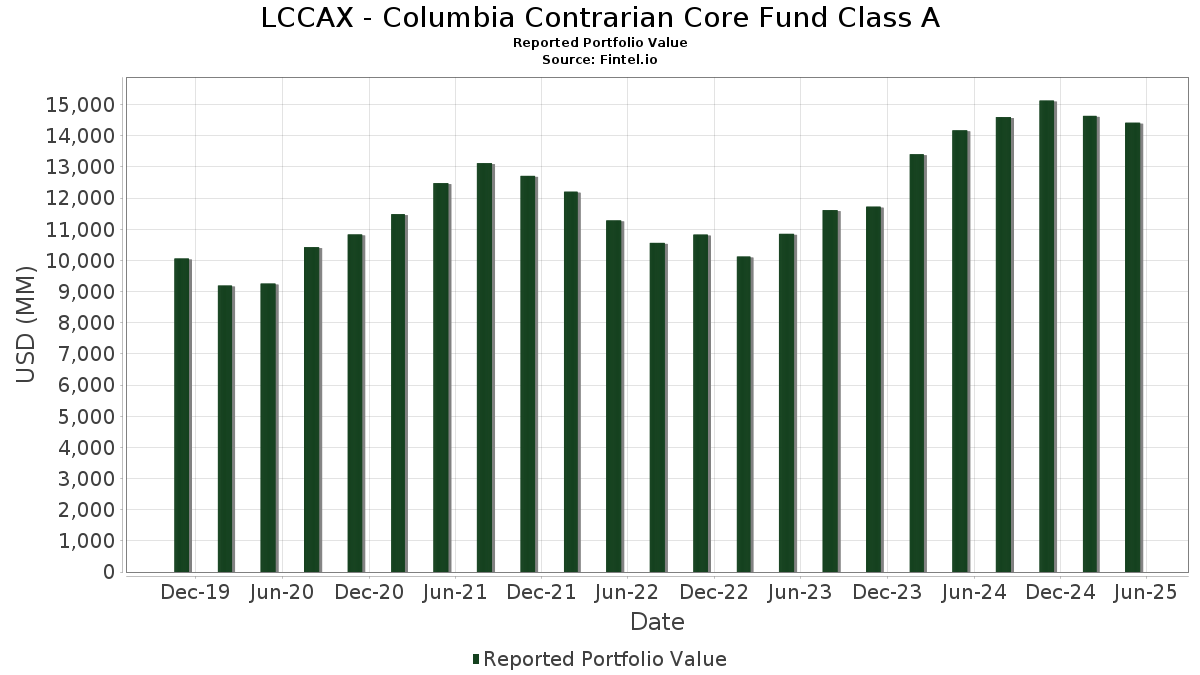
| Portföljvärde | $ 14 420 010 865 |
| Aktuella positioner | 79 |
Senaste innehav, resultat, förvaltat kapital (från 13F, 13D)
LCCAX - Columbia Contrarian Core Fund Class A har redovisat 79 totala innehav i sina senaste SEC-arkiveringar. Det senaste portföljvärdet beräknas vara $ 14 420 010 865 USD. Faktiskt förvaltade tillgångar (AUM) är detta värde plus likvida medel (som inte redovisas). LCCAX - Columbia Contrarian Core Fund Class As största innehav är Microsoft Corporation (US:MSFT) , NVIDIA Corporation (US:NVDA) , Apple Inc. (US:AAPL) , Amazon.com, Inc. (US:AMZN) , and Meta Platforms, Inc. (US:META) . LCCAX - Columbia Contrarian Core Fund Class As nya positioner inkluderar Synopsys, Inc. (US:SNPS) , ConocoPhillips (US:COP) , Eaton Corporation plc (IT:1ETN) , Lockheed Martin Corporation (US:LMT) , and Henry Schein, Inc. (US:HSIC) .
Största ökningarna detta kvartal
Vi använder förändringen i portföljallokeringen eftersom det är det mest meningsfulla måttet. Förändringar kan bero på transaktioner eller förändringar i aktiekurser.
| Värdepapper | Aktier (MM) |
Värde (MM$) |
Portfölj % av | ΔPortfölj % av |
|---|---|---|---|---|
| 1,17 | 284,04 | 1,9680 | 1,9680 | |
| 2,67 | 1 230,64 | 8,5264 | 1,4938 | |
| 0,26 | 121,26 | 0,8401 | 0,8401 | |
| 1,38 | 117,60 | 0,8148 | 0,8148 | |
| 7,81 | 1 055,30 | 7,3116 | 0,7809 | |
| 0,29 | 218,99 | 1,5173 | 0,6897 | |
| 1,81 | 190,30 | 1,3185 | 0,6495 | |
| 0,29 | 91,99 | 0,6373 | 0,6373 | |
| 0,18 | 85,07 | 0,5894 | 0,5894 | |
| 1,00 | 76,34 | 0,5289 | 0,5289 |
Största minskningarna detta kvartal
Vi använder förändringen i portföljallokeringen eftersom det är det mest meningsfulla måttet. Förändringar kan bero på transaktioner eller förändringar i aktiepriser.
| Värdepapper | Aktier (MM) |
Värde (MM$) |
Portfölj % av | ΔPortfölj % av |
|---|---|---|---|---|
| 3,67 | 736,66 | 5,1040 | −1,2735 | |
| 0,68 | 153,10 | 1,0607 | −0,5739 | |
| 0,39 | 73,12 | 0,5066 | −0,5337 | |
| 0,25 | 101,15 | 0,7008 | −0,5191 | |
| 248,96 | 248,88 | 1,7244 | −0,4671 | |
| 0,31 | 129,36 | 0,8962 | −0,4444 | |
| 2,97 | 608,31 | 4,2147 | −0,4241 | |
| 0,83 | 188,78 | 1,3080 | −0,3559 | |
| 1,26 | 168,48 | 1,1673 | −0,3491 | |
| 0,36 | 263,67 | 1,8268 | −0,3488 |
13F- och fond arkiveringar
Denna blankett lämnades in den 2025-07-25 för rapporteringsperioden 2025-05-31. Klicka på länksymbolen för att se hela transaktionshistoriken.
Uppgradera för att låsa upp premiumdata och exportera till Excel![]() .
.
| Värdepapper | Typ | Genomsnittligt aktiepris | Aktier (MM) |
ΔAktier (%) |
ΔAktier (%) |
Värde ($MM) |
Portfölj (%) |
ΔPortfölj (%) |
|
|---|---|---|---|---|---|---|---|---|---|
| MSFT / Microsoft Corporation | 2,67 | 2,99 | 1 230,64 | 19,42 | 8,5264 | 1,4938 | |||
| NVDA / NVIDIA Corporation | 7,81 | 1,95 | 1 055,30 | 10,28 | 7,3116 | 0,7809 | |||
| AAPL / Apple Inc. | 3,67 | −5,08 | 736,66 | −21,17 | 5,1040 | −1,2735 | |||
| AMZN / Amazon.com, Inc. | 2,97 | −7,33 | 608,31 | −10,50 | 4,2147 | −0,4241 | |||
| META / Meta Platforms, Inc. | 0,72 | 1,85 | 469,38 | −1,31 | 3,2521 | 0,0063 | |||
| JPM / JPMorgan Chase & Co. | 1,23 | 0,66 | 323,84 | 0,41 | 2,2437 | 0,0427 | |||
| GOOGL / Alphabet Inc. | 1,84 | 3,42 | 315,34 | 4,30 | 2,1848 | 0,1215 | |||
| BAC / Bank of America Corporation | 6,48 | 39,96 | 285,77 | 33,98 | 1,9799 | 0,5243 | |||
| AVGO / Broadcom Inc. | 1,17 | 284,04 | 1,9680 | 1,9680 | |||||
| EBAY / eBay Inc. | 3,78 | −14,66 | 276,23 | −3,55 | 1,9138 | −0,0408 | |||
| LLY / Eli Lilly and Company | 0,36 | 3,23 | 263,67 | −17,29 | 1,8268 | −0,3488 | |||
| GOOG / Alphabet Inc. | 1,49 | −11,60 | 258,30 | −11,27 | 1,7896 | −0,1972 | |||
| 19766H239 / COLUMBIA SHORT TERM CASH FUND | 248,96 | −22,48 | 248,88 | −22,49 | 1,7244 | −0,4671 | |||
| BA / The Boeing Company | 1,12 | 0,00 | 232,61 | 18,72 | 1,6116 | 0,2745 | |||
| BLK / BlackRock, Inc. | 0,23 | −7,64 | 226,91 | −7,44 | 1,5721 | −0,1009 | |||
| V / Visa Inc. | 0,62 | 0,00 | 225,00 | 0,68 | 1,5589 | 0,0338 | |||
| INTU / Intuit Inc. | 0,29 | 47,12 | 218,99 | 80,59 | 1,5173 | 0,6897 | |||
| PG / The Procter & Gamble Company | 1,22 | 32,16 | 206,76 | 29,15 | 1,4325 | 0,3400 | |||
| WFC / Wells Fargo & Company | 2,73 | −1,96 | 203,90 | −6,39 | 1,4127 | −0,0738 | |||
| CVX / Chevron Corporation | 1,46 | −7,87 | 199,04 | −20,60 | 1,3790 | −0,3318 | |||
| SCHW / The Charles Schwab Corporation | 2,22 | −8,50 | 196,40 | 1,64 | 1,3608 | 0,0420 | |||
| BSX / Boston Scientific Corporation | 1,81 | 91,42 | 190,30 | 94,13 | 1,3185 | 0,6495 | |||
| TTWO / Take-Two Interactive Software, Inc. | 0,83 | −27,46 | 188,78 | −22,57 | 1,3080 | −0,3559 | |||
| TMUS / T-Mobile US, Inc. | 0,76 | 0,00 | 183,32 | −10,19 | 1,2701 | −0,1230 | |||
| UBER / Uber Technologies, Inc. | 2,17 | 4,30 | 182,37 | 15,49 | 1,2636 | 0,1858 | |||
| WMT / Walmart Inc. | 1,84 | 42,29 | 181,78 | 42,45 | 1,2595 | 0,3886 | |||
| TSLA / Tesla, Inc. | 0,52 | −18,19 | 178,98 | −3,25 | 1,2401 | −0,0225 | |||
| ELV / Elevance Health, Inc. | 0,46 | −16,97 | 176,40 | −19,70 | 1,2222 | −0,2771 | |||
| DIS / The Walt Disney Company | 1,54 | 5,49 | 174,47 | 4,79 | 1,2088 | 0,0725 | |||
| VRTX / Vertex Pharmaceuticals Incorporated | 0,39 | 3,27 | 173,26 | −4,86 | 1,2004 | −0,0424 | |||
| MA / Mastercard Incorporated | 0,29 | 0,00 | 169,68 | 1,61 | 1,1756 | 0,0360 | |||
| ABT / Abbott Laboratories | 1,26 | −21,66 | 168,48 | −24,17 | 1,1673 | −0,3491 | |||
| UNP / Union Pacific Corporation | 0,75 | 7,40 | 165,63 | −3,50 | 1,1475 | −0,0238 | |||
| AON / Aon plc | 0,41 | 17,13 | 153,43 | 6,53 | 1,0630 | 0,0801 | |||
| HON / Honeywell International Inc. | 0,68 | −39,97 | 153,10 | −36,08 | 1,0607 | −0,5739 | |||
| RTX / RTX Corporation | 1,03 | 58,36 | 140,61 | 62,51 | 0,9742 | 0,3837 | |||
| AXP / American Express Company | 0,47 | −12,63 | 137,84 | −14,64 | 0,9550 | −0,1470 | |||
| PEG / Public Service Enterprise Group Incorporated | 1,70 | 1,07 | 137,81 | 0,92 | 0,9548 | 0,0229 | |||
| DTE / DTE Energy Company | 1,00 | −6,55 | 135,97 | −4,49 | 0,9420 | −0,0295 | |||
| TEL / TE Connectivity plc | 0,81 | −27,87 | 130,10 | −25,04 | 0,9014 | −0,2831 | |||
| AMT / American Tower Corporation | 0,60 | 0,00 | 129,50 | 4,39 | 0,8973 | 0,0506 | |||
| ADBE / Adobe Inc. | 0,31 | −30,43 | 129,36 | −34,15 | 0,8962 | −0,4444 | |||
| EOG / EOG Resources, Inc. | 1,19 | 5,31 | 128,71 | −9,93 | 0,8918 | −0,0835 | |||
| XYZ / Block, Inc. | 2,05 | 13,45 | 126,80 | 7,29 | 0,8785 | 0,0719 | |||
| SNPS / Synopsys, Inc. | 0,26 | 121,26 | 0,8401 | 0,8401 | |||||
| SPGI / S&P Global Inc. | 0,24 | 21,72 | 120,83 | 16,96 | 0,8372 | 0,1321 | |||
| DELL / Dell Technologies Inc. | 1,07 | 12,63 | 119,39 | 21,96 | 0,8272 | 0,1591 | |||
| COP / ConocoPhillips | 1,38 | 117,60 | 0,8148 | 0,8148 | |||||
| LRCX / Lam Research Corporation | 1,44 | −17,84 | 116,16 | −13,50 | 0,8048 | −0,1117 | |||
| ZBH / Zimmer Biomet Holdings, Inc. | 1,25 | −18,16 | 114,81 | −27,69 | 0,7954 | −0,2881 | |||
| EA / Electronic Arts Inc. | 0,75 | −23,01 | 108,40 | −14,26 | 0,7511 | −0,1118 | |||
| ACN / Accenture plc | 0,34 | 14,87 | 106,72 | 4,42 | 0,7394 | 0,0419 | |||
| PINS / Pinterest, Inc. | 3,37 | −14,80 | 104,98 | −28,33 | 0,7273 | −0,2723 | |||
| TMO / Thermo Fisher Scientific Inc. | 0,25 | −25,69 | 101,15 | −43,41 | 0,7008 | −0,5191 | |||
| ON / ON Semiconductor Corporation | 2,22 | 0,00 | 93,20 | −10,69 | 0,6457 | −0,0665 | |||
| 1ETN / Eaton Corporation plc | 0,29 | 91,99 | 0,6373 | 0,6373 | |||||
| GEV / GE Vernova Inc. | 0,19 | 161,29 | 89,43 | 268,72 | 0,6196 | 0,4541 | |||
| GE / General Electric Company | 0,36 | 21,18 | 89,31 | 43,97 | 0,6188 | 0,1954 | |||
| LMT / Lockheed Martin Corporation | 0,18 | 85,07 | 0,5894 | 0,5894 | |||||
| MS / Morgan Stanley | 0,60 | 21,86 | 77,18 | 71,94 | 0,5347 | 0,1674 | |||
| IFF / International Flavors & Fragrances Inc. | 1,00 | 76,34 | 0,5289 | 0,5289 | |||||
| BMRN / BioMarin Pharmaceutical Inc. | 1,30 | −1,68 | 75,69 | −19,76 | 0,5244 | −0,1194 | |||
| HSIC / Henry Schein, Inc. | 1,06 | 74,28 | 0,5146 | 0,5146 | |||||
| ABBV / AbbVie Inc. | 0,39 | −46,12 | 73,12 | −52,03 | 0,5066 | −0,5337 | |||
| J / Jacobs Solutions Inc. | 0,57 | 71,69 | 0,4967 | 0,4967 | |||||
| OKTA / Okta, Inc. | 0,68 | −30,45 | 70,32 | −20,71 | 0,4872 | −0,1180 | |||
| AMAT / Applied Materials, Inc. | 0,43 | 0,00 | 68,03 | −0,84 | 0,4713 | 0,0032 | |||
| PANW / Palo Alto Networks, Inc. | 0,35 | −18,79 | 67,40 | −17,94 | 0,4670 | −0,0936 | |||
| LULU / lululemon athletica inc. | 0,20 | 25,21 | 64,17 | 8,45 | 0,4446 | 0,0408 | |||
| CDW / CDW Corporation | 0,36 | 0,75 | 64,16 | 1,98 | 0,4445 | 0,0151 | |||
| TPR / Tapestry, Inc. | 0,70 | −39,17 | 55,06 | −44,07 | 0,3814 | −0,2903 | |||
| COO / The Cooper Companies, Inc. | 0,80 | 54,96 | 0,3808 | 0,3808 | |||||
| PH / Parker-Hannifin Corporation | 0,07 | 13,79 | 49,65 | 13,14 | 0,3440 | 0,0445 | |||
| CSGP / CoStar Group, Inc. | 0,63 | 26,30 | 46,30 | 21,85 | 0,3208 | 0,0615 | |||
| SHW / The Sherwin-Williams Company | 0,13 | 0,00 | 45,21 | −0,96 | 0,3132 | 0,0017 | |||
| COTY / Coty Inc. | 8,53 | −13,18 | 42,07 | −24,78 | 0,2915 | −0,0902 | |||
| AMGN / Amgen Inc. | 0,11 | 31,20 | 0,2162 | 0,2162 | |||||
| NKE / NIKE, Inc. | 0,49 | 0,00 | 29,51 | −23,72 | 0,2045 | −0,0596 | |||
| AMTM / Amentum Holdings, Inc. | 0,03 | 0,71 | 0,0049 | 0,0049 | |||||
| AMD / Advanced Micro Devices, Inc. | 0,00 | −100,00 | 0,00 | −100,00 | −0,3185 | ||||
| IR / Ingersoll Rand Inc. | 0,00 | −100,00 | 0,00 | −100,00 | −0,3051 |