Grundläggande statistik
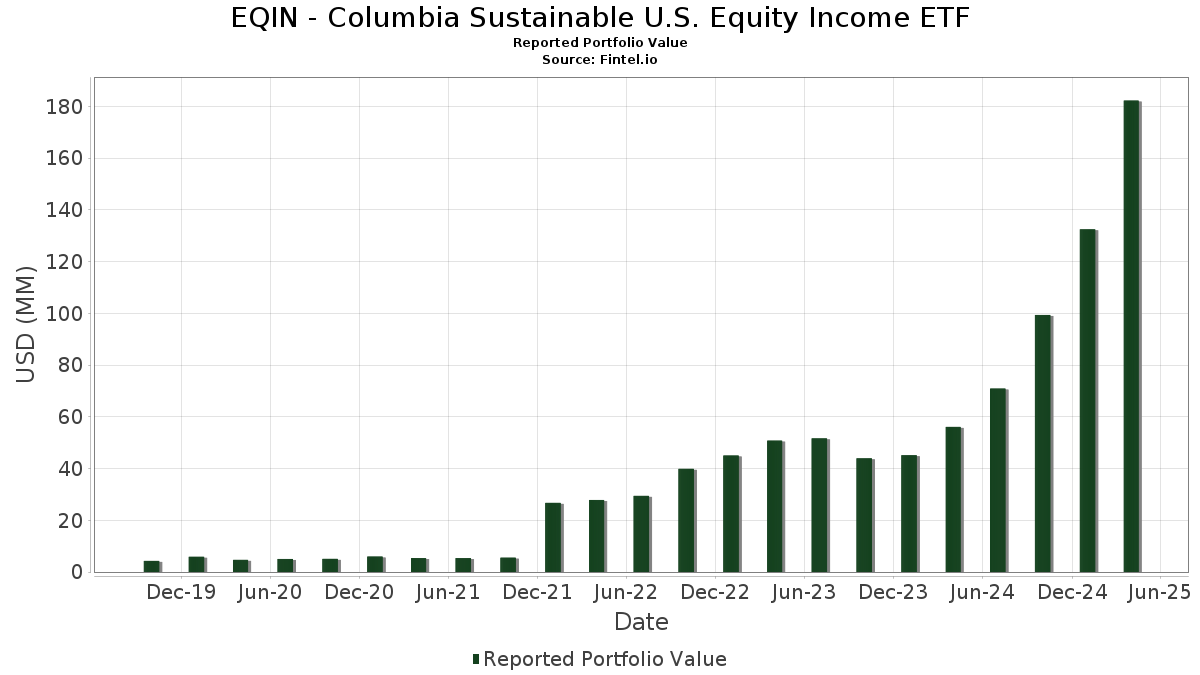
| Portföljvärde | $ 182 283 786 |
| Aktuella positioner | 101 |
Senaste innehav, resultat, förvaltat kapital (från 13F, 13D)
EQIN - Columbia Sustainable U.S. Equity Income ETF har redovisat 101 totala innehav i sina senaste SEC-arkiveringar. Det senaste portföljvärdet beräknas vara $ 182 283 786 USD. Faktiskt förvaltade tillgångar (AUM) är detta värde plus likvida medel (som inte redovisas). EQIN - Columbia Sustainable U.S. Equity Income ETFs största innehav är The Coca-Cola Company (US:KO) , Exxon Mobil Corporation (US:XOM) , The Home Depot, Inc. (US:HD) , Chevron Corporation (US:CVX) , and UnitedHealth Group Incorporated (US:UNH) . EQIN - Columbia Sustainable U.S. Equity Income ETFs nya positioner inkluderar D.R. Horton, Inc. (US:DHI) , Cboe Global Markets, Inc. (US:CBOE) , .
Största ökningarna detta kvartal
Vi använder förändringen i portföljallokeringen eftersom det är det mest meningsfulla måttet. Förändringar kan bero på transaktioner eller förändringar i aktiekurser.
| Värdepapper | Aktier (MM) |
Värde (MM$) |
Portfölj % av | ΔPortfölj % av |
|---|---|---|---|---|
| 0,02 | 3,68 | 2,0149 | 1,4054 | |
| 0,12 | 9,06 | 4,9618 | 1,0559 | |
| 0,21 | 5,80 | 3,1760 | 0,7316 | |
| 0,12 | 5,41 | 2,9663 | 0,5805 | |
| 0,08 | 8,33 | 4,5633 | 0,5717 | |
| 0,01 | 1,03 | 0,5620 | 0,5620 | |
| 0,91 | 0,91 | 0,4963 | 0,4963 | |
| 0,01 | 2,91 | 1,5919 | 0,3693 | |
| 0,00 | 0,67 | 0,3650 | 0,3650 | |
| 0,01 | 1,85 | 1,0126 | 0,3200 |
Största minskningarna detta kvartal
Vi använder förändringen i portföljallokeringen eftersom det är det mest meningsfulla måttet. Förändringar kan bero på transaktioner eller förändringar i aktiepriser.
| Värdepapper | Aktier (MM) |
Värde (MM$) |
Portfölj % av | ΔPortfölj % av |
|---|---|---|---|---|
| 0,00 | 0,00 | −6,0037 | ||
| 0,02 | 5,45 | 2,9850 | −0,4683 | |
| 0,02 | 0,71 | 0,3876 | −0,3654 | |
| 0,00 | 0,55 | 0,2998 | −0,2782 | |
| 0,02 | 7,77 | 4,2578 | −0,2545 | |
| 0,02 | 7,13 | 3,9068 | −0,2295 | |
| 0,01 | 4,31 | 2,3604 | −0,2164 | |
| 0,01 | 1,29 | 0,7071 | −0,2052 | |
| 0,00 | 0,00 | −0,1639 | ||
| 0,03 | 4,79 | 2,6248 | −0,1386 |
13F- och fond arkiveringar
Denna blankett lämnades in den 2025-06-25 för rapporteringsperioden 2025-04-30. Klicka på länksymbolen för att se hela transaktionshistoriken.
Uppgradera för att låsa upp premiumdata och exportera till Excel![]() .
.
| Värdepapper | Typ | Genomsnittligt aktiepris | Aktier (MM) |
ΔAktier (%) |
ΔAktier (%) |
Värde ($MM) |
Portfölj (%) |
ΔPortfölj (%) |
|
|---|---|---|---|---|---|---|---|---|---|
| KO / The Coca-Cola Company | 0,12 | 52,90 | 9,06 | 74,76 | 4,9618 | 1,0559 | |||
| XOM / Exxon Mobil Corporation | 0,08 | 59,05 | 8,33 | 57,27 | 4,5633 | 0,5717 | |||
| HD / The Home Depot, Inc. | 0,02 | 48,35 | 7,77 | 29,80 | 4,2578 | −0,2545 | |||
| CVX / Chevron Corporation | 0,05 | 52,85 | 7,14 | 39,40 | 3,9097 | 0,0515 | |||
| UNH / UnitedHealth Group Incorporated | 0,02 | 71,32 | 7,13 | 29,94 | 3,9068 | −0,2295 | |||
| IBM / International Business Machines Corporation | 0,03 | 52,90 | 6,52 | 44,62 | 3,5743 | 0,1739 | |||
| T / AT&T Inc. | 0,21 | 53,12 | 5,80 | 78,75 | 3,1760 | 0,7316 | |||
| ACN / Accenture plc | 0,02 | 53,01 | 5,45 | 18,90 | 2,9850 | −0,4683 | |||
| VZ / Verizon Communications Inc. | 0,12 | 52,91 | 5,41 | 71,06 | 2,9663 | 0,5805 | |||
| PEP / PepsiCo, Inc. | 0,04 | 52,83 | 5,41 | 37,51 | 2,9650 | −0,0012 | |||
| QCOM / QUALCOMM Incorporated | 0,03 | 52,20 | 4,79 | 30,69 | 2,6248 | −0,1386 | |||
| CAT / Caterpillar Inc. | 0,01 | 51,34 | 4,31 | 26,00 | 2,3604 | −0,2164 | |||
| CMCSA / Comcast Corporation | 0,11 | 51,04 | 3,74 | 53,49 | 2,0487 | 0,2123 | |||
| LOW / Lowe's Companies, Inc. | 0,02 | 1 653,84 | 3,68 | 1 954,19 | 2,0149 | 1,4054 | |||
| SCHW / The Charles Schwab Corporation | 0,04 | 38,12 | 3,60 | 35,94 | 1,9709 | −0,0238 | |||
| ADP / Automatic Data Processing, Inc. | 0,01 | 52,57 | 3,56 | 51,40 | 1,9528 | 0,1780 | |||
| DE / Deere & Company | 0,01 | 52,23 | 3,42 | 48,09 | 1,8712 | 0,1329 | |||
| COP / ConocoPhillips | 0,04 | 68,72 | 3,30 | 52,17 | 1,8094 | 0,1734 | |||
| LMT / Lockheed Martin Corporation | 0,01 | 51,87 | 3,28 | 56,78 | 1,7987 | 0,2199 | |||
| MMC / Marsh & McLennan Companies, Inc. | 0,01 | 52,91 | 3,23 | 59,01 | 1,7704 | 0,2383 | |||
| CME / CME Group Inc. | 0,01 | 52,89 | 2,91 | 79,10 | 1,5919 | 0,3693 | |||
| ADI / Analog Devices, Inc. | 0,01 | 52,74 | 2,82 | 40,47 | 1,5427 | 0,0323 | |||
| ICE / Intercontinental Exchange, Inc. | 0,02 | 53,01 | 2,80 | 60,82 | 1,5316 | 0,2213 | |||
| MDLZ / Mondelez International, Inc. | 0,04 | 47,98 | 2,57 | 73,85 | 1,4059 | 0,2935 | |||
| TT / Trane Technologies plc | 0,01 | 189,06 | 2,50 | 231,70 | 1,3707 | 0,3073 | |||
| GD / General Dynamics Corporation | 0,01 | 50,41 | 2,14 | 59,28 | 1,1703 | 0,1595 | |||
| WMB / The Williams Companies, Inc. | 0,04 | 52,89 | 2,08 | 61,60 | 1,1373 | 0,1689 | |||
| NOC / Northrop Grumman Corporation | 0,00 | 51,71 | 2,05 | 51,44 | 1,1229 | 0,1031 | |||
| PNC / The PNC Financial Services Group, Inc. | 0,01 | 5 651,00 | 1,85 | 4 894,59 | 1,0126 | 0,3200 | |||
| AEP / American Electric Power Company, Inc. | 0,02 | 52,74 | 1,68 | 68,27 | 0,9214 | 0,1680 | |||
| BK / The Bank of New York Mellon Corporation | 0,02 | 50,91 | 1,68 | 41,18 | 0,9207 | 0,0238 | |||
| AFL / Aflac Incorporated | 0,01 | 52,83 | 1,58 | 54,69 | 0,8683 | 0,0961 | |||
| AIG / American International Group, Inc. | 0,02 | 45,47 | 1,41 | 60,91 | 0,7718 | 0,1123 | |||
| EXC / Exelon Corporation | 0,03 | 217,25 | 1,37 | 282,73 | 0,7528 | −0,0648 | |||
| SRE / Sempra | 0,02 | 52,80 | 1,37 | 36,93 | 0,7519 | −0,0039 | |||
| NXPI / NXP Semiconductors N.V. | 0,01 | 52,68 | 1,36 | 34,92 | 0,7477 | −0,0146 | |||
| VFH / Vanguard World Fund - Vanguard Financials ETF | 0,01 | 47,02 | 1,36 | 36,40 | 0,7473 | −0,0069 | |||
| SLB / Schlumberger Limited | 0,04 | 51,70 | 1,36 | 25,18 | 0,7438 | −0,0733 | |||
| TGT / Target Corporation | 0,01 | 52,06 | 1,29 | 6,61 | 0,7071 | −0,2052 | |||
| PSX / Phillips 66 | 0,01 | 52,80 | 1,25 | 34,95 | 0,6854 | −0,0136 | |||
| XEL / Xcel Energy Inc. | 0,02 | 47,54 | 1,18 | 55,19 | 0,6475 | 0,0737 | |||
| PEG / Public Service Enterprise Group Incorporated | 0,01 | 52,84 | 1,16 | 46,22 | 0,6361 | 0,0377 | |||
| CMI / Cummins Inc. | 0,00 | 53,16 | 1,16 | 26,25 | 0,6354 | −0,0565 | |||
| ED / Consolidated Edison, Inc. | 0,01 | 52,79 | 1,14 | 83,68 | 0,6233 | 0,1567 | |||
| KDP / Keurig Dr Pepper Inc. | 0,03 | 52,44 | 1,13 | 64,20 | 0,6212 | 0,1010 | |||
| OTIS / Otis Worldwide Corporation | 0,01 | 51,80 | 1,11 | 53,09 | 0,6102 | 0,0621 | |||
| OXY / Occidental Petroleum Corporation | 0,03 | 52,91 | 1,08 | 29,17 | 0,5899 | −0,0383 | |||
| CTSH / Cognizant Technology Solutions Corporation | 0,01 | 52,01 | 1,06 | 35,38 | 0,5790 | −0,0094 | |||
| ETR / Entergy Corporation | 0,01 | 53,30 | 1,04 | 57,25 | 0,5708 | 0,0715 | |||
| HIG / The Hartford Insurance Group, Inc. | 0,01 | 52,99 | 1,04 | 68,29 | 0,5674 | 0,1035 | |||
| DHI / D.R. Horton, Inc. | 0,01 | 1,03 | 0,5620 | 0,5620 | |||||
| WEC / WEC Energy Group, Inc. | 0,01 | 53,36 | 1,01 | 69,40 | 0,5553 | 0,1039 | |||
| CAH / Cardinal Health, Inc. | 0,01 | 52,65 | 0,99 | 74,39 | 0,5447 | 0,1151 | |||
| GIS / General Mills, Inc. | 0,02 | 51,85 | 0,91 | 43,15 | 0,4985 | 0,0198 | |||
| GOLDMAN FINL SQ TRSRY INST 506 / STIV (000000000) | 0,91 | 0,91 | 0,4963 | 0,4963 | |||||
| WTW / Willis Towers Watson Public Limited Company | 0,00 | 52,82 | 0,90 | 42,72 | 0,4943 | 0,0179 | |||
| DTE / DTE Energy Company | 0,01 | 53,03 | 0,83 | 75,00 | 0,4529 | 0,0967 | |||
| BR / Broadridge Financial Solutions, Inc. | 0,00 | 52,71 | 0,82 | 55,60 | 0,4494 | 0,0515 | |||
| TSCO / Tractor Supply Company | 0,02 | 52,78 | 0,79 | 42,31 | 0,4312 | 0,0143 | |||
| AEE / Ameren Corporation | 0,01 | 54,60 | 0,78 | 62,97 | 0,4269 | 0,0663 | |||
| STZ / Constellation Brands, Inc. | 0,00 | 39,63 | 0,76 | 44,85 | 0,4163 | 0,0209 | |||
| ATO / Atmos Energy Corporation | 0,00 | 56,02 | 0,74 | 76,01 | 0,4061 | 0,0884 | |||
| STT / State Street Corporation | 0,01 | 50,55 | 0,74 | 30,62 | 0,4045 | −0,0218 | |||
| RJF / Raymond James Financial, Inc. | 0,01 | 54,08 | 0,74 | 25,34 | 0,4041 | −0,0395 | |||
| LEN / Lennar Corporation | 0,01 | 49,25 | 0,72 | 23,46 | 0,3953 | −0,0450 | |||
| K / Kellanova | 0,01 | 53,52 | 0,71 | 55,48 | 0,3885 | 0,0448 | |||
| MCHP / Microchip Technology Incorporated | 0,02 | 235,80 | 0,71 | 68,33 | 0,3876 | −0,3654 | |||
| IP / International Paper Company | 0,02 | 130,87 | 0,69 | 89,81 | 0,3777 | 0,1036 | |||
| CBOE / Cboe Global Markets, Inc. | 0,00 | 0,67 | 0,3650 | 0,3650 | |||||
| ES / Eversource Energy | 0,01 | 53,03 | 0,64 | 57,96 | 0,3480 | 0,0446 | |||
| CDW / CDW Corporation | 0,00 | 52,68 | 0,62 | 23,17 | 0,3409 | −0,0400 | |||
| HPE / Hewlett Packard Enterprise Company | 0,04 | 54,45 | 0,62 | 18,16 | 0,3388 | −0,0554 | |||
| EIX / Edison International | 0,01 | 52,95 | 0,60 | 51,76 | 0,3312 | 0,0306 | |||
| DGX / Quest Diagnostics Incorporated | 0,00 | 53,28 | 0,58 | 67,83 | 0,3174 | 0,0567 | |||
| HUBB / Hubbell Incorporated | 0,00 | 53,47 | 0,57 | 31,94 | 0,3124 | −0,0137 | |||
| LDOS / Leidos Holdings, Inc. | 0,00 | 133,54 | 0,55 | 221,76 | 0,2998 | −0,2782 | |||
| NI / NiSource Inc. | 0,01 | 53,78 | 0,53 | 61,33 | 0,2931 | 0,0430 | |||
| WSM / Williams-Sonoma, Inc. | 0,00 | 48,79 | 0,53 | 8,78 | 0,2924 | −0,0775 | |||
| HAL / Halliburton Company | 0,03 | 51,12 | 0,50 | 15,21 | 0,2742 | −0,0535 | |||
| PFG / Principal Financial Group, Inc. | 0,01 | 52,83 | 0,49 | 37,82 | 0,2696 | −0,0002 | |||
| SNA / Snap-on Incorporated | 0,00 | 52,85 | 0,47 | 35,34 | 0,2581 | −0,0048 | |||
| EVRG / Evergy, Inc. | 0,01 | 53,49 | 0,46 | 65,58 | 0,2507 | 0,0420 | |||
| LNT / Alliant Energy Corporation | 0,01 | 52,91 | 0,46 | 58,89 | 0,2499 | 0,0330 | |||
| EXPD / Expeditors International of Washington, Inc. | 0,00 | 52,58 | 0,45 | 47,84 | 0,2439 | 0,0167 | |||
| PNR / Pentair plc | 0,00 | 0,43 | 0,2347 | 0,2347 | |||||
| AVY / Avery Dennison Corporation | 0,00 | 53,41 | 0,40 | 41,43 | 0,2173 | 0,0058 | |||
| IEX / IDEX Corporation | 0,00 | 52,42 | 0,38 | 18,27 | 0,2098 | −0,0343 | |||
| BBY / Best Buy Co., Inc. | 0,01 | 52,03 | 0,38 | 17,90 | 0,2097 | −0,0346 | |||
| MAS / Masco Corporation | 0,01 | 187,44 | 0,37 | 278,35 | 0,2014 | −0,0432 | |||
| OC / Owens Corning | 0,00 | 53,30 | 0,36 | 20,74 | 0,1982 | −0,0275 | |||
| ALLE / Allegion plc | 0,00 | 51,84 | 0,35 | 59,36 | 0,1916 | 0,0261 | |||
| CCK / Crown Holdings, Inc. | 0,00 | 52,65 | 0,33 | 67,68 | 0,1824 | 0,0325 | |||
| CHRW / C.H. Robinson Worldwide, Inc. | 0,00 | 53,64 | 0,31 | 38,29 | 0,1683 | 0,0003 | |||
| DKS / DICK'S Sporting Goods, Inc. | 0,00 | 52,40 | 0,30 | 19,22 | 0,1666 | −0,0257 | |||
| SWKS / Skyworks Solutions, Inc. | 0,00 | 53,69 | 0,30 | 11,11 | 0,1648 | −0,0389 | |||
| TAP / Molson Coors Beverage Company | 0,00 | 50,23 | 0,28 | 58,19 | 0,1538 | 0,0198 | |||
| CNH / CNH Industrial N.V. | 0,02 | 52,55 | 0,27 | 37,19 | 0,1498 | −0,0006 | |||
| OVV / Ovintiv Inc. | 0,01 | 52,81 | 0,25 | 21,63 | 0,1391 | −0,0183 | |||
| AOS / A. O. Smith Corporation | 0,00 | 50,04 | 0,23 | 51,66 | 0,1257 | 0,0114 | |||
| FBHS / Fortune Brands Home & Security Inc | 0,00 | 52,82 | 0,19 | 14,79 | 0,1063 | −0,0211 | |||
| FOX / Fox Corporation | 0,00 | 0,17 | 0,0959 | 0,0959 | |||||
| AVGO / Broadcom Inc. | 0,00 | −100,00 | 0,00 | −100,00 | −6,0037 | ||||
| EG / Everest Group, Ltd. | 0,00 | −100,00 | 0,00 | −100,00 | −0,1639 |