Grundläggande statistik
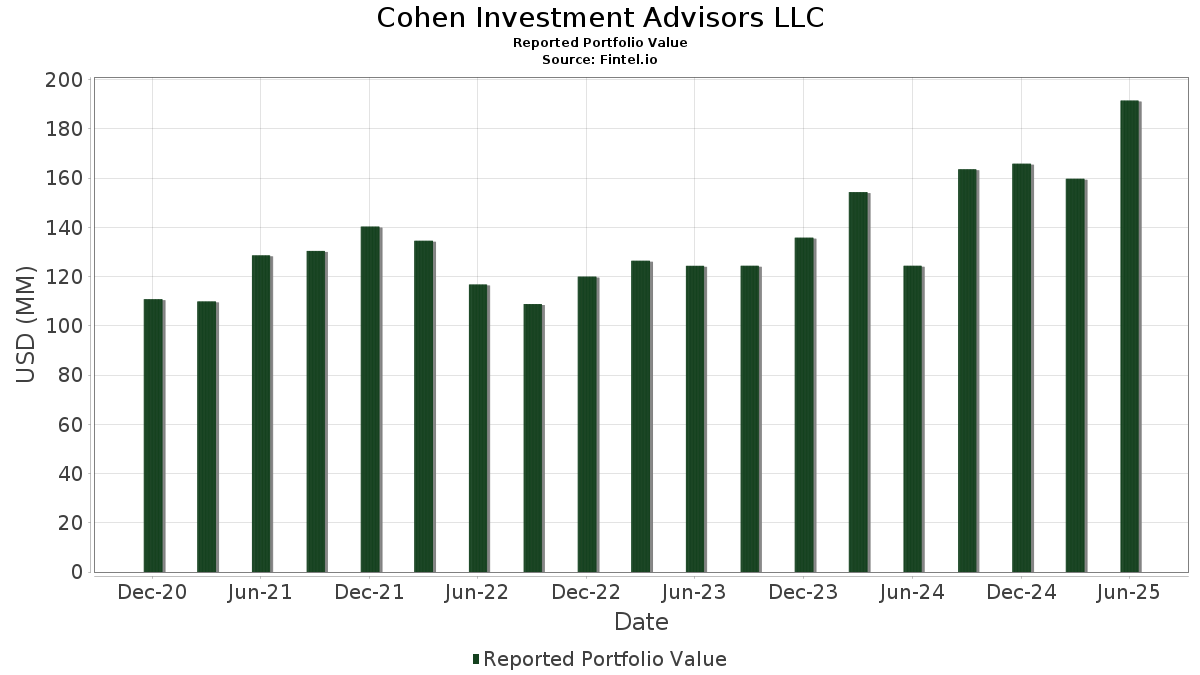
| Portföljvärde | $ 191 500 051 |
| Aktuella positioner | 80 |
Senaste innehav, resultat, förvaltat kapital (från 13F, 13D)
Cohen Investment Advisors LLC har redovisat 80 totala innehav i sina senaste SEC-arkiveringar. Det senaste portföljvärdet beräknas vara $ 191 500 051 USD. Faktiskt förvaltade tillgångar (AUM) är detta värde plus likvida medel (som inte redovisas). Cohen Investment Advisors LLCs största innehav är Microsoft Corporation (US:MSFT) , Apple Inc. (US:AAPL) , Eli Lilly and Company (US:LLY) , Amazon.com, Inc. (US:AMZN) , and Meta Platforms, Inc. (US:META) . Cohen Investment Advisors LLCs nya positioner inkluderar CrowdStrike Holdings, Inc. (US:CRWD) , Palantir Technologies Inc. (US:PLTR) , .
Största ökningarna detta kvartal
Vi använder förändringen i portföljallokeringen eftersom det är det mest meningsfulla måttet. Förändringar kan bero på transaktioner eller förändringar i aktiekurser.
| Värdepapper | Aktier (MM) |
Värde (MM$) |
Portfölj % av | ΔPortfölj % av |
|---|---|---|---|---|
| 0,03 | 4,50 | 2,3473 | 1,2682 | |
| 0,02 | 9,01 | 4,7024 | 0,7938 | |
| 0,01 | 7,66 | 3,9980 | 0,6021 | |
| 0,01 | 6,04 | 3,1525 | 0,5028 | |
| 0,01 | 5,32 | 2,7779 | 0,4115 | |
| 0,00 | 4,75 | 2,4819 | 0,3887 | |
| 0,08 | 3,40 | 1,7761 | 0,3451 | |
| 0,00 | 0,59 | 0,3072 | 0,3072 | |
| 0,03 | 3,12 | 1,6268 | 0,2825 | |
| 0,02 | 6,56 | 3,4232 | 0,2583 |
Största minskningarna detta kvartal
Vi använder förändringen i portföljallokeringen eftersom det är det mest meningsfulla måttet. Förändringar kan bero på transaktioner eller förändringar i aktiepriser.
| Värdepapper | Aktier (MM) |
Värde (MM$) |
Portfölj % av | ΔPortfölj % av |
|---|---|---|---|---|
| 0,04 | 8,95 | 4,6737 | −1,0952 | |
| 0,01 | 8,47 | 4,4232 | −0,7095 | |
| 0,03 | 3,72 | 1,9424 | −0,3428 | |
| 0,02 | 3,49 | 1,8232 | −0,3077 | |
| 0,01 | 3,18 | 1,6592 | −0,3053 | |
| 0,01 | 2,70 | 1,4080 | −0,3005 | |
| 0,01 | 3,46 | 1,8044 | −0,2858 | |
| 0,02 | 3,51 | 1,8328 | −0,2834 | |
| 0,01 | 3,62 | 1,8911 | −0,2269 | |
| 0,01 | 4,80 | 2,5052 | −0,2088 |
13F- och fond arkiveringar
Denna blankett lämnades in den 2025-07-23 för rapporteringsperioden 2025-06-30. Klicka på länksymbolen för att se hela transaktionshistoriken.
Uppgradera för att låsa upp premiumdata och exportera till Excel![]() .
.
| Värdepapper | Typ | Genomsnittligt aktiepris | Aktier (MM) |
ΔAktier (%) |
ΔAktier (%) |
Värde ($MM) |
Portfölj (%) |
ΔPortfölj (%) |
|
|---|---|---|---|---|---|---|---|---|---|
| MSFT / Microsoft Corporation | 0,02 | 0,89 | 9,01 | 33,70 | 4,7024 | 0,7938 | |||
| AAPL / Apple Inc. | 0,04 | −2,53 | 8,95 | −9,97 | 4,6737 | −1,0952 | |||
| LLY / Eli Lilly and Company | 0,01 | 1,46 | 8,47 | −4,24 | 4,4232 | −0,7095 | |||
| AMZN / Amazon.com, Inc. | 0,03 | 2,49 | 7,66 | 18,18 | 3,9992 | 0,2391 | |||
| META / Meta Platforms, Inc. | 0,01 | 2,16 | 7,66 | 30,83 | 3,9980 | 0,6021 | |||
| JPM / JPMorgan Chase & Co. | 0,02 | 1,70 | 6,56 | 20,19 | 3,4232 | 0,2583 | |||
| GSCE / GS Connect S&P GSCI Enhanced Commodity Total Return ETN | 0,01 | 2,05 | 6,04 | 32,22 | 3,1525 | 0,5028 | |||
| GOOGL / Alphabet Inc. | 0,03 | 3,86 | 5,44 | 18,37 | 2,8397 | 0,1736 | |||
| 0JCT / Intuit Inc. | 0,01 | 1,69 | 5,32 | 30,43 | 2,7779 | 0,4115 | |||
| V / Visa Inc. | 0,01 | 1,24 | 4,80 | 2,57 | 2,5052 | −0,2088 | |||
| NOW / ServiceNow, Inc. | 0,00 | 2,03 | 4,75 | 31,74 | 2,4819 | 0,3887 | |||
| NVDA / NVIDIA Corporation | 0,03 | 65,81 | 4,50 | 141,80 | 2,3473 | 1,2682 | |||
| RTX / RTX Corporation | 0,03 | 2,43 | 4,42 | 12,90 | 2,3086 | 0,0368 | |||
| BX / Blackstone Inc. | 0,03 | 3,83 | 4,35 | 11,11 | 2,2724 | −0,0003 | |||
| KMI / Kinder Morgan, Inc. | 0,15 | 1,80 | 4,30 | 4,93 | 2,2460 | −0,1330 | |||
| BAC / Bank of America Corporation | 0,09 | 3,60 | 4,17 | 17,51 | 2,1766 | 0,1179 | |||
| WFC / Wells Fargo & Company | 0,05 | 2,93 | 4,05 | 14,89 | 2,1160 | 0,0692 | |||
| CSCO / Cisco Systems, Inc. | 0,06 | 3,95 | 3,92 | 16,87 | 2,0448 | 0,1006 | |||
| HD / The Home Depot, Inc. | 0,01 | 3,26 | 3,79 | 3,30 | 1,9799 | −0,1499 | |||
| XOM / Exxon Mobil Corporation | 0,03 | 4,20 | 3,72 | −5,56 | 1,9424 | −0,3428 | |||
| JNJ / Johnson & Johnson | 0,02 | 11,14 | 3,68 | 2,36 | 1,9237 | −0,1644 | |||
| CB / Chubb Limited | 0,01 | 3,42 | 3,62 | −0,79 | 1,8911 | −0,2269 | |||
| PG / The Procter & Gamble Company | 0,02 | 2,94 | 3,51 | −3,76 | 1,8328 | −0,2834 | |||
| CVX / Chevron Corporation | 0,02 | 11,07 | 3,49 | −4,93 | 1,8232 | −0,3077 | |||
| MCD / McDonald's Corporation | 0,01 | 2,56 | 3,46 | −4,08 | 1,8044 | −0,2858 | |||
| DKNG / DraftKings Inc. | 0,08 | 6,79 | 3,40 | 37,92 | 1,7761 | 0,3451 | |||
| CRM / Salesforce, Inc. | 0,01 | 4,36 | 3,32 | 6,06 | 1,7354 | −0,0831 | |||
| AMGN / Amgen Inc. | 0,01 | 4,72 | 3,18 | −6,14 | 1,6592 | −0,3053 | |||
| DIS / The Walt Disney Company | 0,03 | 7,03 | 3,12 | 34,50 | 1,6268 | 0,2825 | |||
| KO / The Coca-Cola Company | 0,04 | 3,86 | 2,91 | 2,58 | 1,5185 | −0,1261 | |||
| VZ / Verizon Communications Inc. | 0,07 | 3,64 | 2,90 | −1,13 | 1,5119 | −0,1874 | |||
| BHP / BHP Group Limited - Depositary Receipt (Common Stock) | 0,06 | 6,33 | 2,87 | 5,36 | 1,4984 | −0,0821 | |||
| NEE / NextEra Energy, Inc. | 0,04 | 9,84 | 2,76 | 7,60 | 1,4418 | −0,0476 | |||
| BA / The Boeing Company | 0,01 | 5,17 | 2,74 | 29,22 | 1,4322 | 0,2004 | |||
| SBUX / Starbucks Corporation | 0,03 | 8,09 | 2,70 | 0,97 | 1,4098 | −0,1417 | |||
| TMO / Thermo Fisher Scientific Inc. | 0,01 | 12,39 | 2,70 | −8,42 | 1,4080 | −0,3005 | |||
| O / Realty Income Corporation | 0,05 | 5,85 | 2,69 | 5,12 | 1,4052 | −0,0803 | |||
| UPS / United Parcel Service, Inc. | 0,03 | 21,65 | 2,65 | 11,65 | 1,3861 | 0,0065 | |||
| PFE / Pfizer Inc. | 0,10 | 16,93 | 2,51 | 11,86 | 1,3100 | 0,0086 | |||
| VEA / Vanguard Tax-Managed Funds - Vanguard FTSE Developed Markets ETF | 0,02 | 2,93 | 1,39 | 15,46 | 0,7257 | 0,0272 | |||
| VUG / Vanguard Index Funds - Vanguard Growth ETF | 0,00 | 2,63 | 1,34 | 21,36 | 0,6973 | 0,0587 | |||
| VTV / Vanguard Index Funds - Vanguard Value ETF | 0,01 | 4,15 | 1,07 | 6,61 | 0,5563 | −0,0238 | |||
| VB / Vanguard Index Funds - Vanguard Small-Cap ETF | 0,00 | 4,88 | 0,98 | 12,04 | 0,5105 | 0,0044 | |||
| IBM / International Business Machines Corporation | 0,00 | −5,79 | 0,83 | 11,64 | 0,4310 | 0,0022 | |||
| PM / Philip Morris International Inc. | 0,00 | −5,45 | 0,75 | 8,44 | 0,3894 | −0,0094 | |||
| VWO / Vanguard International Equity Index Funds - Vanguard FTSE Emerging Markets ETF | 0,01 | 4,13 | 0,74 | 13,87 | 0,3862 | 0,0091 | |||
| C / Citigroup Inc. | 0,01 | −5,59 | 0,72 | 13,15 | 0,3778 | 0,0070 | |||
| TXN / Texas Instruments Incorporated | 0,00 | 0,00 | 0,59 | 15,69 | 0,3081 | 0,0118 | |||
| CRWD / CrowdStrike Holdings, Inc. | 0,00 | 0,59 | 0,3072 | 0,3072 | |||||
| ETR / Entergy Corporation | 0,01 | −6,96 | 0,55 | −9,52 | 0,2879 | −0,0657 | |||
| GOOGL / Alphabet Inc. | 0,00 | −2,86 | 0,54 | 10,29 | 0,2804 | −0,0021 | |||
| LMT / Lockheed Martin Corporation | 0,00 | −4,26 | 0,53 | −0,75 | 0,2774 | −0,0331 | |||
| NOC / Northrop Grumman Corporation | 0,00 | −5,83 | 0,51 | −7,97 | 0,2655 | −0,0553 | |||
| AZN / AstraZeneca PLC - Depositary Receipt (Common Stock) | 0,01 | −3,99 | 0,49 | −8,77 | 0,2556 | −0,0555 | |||
| WMB / The Williams Companies, Inc. | 0,01 | −7,22 | 0,48 | −2,42 | 0,2528 | −0,0353 | |||
| AEP / American Electric Power Company, Inc. | 0,00 | −6,33 | 0,48 | −11,05 | 0,2527 | −0,0630 | |||
| HYG / iShares Trust - iShares iBoxx $ High Yield Corporate Bond ETF | 0,01 | 0,85 | 0,48 | 3,22 | 0,2513 | −0,0196 | |||
| SO / The Southern Company | 0,01 | −6,66 | 0,47 | −6,80 | 0,2435 | −0,0467 | |||
| TRP / TC Energy Corporation | 0,01 | −6,83 | 0,44 | −3,69 | 0,2323 | −0,0358 | |||
| UL / Unilever PLC - Depositary Receipt (Common Stock) | 0,01 | −6,43 | 0,44 | −3,96 | 0,2284 | −0,0356 | |||
| NVS / Novartis AG - Depositary Receipt (Common Stock) | 0,00 | −6,61 | 0,44 | 1,16 | 0,2277 | −0,0219 | |||
| CME / CME Group Inc. | 0,00 | −8,41 | 0,43 | −4,91 | 0,2227 | −0,0373 | |||
| TTE / TotalEnergies SE - Depositary Receipt (Common Stock) | 0,01 | −5,20 | 0,42 | −10,06 | 0,2196 | −0,0516 | |||
| T / AT&T Inc. | 0,01 | −5,62 | 0,42 | −3,46 | 0,2190 | −0,0330 | |||
| EMB / iShares Trust - iShares J.P. Morgan USD Emerging Markets Bond ETF | 0,00 | 0,18 | 0,41 | 2,50 | 0,2142 | −0,0182 | |||
| MO / Altria Group, Inc. | 0,01 | −8,23 | 0,41 | −10,33 | 0,2134 | −0,0511 | |||
| TSLA / Tesla, Inc. | 0,00 | −13,80 | 0,40 | 5,60 | 0,2072 | −0,0107 | |||
| MRK / Merck & Co., Inc. | 0,00 | 6,24 | 0,39 | −6,22 | 0,2047 | −0,0381 | |||
| BNS / The Bank of Nova Scotia | 0,01 | −7,69 | 0,39 | 7,50 | 0,2026 | −0,0067 | |||
| BMY / Bristol-Myers Squibb Company | 0,01 | −5,58 | 0,38 | −28,41 | 0,2004 | −0,1103 | |||
| SNY / Sanofi - Depositary Receipt (Common Stock) | 0,01 | −5,76 | 0,38 | −18,00 | 0,1977 | −0,0699 | |||
| VOD / Vodafone Group Public Limited Company - Depositary Receipt (Common Stock) | 0,03 | −6,50 | 0,36 | 6,27 | 0,1861 | −0,0083 | |||
| F / Ford Motor Company | 0,03 | −6,85 | 0,35 | 0,87 | 0,1819 | −0,0187 | |||
| DEO / Diageo plc - Depositary Receipt (Common Stock) | 0,00 | −12,70 | 0,34 | −15,92 | 0,1766 | −0,0570 | |||
| RIO / Rio Tinto Group - Depositary Receipt (Common Stock) | 0,00 | −7,89 | 0,29 | −10,49 | 0,1517 | −0,0368 | |||
| PLTR / Palantir Technologies Inc. | 0,00 | 0,27 | 0,1424 | 0,1424 | |||||
| KHC / The Kraft Heinz Company | 0,01 | −1,22 | 0,27 | −16,14 | 0,1385 | −0,0451 | |||
| VTI / Vanguard Index Funds - Vanguard Total Stock Market ETF | 0,00 | 6,27 | 0,26 | 17,35 | 0,1346 | 0,0073 | |||
| VXUS / Vanguard STAR Funds - Vanguard Total International Stock ETF | 0,00 | 2,06 | 0,25 | 13,36 | 0,1290 | 0,0028 | |||
| PEP / PepsiCo, Inc. | 0,00 | 0,00 | 0,21 | −12,02 | 0,1074 | −0,0281 | |||
| INTC / Intel Corporation | 0,00 | −100,00 | 0,00 | −100,00 | −0,0030 |