Grundläggande statistik
| Portföljvärde | $ 8 854 000 |
| Aktuella positioner | 21 |
Senaste innehav, resultat, förvaltat kapital (från 13F, 13D)
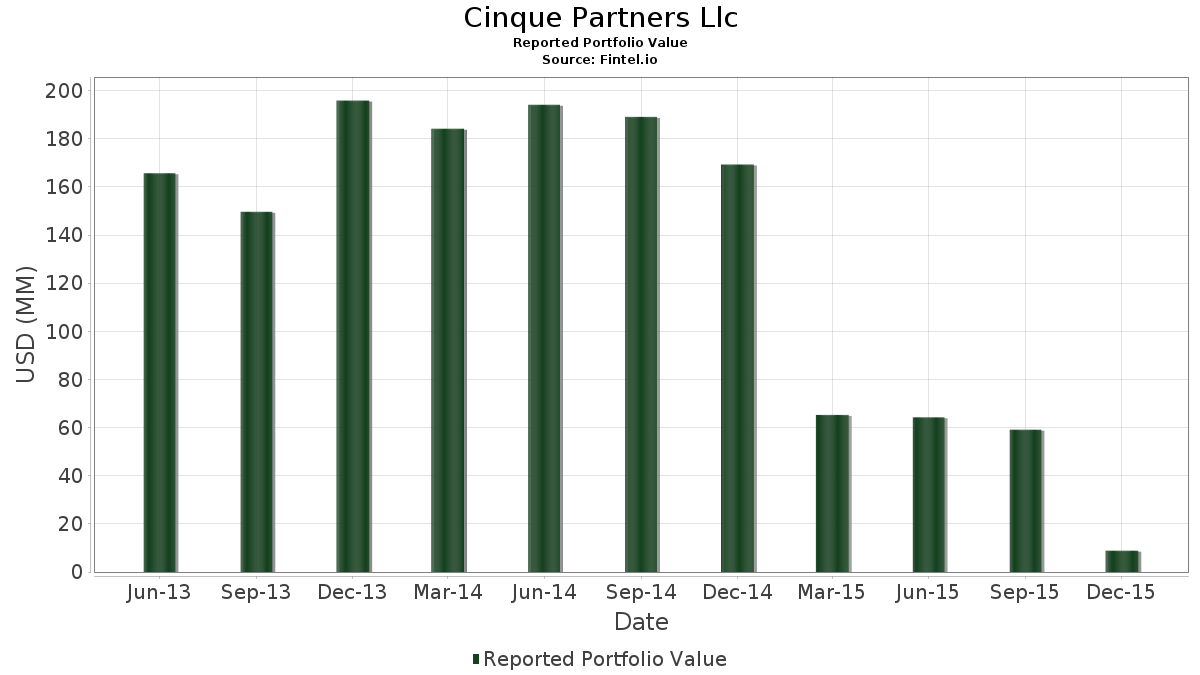
Cinque Partners Llc har redovisat 21 totala innehav i sina senaste SEC-arkiveringar. Det senaste portföljvärdet beräknas vara $ 8 854 000 USD. Faktiskt förvaltade tillgångar (AUM) är detta värde plus likvida medel (som inte redovisas). Cinque Partners Llcs största innehav är SPDR S&P 500 ETF (US:SPY) , iShares Trust - iShares U.S. Technology ETF (US:IYW) , The Select Sector SPDR Trust - The Industrial Select Sector SPDR Fund (US:XLI) , The Select Sector SPDR Trust - The Financial Select Sector SPDR Fund (US:XLF) , and The Select Sector SPDR Trust - The Health Care Select Sector SPDR Fund (US:XLV) .
Största ökningarna detta kvartal
Vi använder förändringen i portföljallokeringen eftersom det är det mest meningsfulla måttet. Förändringar kan bero på transaktioner eller förändringar i aktiekurser.
| Värdepapper | Aktier (MM) |
Värde (MM$) |
Portfölj % av | ΔPortfölj % av |
|---|---|---|---|---|
| 0,01 | 1,38 | 15,6314 | 6,6430 | |
| 0,01 | 1,01 | 11,4525 | 4,6051 | |
| 0,03 | 0,73 | 8,2336 | 3,5424 | |
| 0,00 | 0,26 | 2,9252 | 2,9252 | |
| 0,01 | 0,70 | 7,8834 | 2,8151 | |
| 0,01 | 0,74 | 8,3465 | 2,7438 | |
| 0,00 | 0,38 | 4,2806 | 1,6170 | |
| 0,01 | 0,24 | 2,6655 | 1,6136 | |
| 0,00 | 0,46 | 5,2293 | 1,5866 | |
| 0,01 | 0,34 | 3,8514 | 1,2775 |
Största minskningarna detta kvartal
Vi använder förändringen i portföljallokeringen eftersom det är det mest meningsfulla måttet. Förändringar kan bero på transaktioner eller förändringar i aktiepriser.
| Värdepapper | Aktier (MM) |
Värde (MM$) |
Portfölj % av | ΔPortfölj % av |
|---|---|---|---|---|
| 0,00 | 0,00 | −1,5254 | ||
| 0,00 | 0,00 | −1,3901 | ||
| 0,00 | 0,00 | −1,3715 | ||
| 0,00 | 0,00 | −1,3343 | ||
| 0,00 | 0,00 | −1,2734 | ||
| 0,00 | 0,00 | −1,2633 | ||
| 0,00 | 0,00 | −1,2058 | ||
| 0,00 | 0,00 | −1,1364 | ||
| 0,00 | 0,00 | −1,1364 | ||
| 0,00 | 0,00 | −1,1128 |
13F- och fond arkiveringar
Denna blankett lämnades in den 2016-02-12 för rapporteringsperioden 2015-12-31. Klicka på länksymbolen för att se hela transaktionshistoriken.
Uppgradera för att låsa upp premiumdata och exportera till Excel![]() .
.
| Värdepapper | Typ | Genomsnittligt aktiepris | Aktier (MM) |
ΔAktier (%) |
ΔAktier (%) |
Värde ($MM) |
Portfölj (%) |
ΔPortfölj (%) |
|
|---|---|---|---|---|---|---|---|---|---|
| SPY / SPDR S&P 500 ETF | 0,01 | −75,52 | 1,38 | −73,96 | 15,6314 | 6,6430 | |||
| IYW / iShares Trust - iShares U.S. Technology ETF | 0,01 | −76,86 | 1,01 | −74,96 | 11,4525 | 4,6051 | |||
| XLI / The Select Sector SPDR Trust - The Industrial Select Sector SPDR Fund | 0,01 | −79,01 | 0,74 | −77,69 | 8,3465 | 2,7438 | |||
| XLF / The Select Sector SPDR Trust - The Financial Select Sector SPDR Fund | 0,03 | −75,01 | 0,73 | −73,72 | 8,2336 | 3,5424 | |||
| XLV / The Select Sector SPDR Trust - The Health Care Select Sector SPDR Fund | 0,01 | −78,59 | 0,70 | −76,71 | 7,8834 | 2,8151 | |||
| CVS / CVS Health Corporation | 0,00 | −78,77 | 0,46 | −78,51 | 5,2293 | 1,5866 | |||
| TRV / The Travelers Companies, Inc. | 0,00 | −78,78 | 0,38 | −75,94 | 4,2806 | 1,6170 | |||
| T / AT&T Inc. | 0,01 | −78,77 | 0,34 | −77,60 | 3,8514 | 1,2775 | |||
| WBA / Walgreens Boots Alliance, Inc. | 0,00 | −78,77 | 0,34 | −78,22 | 3,8401 | 1,2002 | |||
| GM / General Motors Company | 0,01 | −78,94 | 0,27 | −76,14 | 3,0269 | 1,1277 | |||
| DIS / The Walt Disney Company | 0,00 | −78,78 | 0,27 | −78,19 | 3,0269 | 0,9485 | |||
| XLY / The Select Sector SPDR Trust - The Consumer Discretionary Select Sector SPDR Fund | 0,00 | 0,00 | 0,26 | 2,9252 | 2,9252 | ||||
| ALL / The Allstate Corporation | 0,00 | −78,77 | 0,24 | −77,39 | 2,6993 | 0,9118 | |||
| XLB / The Select Sector SPDR Trust - The Materials Select Sector SPDR Fund | 0,01 | −65,20 | 0,24 | −62,06 | 2,6655 | 1,6136 | |||
| F / Ford Motor Company | 0,02 | −78,94 | 0,24 | −78,13 | 2,6655 | 0,8407 | |||
| VLO / Valero Energy Corporation | 0,00 | −84,70 | 0,22 | −82,03 | 2,4622 | 0,4108 | |||
| ORCL / Oracle Corporation | 0,01 | −78,77 | 0,22 | −78,51 | 2,4509 | 0,7428 | |||
| HD / The Home Depot, Inc. | 0,00 | −78,94 | 0,22 | −75,87 | 2,4396 | 0,9260 | |||
| AAPL / Apple Inc. | 0,00 | −78,78 | 0,21 | −79,79 | 2,3379 | 0,6062 | |||
| 018490100 / Allergan plc | 0,00 | −78,79 | 0,20 | −75,60 | 2,2927 | 0,8857 | |||
| INTC / Intel Corporation | 0,01 | −84,17 | 0,20 | −81,95 | 2,2589 | 0,3851 | |||
| SBUX / Starbucks Corporation | 0,00 | −100,00 | 0,00 | −100,00 | −1,3343 | ||||
| MRK / Merck & Co., Inc. | 0,00 | −100,00 | 0,00 | −100,00 | −0,8354 | ||||
| GILD / Gilead Sciences, Inc. | 0,00 | −100,00 | 0,00 | −100,00 | −1,3901 | ||||
| XLU / The Select Sector SPDR Trust - The Utilities Select Sector SPDR Fund | 0,00 | −100,00 | 0,00 | −100,00 | −1,0350 | ||||
| PFE / Pfizer Inc. | 0,00 | −100,00 | 0,00 | −100,00 | −0,9927 | ||||
| DHR / Danaher Corporation | 0,00 | −100,00 | 0,00 | −100,00 | −1,1128 | ||||
| ESRX / Express Scripts Holding Co. | 0,00 | −100,00 | 0,00 | −100,00 | −1,2058 | ||||
| ARRS / ARRIS International plc | 0,00 | −100,00 | 0,00 | −100,00 | −1,0570 | ||||
| AEP / American Electric Power Company, Inc. | 0,00 | −100,00 | 0,00 | −100,00 | −1,3715 | ||||
| CF / CF Industries Holdings, Inc. | 0,00 | −100,00 | 0,00 | −100,00 | −0,7965 | ||||
| HP / Helmerich & Payne, Inc. | 0,00 | −100,00 | 0,00 | −100,00 | −0,7796 | ||||
| CSCO / Cisco Systems, Inc. | 0,00 | −100,00 | 0,00 | −100,00 | −1,0079 | ||||
| WMT / Walmart Inc. | 0,00 | −100,00 | 0,00 | −100,00 | −1,5254 | ||||
| MNKKQ / Mallinckrodt Plc | 0,00 | −100,00 | 0,00 | −100,00 | −0,5598 | ||||
| AVGO / Broadcom Inc. | 0,00 | −100,00 | 0,00 | −100,00 | −1,0620 | ||||
| KMX / CarMax, Inc. | 0,00 | −100,00 | 0,00 | −100,00 | −1,1026 | ||||
| GS / The Goldman Sachs Group, Inc. | 0,00 | −100,00 | 0,00 | −100,00 | −0,9132 | ||||
| NOV / NOV Inc. | 0,00 | −100,00 | 0,00 | −100,00 | −0,8540 | ||||
| CVX / Chevron Corporation | 0,00 | −100,00 | 0,00 | −100,00 | −0,8845 | ||||
| RTX / RTX Corporation | 0,00 | −100,00 | 0,00 | −100,00 | −0,8676 | ||||
| JPM / JPMorgan Chase & Co. | 0,00 | −100,00 | 0,00 | −100,00 | −1,0045 | ||||
| XOM / Exxon Mobil Corporation | 0,00 | −100,00 | 0,00 | −100,00 | −0,9690 | ||||
| COP / ConocoPhillips | 0,00 | −100,00 | 0,00 | −100,00 | −0,6020 | ||||
| JCI / Johnson Controls International plc | 0,00 | −100,00 | 0,00 | −100,00 | −1,0874 | ||||
| CAM / Cameron International Corporation | 0,00 | −100,00 | 0,00 | −100,00 | −1,2734 | ||||
| C / Citigroup Inc. - Corporate Bond/Note | 0,00 | −100,00 | 0,00 | −100,00 | −0,9893 | ||||
| CELG / Celgene Corp. | 0,00 | −100,00 | 0,00 | −100,00 | −1,0485 | ||||
| GOOGL / Alphabet Inc. | 0,00 | −100,00 | 0,00 | −100,00 | −1,0620 | ||||
| AMGN / Amgen Inc. | 0,00 | −100,00 | 0,00 | −100,00 | −1,1364 | ||||
| LYB / LyondellBasell Industries N.V. | 0,00 | −100,00 | 0,00 | −100,00 | −0,8997 | ||||
| VIAB / Viacom, Inc. | 0,00 | −100,00 | 0,00 | −100,00 | −1,1364 | ||||
| RE / Everest Re Group Ltd | 0,00 | −100,00 | 0,00 | −100,00 | −1,2633 | ||||
| ACN / Accenture plc | 0,00 | −100,00 | 0,00 | −100,00 | −1,0586 | ||||
| UNP / Union Pacific Corporation | 0,00 | −100,00 | 0,00 | −100,00 | −0,9792 | ||||
| CMCSA / Comcast Corporation | 0,00 | −100,00 | 0,00 | −100,00 | −1,0773 | ||||
| MSFT / Microsoft Corporation | 0,00 | −100,00 | 0,00 | −100,00 | −1,0502 | ||||
| AIG / American International Group, Inc. | 0,00 | −100,00 | 0,00 | −100,00 | −1,0299 |