Grundläggande statistik
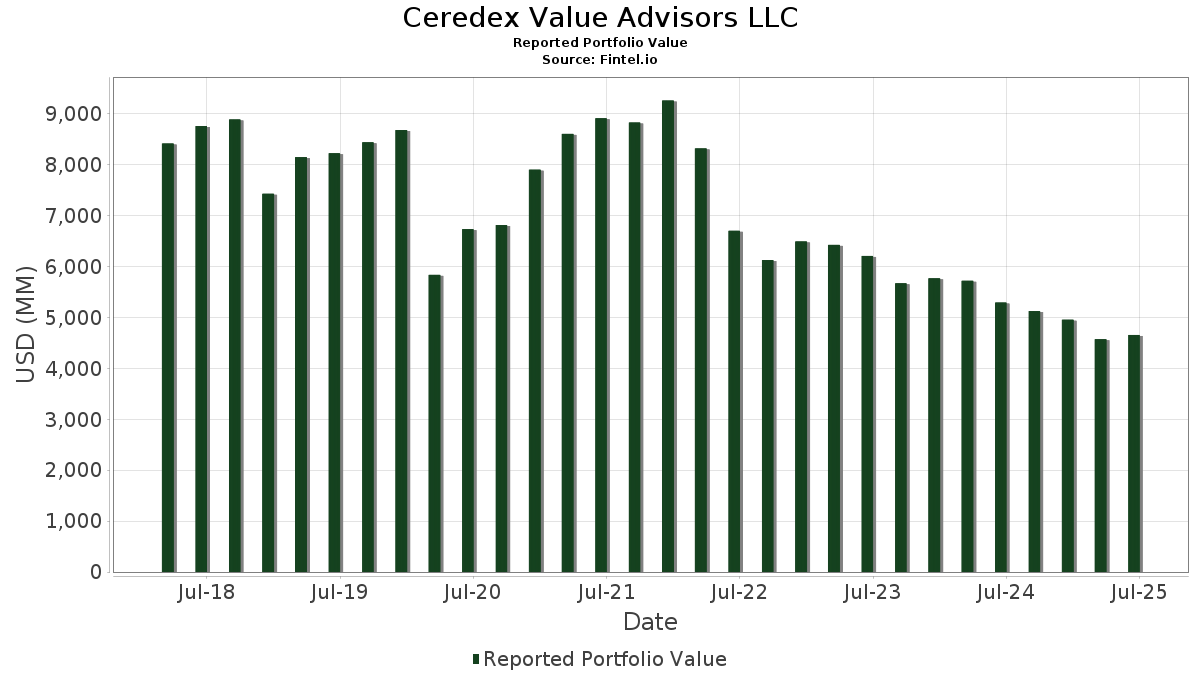
| Portföljvärde | $ 4 656 015 519 |
| Aktuella positioner | 166 |
Senaste innehav, resultat, förvaltat kapital (från 13F, 13D)
Ceredex Value Advisors LLC har redovisat 166 totala innehav i sina senaste SEC-arkiveringar. Det senaste portföljvärdet beräknas vara $ 4 656 015 519 USD. Faktiskt förvaltade tillgångar (AUM) är detta värde plus likvida medel (som inte redovisas). Ceredex Value Advisors LLCs största innehav är KeyCorp (US:KEY) , PPL Corporation (US:PPL) , Ameren Corporation (US:AEE) , Dell Technologies Inc. (US:DELL) , and International Paper Company (US:IP) . Ceredex Value Advisors LLCs nya positioner inkluderar Meta Platforms, Inc. (US:META) , Primo Brands Corporation (US:PRMB) , Corning Incorporated (US:GLW) , Alcon Inc. (MX:ALC N) , and Ventas, Inc. (US:VTR) .
Största ökningarna detta kvartal
Vi använder förändringen i portföljallokeringen eftersom det är det mest meningsfulla måttet. Förändringar kan bero på transaktioner eller förändringar i aktiekurser.
| Värdepapper | Aktier (MM) |
Värde (MM$) |
Portfölj % av | ΔPortfölj % av |
|---|---|---|---|---|
| 0,06 | 44,14 | 0,9480 | 0,9480 | |
| 1,39 | 41,15 | 0,8839 | 0,8839 | |
| 0,31 | 40,48 | 0,8695 | 0,8695 | |
| 0,59 | 31,24 | 0,6710 | 0,6710 | |
| 0,35 | 31,11 | 0,6682 | 0,6682 | |
| 0,46 | 28,86 | 0,6198 | 0,6198 | |
| 0,73 | 60,78 | 0,6052 | 0,6052 | |
| 0,06 | 28,17 | 0,6050 | 0,6050 | |
| 0,03 | 26,27 | 0,5642 | 0,5642 | |
| 0,48 | 25,09 | 0,5389 | 0,5389 |
Största minskningarna detta kvartal
Vi använder förändringen i portföljallokeringen eftersom det är det mest meningsfulla måttet. Förändringar kan bero på transaktioner eller förändringar i aktiepriser.
| Värdepapper | Aktier (MM) |
Värde (MM$) |
Portfölj % av | ΔPortfölj % av |
|---|---|---|---|---|
| 1,35 | 45,71 | 0,4552 | −1,5714 | |
| 0,11 | 28,75 | 0,2863 | −1,5644 | |
| 0,04 | 21,89 | 0,2180 | −1,3575 | |
| 0,37 | 36,13 | 0,3597 | −1,0930 | |
| 0,26 | 30,05 | 0,2992 | −1,0911 | |
| 0,22 | 25,73 | 0,2562 | −1,0833 | |
| 0,22 | 47,37 | 0,4716 | −1,0610 | |
| 0,29 | 35,58 | 0,3543 | −1,0280 | |
| 4,83 | 84,09 | 0,8374 | −0,9909 | |
| 1,61 | 75,62 | 0,7530 | −0,9811 |
13F- och fond arkiveringar
Denna blankett lämnades in den 2025-08-13 för rapporteringsperioden 2025-06-30. Klicka på länksymbolen för att se hela transaktionshistoriken.
Uppgradera för att låsa upp premiumdata och exportera till Excel![]() .
.
| Värdepapper | Typ | Genomsnittligt aktiepris | Aktier (MM) |
ΔAktier (%) |
ΔAktier (%) |
Värde ($MM) |
Portfölj (%) |
ΔPortfölj (%) |
|
|---|---|---|---|---|---|---|---|---|---|
| KEY / KeyCorp | 4,83 | −7,66 | 84,09 | 0,60 | 0,8374 | −0,9909 | |||
| PPL / PPL Corporation | 2,34 | 185,72 | 79,42 | 168,16 | 0,7908 | 0,1431 | |||
| AEE / Ameren Corporation | 0,82 | 62,77 | 78,93 | 55,70 | 0,7859 | −0,3228 | |||
| DELL / Dell Technologies Inc. | 0,62 | 48,63 | 75,64 | 99,91 | 0,7532 | −0,0744 | |||
| IP / International Paper Company | 1,61 | 8,65 | 75,62 | −4,63 | 0,7530 | −0,9811 | |||
| ROK / Rockwell Automation, Inc. | 0,23 | −13,00 | 75,47 | 11,85 | 0,7514 | −0,7242 | |||
| URI / United Rentals, Inc. | 0,10 | −5,86 | 74,26 | 13,18 | 0,7394 | −0,6956 | |||
| FCX / Freeport-McMoRan Inc. | 1,64 | 137,33 | 71,27 | 171,76 | 0,7097 | 0,1361 | |||
| NXPI / NXP Semiconductors N.V. | 0,30 | −22,80 | 66,37 | −11,25 | 0,6609 | −0,9748 | |||
| JPM / JPMorgan Chase & Co. | 0,23 | −5,57 | 66,25 | 11,61 | 0,6596 | −0,6386 | |||
| OWL / Blue Owl Capital Inc. | 3,30 | 1,33 | 63,45 | −2,87 | 0,6318 | −0,7969 | |||
| IR / Ingersoll Rand Inc. | 0,73 | 60,78 | 0,6052 | 0,6052 | |||||
| FANG / Diamondback Energy, Inc. | 0,43 | 95,97 | 59,68 | 68,42 | 0,5942 | −0,1808 | |||
| RVTY / Revvity, Inc. | 0,59 | 51,71 | 56,75 | 38,69 | 0,5651 | −0,3299 | |||
| BAC / Bank of America Corporation | 1,19 | −15,23 | 56,09 | −3,87 | 0,5585 | −0,7177 | |||
| SBUX / Starbucks Corporation | 0,55 | 28,47 | 50,70 | 20,01 | 0,5049 | −0,4191 | |||
| DHR / Danaher Corporation | 0,25 | 1,57 | 49,26 | −2,12 | 0,4905 | −0,6103 | |||
| ELS / Equity LifeStyle Properties, Inc. | 0,79 | 1,36 | 49,02 | −6,29 | 0,4881 | −0,6560 | |||
| AON / Aon plc | 0,14 | 8,75 | 48,56 | −2,78 | 0,4835 | −0,6089 | |||
| XOM / Exxon Mobil Corporation | 0,44 | 47,86 | 0,4766 | 0,4766 | |||||
| HD / The Home Depot, Inc. | 0,13 | −12,06 | 47,70 | −12,03 | 0,4750 | −0,7109 | |||
| COF / Capital One Financial Corporation | 0,22 | −43,04 | 47,37 | −32,40 | 0,4716 | −1,0610 | |||
| MSFT / Microsoft Corporation | 0,10 | −15,90 | 47,32 | 11,44 | 0,4711 | −0,4575 | |||
| JNJ / Johnson & Johnson | 0,31 | 47,11 | 0,4691 | 0,4691 | |||||
| SLB / Schlumberger Limited | 1,35 | −38,99 | 45,71 | −50,67 | 0,4552 | −1,5714 | |||
| SNX / TD SYNNEX Corporation | 0,33 | 257,29 | 45,24 | 366,39 | 0,4504 | 0,2383 | |||
| CHD / Church & Dwight Co., Inc. | 0,47 | 0,33 | 44,85 | −12,41 | 0,4466 | −0,6733 | |||
| MMM / 3M Company | 0,29 | −15,77 | 44,65 | −12,69 | 0,4446 | −0,6738 | |||
| EGP / EastGroup Properties, Inc. | 0,27 | 65,72 | 44,55 | 57,23 | 0,4436 | −0,1761 | |||
| META / Meta Platforms, Inc. | 0,06 | 44,14 | 0,9480 | 0,9480 | |||||
| RRX / Regal Rexnord Corporation | 0,30 | −21,81 | 43,77 | −0,45 | 0,4359 | −0,5258 | |||
| RJF / Raymond James Financial, Inc. | 0,28 | −6,32 | 43,69 | 3,44 | 0,4351 | −0,4888 | |||
| DIS / The Walt Disney Company | 0,35 | 44,63 | 43,53 | 81,71 | 0,4334 | −0,0905 | |||
| HXL / Hexcel Corporation | 0,77 | 8,22 | 43,49 | 11,64 | 0,4330 | −0,4189 | |||
| PRMB / Primo Brands Corporation | 1,39 | 41,15 | 0,8839 | 0,8839 | |||||
| MDLZ / Mondelez International, Inc. | 0,61 | −18,36 | 40,95 | −18,86 | 0,4077 | −0,6959 | |||
| JCI / Johnson Controls International plc | 0,39 | −18,53 | 40,88 | 7,41 | 0,4070 | −0,4253 | |||
| J / Jacobs Solutions Inc. | 0,31 | 40,48 | 0,8695 | 0,8695 | |||||
| AMT / American Tower Corporation | 0,18 | −21,70 | 39,91 | −20,47 | 0,3974 | −0,7002 | |||
| NKE / NIKE, Inc. | 0,56 | 23,01 | 39,60 | 37,66 | 0,3943 | −0,2348 | |||
| FDX / FedEx Corporation | 0,17 | −5,59 | 39,37 | −11,96 | 0,3920 | −0,5860 | |||
| VNT / Vontier Corporation | 1,02 | 195,24 | 37,78 | 231,66 | 0,3762 | 0,1270 | |||
| FCNCA / First Citizens BancShares, Inc. | 0,02 | 0,06 | 36,55 | 5,59 | 0,3639 | −0,3931 | |||
| LRCX / Lam Research Corporation | 0,37 | −59,38 | 36,13 | −45,61 | 0,3597 | −1,0930 | |||
| MU / Micron Technology, Inc. | 0,29 | −60,31 | 35,58 | −43,71 | 0,3543 | −1,0280 | |||
| EVR / Evercore Inc. | 0,13 | 215,38 | 35,17 | 326,41 | 0,3502 | 0,1698 | |||
| BDX / Becton, Dickinson and Company | 0,20 | −5,32 | 34,33 | −28,80 | 0,3419 | −0,7128 | |||
| LEN / Lennar Corporation | 0,31 | −7,55 | 33,96 | −10,91 | 0,3382 | −0,4956 | |||
| OC / Owens Corning | 0,24 | 1,99 | 33,45 | −1,79 | 0,3331 | −0,4119 | |||
| SO / The Southern Company | 0,36 | −31,17 | 32,98 | −31,26 | 0,3284 | −0,7209 | |||
| DOW / Dow Inc. | 1,24 | 17,39 | 32,77 | −10,98 | 0,3263 | −0,4788 | |||
| VRT / Vertiv Holdings Co | 0,25 | −46,69 | 32,58 | −5,18 | 0,3245 | −0,4271 | |||
| MSI / Motorola Solutions, Inc. | 0,08 | 32,40 | 38 931,33 | 0,3226 | 0,3212 | ||||
| CNP / CenterPoint Energy, Inc. | 0,87 | 32,11 | 0,3198 | 0,3198 | |||||
| KNSL / Kinsale Capital Group, Inc. | 0,07 | 32,03 | 0,3190 | 0,3190 | |||||
| ETR / Entergy Corporation | 0,38 | 17,88 | 31,99 | 14,62 | 0,3185 | −0,2919 | |||
| RCL / Royal Caribbean Cruises Ltd. | 0,10 | 0,93 | 31,50 | 53,83 | 0,3137 | −0,1342 | |||
| DOV / Dover Corporation | 0,17 | 15,63 | 31,29 | 20,60 | 0,3115 | −0,2559 | |||
| GLW / Corning Incorporated | 0,59 | 31,24 | 0,6710 | 0,6710 | |||||
| ALC N / Alcon Inc. | 0,35 | 31,11 | 0,6682 | 0,6682 | |||||
| MCHP / Microchip Technology Incorporated | 0,44 | 30,97 | 0,3084 | 0,3084 | |||||
| BAH / Booz Allen Hamilton Holding Corporation | 0,30 | 30,84 | 0,3071 | 0,3071 | |||||
| MAA / Mid-America Apartment Communities, Inc. | 0,20 | 9,45 | 30,19 | −3,33 | 0,3006 | −0,3825 | |||
| PPG / PPG Industries, Inc. | 0,26 | −54,55 | 30,05 | −52,73 | 0,2992 | −1,0911 | |||
| WDC / Western Digital Corporation | 0,47 | 29,95 | 0,2983 | 0,2983 | |||||
| CCI / Crown Castle Inc. | 0,29 | 29,94 | 0,2981 | 0,2981 | |||||
| TEL / TE Connectivity plc | 0,18 | −22,35 | 29,71 | −7,32 | 0,2958 | −0,4053 | |||
| HUBB / Hubbell Incorporated | 0,07 | −28,46 | 29,21 | −11,70 | 0,2909 | −0,4327 | |||
| VTR / Ventas, Inc. | 0,46 | 28,86 | 0,6198 | 0,6198 | |||||
| VMC / Vulcan Materials Company | 0,11 | −69,61 | 28,75 | −66,03 | 0,2863 | −1,5644 | |||
| DKS / DICK'S Sporting Goods, Inc. | 0,14 | 28,41 | 0,2829 | 0,2829 | |||||
| MCO / Moody's Corporation | 0,06 | 28,17 | 0,6050 | 0,6050 | |||||
| ROP / Roper Technologies, Inc. | 0,05 | 12,07 | 28,10 | 7,75 | 0,2798 | −0,2906 | |||
| WMT / Walmart Inc. | 0,29 | 12,25 | 27,96 | 25,03 | 0,2784 | −0,2107 | |||
| ALL / The Allstate Corporation | 0,14 | 0,58 | 27,68 | −2,22 | 0,2756 | −0,3435 | |||
| WMB / The Williams Companies, Inc. | 0,44 | 27,62 | 0,2751 | 0,2751 | |||||
| DAL / Delta Air Lines, Inc. | 0,55 | −14,31 | 26,99 | −3,34 | 0,2688 | −0,3419 | |||
| LPLA / LPL Financial Holdings Inc. | 0,07 | −23,78 | 26,83 | −12,64 | 0,2672 | −0,4045 | |||
| EME / EMCOR Group, Inc. | 0,05 | 26,54 | 0,2643 | 0,2643 | |||||
| LVS / Las Vegas Sands Corp. | 0,61 | −4,20 | 26,34 | 7,90 | 0,2623 | −0,2716 | |||
| AMH / American Homes 4 Rent | 0,73 | −25,57 | 26,31 | −28,99 | 0,2619 | −0,5483 | |||
| EQIX / Equinix, Inc. | 0,03 | 26,27 | 0,5642 | 0,5642 | |||||
| SGI / Somnigroup International Inc. | 0,38 | 23,90 | 26,19 | 40,81 | 0,2608 | −0,1460 | |||
| EXE / Expand Energy Corporation | 0,22 | −60,01 | 25,73 | −57,99 | 0,2562 | −1,0833 | |||
| GD / General Dynamics Corporation | 0,09 | −20,30 | 25,70 | −14,72 | 0,2559 | −0,4033 | |||
| ROST / Ross Stores, Inc. | 0,20 | 15,46 | 25,29 | 15,27 | 0,2519 | −0,2280 | |||
| JBL / Jabil Inc. | 0,12 | 25,25 | 0,2514 | 0,2514 | |||||
| VLO / Valero Energy Corporation | 0,19 | −25,02 | 25,14 | −23,69 | 0,2503 | −0,4701 | |||
| FLS / Flowserve Corporation | 0,48 | 25,09 | 0,5389 | 0,5389 | |||||
| PWR / Quanta Services, Inc. | 0,07 | −48,07 | 24,98 | −22,76 | 0,2488 | −0,4587 | |||
| TOL / Toll Brothers, Inc. | 0,19 | −29,09 | 22,01 | −23,36 | 0,2192 | −0,4090 | |||
| GEV / GE Vernova Inc. | 0,04 | −82,47 | 21,89 | −69,61 | 0,2180 | −1,3575 | |||
| KNX / Knight-Swift Transportation Holdings Inc. | 0,49 | 21,49 | 0,2140 | 0,2140 | |||||
| HIG / The Hartford Insurance Group, Inc. | 0,17 | −29,81 | 20,95 | −28,03 | 0,2086 | −0,4281 | |||
| STZ / Constellation Brands, Inc. | 0,13 | 20,61 | 0,2052 | 0,2052 | |||||
| IDA / IDACORP, Inc. | 0,17 | −3,57 | 19,61 | −4,21 | 0,1953 | −0,2525 | |||
| OGE / OGE Energy Corp. | 0,41 | −8,42 | 18,08 | −11,56 | 0,1800 | −0,2671 | |||
| EXR / Extra Space Storage Inc. | 0,12 | −27,16 | 17,83 | −27,68 | 0,1776 | −0,3617 | |||
| HUM / Humana Inc. | 0,07 | 17,52 | 0,1744 | 0,1744 | |||||
| MTDR / Matador Resources Company | 0,35 | 19,30 | 16,68 | 11,43 | 0,1661 | −0,1613 | |||
| ALLY / Ally Financial Inc. | 0,42 | 20,51 | 16,36 | 28,71 | 0,1629 | −0,1151 | |||
| WTFC / Wintrust Financial Corporation | 0,13 | 13,37 | 16,28 | 24,98 | 0,1621 | −0,1228 | |||
| UMBF / UMB Financial Corporation | 0,15 | 16,52 | 15,98 | 21,20 | 0,1592 | −0,1293 | |||
| RRC / Range Resources Corporation | 0,39 | 18,17 | 15,92 | 20,37 | 0,1585 | −0,1308 | |||
| SBCF / Seacoast Banking Corporation of Florida | 0,57 | 12,05 | 15,78 | 20,27 | 0,1571 | −0,1298 | |||
| PNFP / Pinnacle Financial Partners, Inc. | 0,14 | 18,29 | 15,58 | 23,17 | 0,1551 | −0,1215 | |||
| NVT / nVent Electric plc | 0,21 | −24,21 | 15,36 | 5,90 | 0,1530 | −0,1643 | |||
| CFR / Cullen/Frost Bankers, Inc. | 0,12 | 0,17 | 15,33 | 2,85 | 0,1526 | −0,1733 | |||
| SSB / SouthState Corporation | 0,16 | 11,59 | 15,11 | 10,64 | 0,1505 | −0,1483 | |||
| WCC / WESCO International, Inc. | 0,08 | −5,75 | 15,11 | 12,39 | 0,1504 | −0,1435 | |||
| GBCI / Glacier Bancorp, Inc. | 0,35 | 21,80 | 15,01 | 18,66 | 0,1495 | −0,1272 | |||
| ESI / Element Solutions Inc | 0,66 | 2,34 | 14,84 | 2,52 | 0,1478 | −0,1688 | |||
| HRI / Herc Holdings Inc. | 0,11 | 42,49 | 14,61 | 39,75 | 0,1455 | −0,0832 | |||
| CPT / Camden Property Trust | 0,13 | 7,21 | 14,57 | −1,21 | 0,1451 | −0,1775 | |||
| FNB / F.N.B. Corporation | 1,00 | 10,85 | 14,55 | 20,16 | 0,1449 | −0,1200 | |||
| TKR / The Timken Company | 0,20 | 9,88 | 14,47 | 10,92 | 0,1441 | −0,1412 | |||
| SFBS / ServisFirst Bancshares, Inc. | 0,19 | 9,29 | 14,36 | 2,56 | 0,1430 | −0,1633 | |||
| MSM / MSC Industrial Direct Co., Inc. | 0,17 | 1,35 | 14,36 | 10,94 | 0,1430 | −0,1401 | |||
| ESE / ESCO Technologies Inc. | 0,07 | −4,11 | 14,33 | 15,63 | 0,1427 | −0,1284 | |||
| BDC / Belden Inc. | 0,12 | −5,84 | 14,32 | 8,77 | 0,1426 | −0,1454 | |||
| COLB / Columbia Banking System, Inc. | 0,60 | 25,47 | 14,13 | 17,62 | 0,1407 | −0,1220 | |||
| ADC / Agree Realty Corporation | 0,19 | 15,82 | 13,99 | 9,63 | 0,1394 | −0,1399 | |||
| HLIO / Helios Technologies, Inc. | 0,42 | 19,24 | 13,95 | 24,00 | 0,1389 | −0,1071 | |||
| NBTB / NBT Bancorp Inc. | 0,33 | 2,39 | 13,89 | −0,83 | 0,1383 | −0,1680 | |||
| NNN / NNN REIT, Inc. | 0,32 | −1,20 | 13,86 | 0,03 | 0,1380 | −0,1650 | |||
| PB / Prosperity Bancshares, Inc. | 0,19 | 1,83 | 13,47 | 0,22 | 0,1341 | −0,1599 | |||
| FRME / First Merchants Corporation | 0,35 | 1,41 | 13,24 | −3,95 | 0,1318 | −0,1696 | |||
| SNDR / Schneider National, Inc. | 0,54 | 25,86 | 12,92 | 33,02 | 0,1287 | −0,0838 | |||
| FBIN / Fortune Brands Innovations, Inc. | 0,25 | 7,43 | 12,87 | −9,15 | 0,1282 | −0,1817 | |||
| KWR / Quaker Chemical Corporation | 0,11 | 10,71 | 12,67 | 0,25 | 0,1262 | −0,1503 | |||
| SSD / Simpson Manufacturing Co., Inc. | 0,08 | 22,09 | 12,64 | 20,72 | 0,1258 | −0,1031 | |||
| LFUS / Littelfuse, Inc. | 0,05 | −24,05 | 11,80 | −12,47 | 0,1175 | −0,1773 | |||
| PCH / PotlatchDeltic Corporation | 0,31 | 26,77 | 11,75 | 7,81 | 0,1170 | −0,1214 | |||
| BRX / Brixmor Property Group Inc. | 0,45 | −25,33 | 11,61 | −26,76 | 0,1156 | −0,2312 | |||
| DTM / DT Midstream, Inc. | 0,10 | 11,54 | 0,2479 | 0,2479 | |||||
| VOYA / Voya Financial, Inc. | 0,16 | 33,58 | 11,47 | 39,97 | 0,1142 | −0,0650 | |||
| KLIC / Kulicke and Soffa Industries, Inc. | 0,33 | −14,69 | 11,46 | −10,51 | 0,1142 | −0,1660 | |||
| AEIS / Advanced Energy Industries, Inc. | 0,09 | 11,34 | 0,2435 | 0,2435 | |||||
| POWI / Power Integrations, Inc. | 0,20 | −26,42 | 11,15 | −18,55 | 0,1110 | −0,1883 | |||
| TNC / Tennant Company | 0,14 | 14,97 | 11,07 | 11,71 | 0,1102 | −0,1065 | |||
| SIGI / Selective Insurance Group, Inc. | 0,13 | 10,64 | 11,06 | 4,74 | 0,1101 | −0,1208 | |||
| VMI / Valmont Industries, Inc. | 0,03 | 15,75 | 11,04 | 32,48 | 0,1099 | −0,0723 | |||
| CIGI / Colliers International Group Inc. | 0,08 | 2,88 | 10,97 | 10,72 | 0,1092 | −0,1075 | |||
| LPX / Louisiana-Pacific Corporation | 0,12 | 57,24 | 10,67 | 47,00 | 0,1063 | −0,0525 | |||
| MUSA / Murphy USA Inc. | 0,03 | 10,59 | 0,2274 | 0,2274 | |||||
| KMPR / Kemper Corporation | 0,16 | 3,02 | 10,56 | −0,54 | 0,1051 | −0,1270 | |||
| FAF / First American Financial Corporation | 0,17 | −20,40 | 10,37 | −25,54 | 0,1033 | −0,2014 | |||
| NOV / NOV Inc. | 0,82 | 17,81 | 10,20 | −3,78 | 0,1016 | −0,1303 | |||
| ALV / Autoliv, Inc. | 0,09 | −32,21 | 10,17 | −14,24 | 0,1012 | −0,1580 | |||
| AXS / AXIS Capital Holdings Limited | 0,10 | −22,43 | 10,12 | −19,66 | 0,1007 | −0,1747 | |||
| MTH / Meritage Homes Corporation | 0,15 | 9,99 | 0,2145 | 0,2145 | |||||
| CCOI / Cogent Communications Holdings, Inc. | 0,21 | 44,56 | 9,97 | 13,67 | 0,0993 | −0,0925 | |||
| AVNT / Avient Corporation | 0,30 | −9,60 | 9,75 | −21,40 | 0,0971 | −0,1742 | |||
| REYN / Reynolds Consumer Products Inc. | 0,43 | −21,27 | 9,21 | −29,32 | 0,0917 | −0,1932 | |||
| BRKR / Bruker Corporation | 0,21 | −23,29 | 8,83 | −24,28 | 0,0879 | −0,1671 | |||
| CUBE / CubeSmart | 0,20 | 8,41 | 0,0838 | 0,0838 | |||||
| PWP / Perella Weinberg Partners | 0,43 | 22,69 | 8,32 | 29,51 | 0,0829 | −0,0577 | |||
| BBWI / Bath & Body Works, Inc. | 0,28 | 8,29 | 0,0825 | 0,0825 | |||||
| CON / Concentra Group Holdings Parent, Inc. | 0,39 | 13,72 | 8,06 | 7,79 | 0,0803 | −0,0833 | |||
| LEVI / Levi Strauss & Co. | 0,42 | −11,52 | 7,71 | 4,92 | 0,0768 | −0,0840 | |||
| BWXT / BWX Technologies, Inc. | 0,05 | −46,53 | 7,49 | −21,91 | 0,0746 | −0,1352 | |||
| TXNM / TXNM Energy, Inc. | 0,13 | 7,43 | 0,1595 | 0,1595 | |||||
| ZGN / Ermenegildo Zegna N.V. | 0,87 | −9,20 | 7,40 | 4,92 | 0,0737 | −0,0806 | |||
| MTRN / Materion Corporation | 0,09 | −42,55 | 7,33 | −44,13 | 0,0730 | −0,2139 | |||
| WLY / John Wiley & Sons, Inc. | 0,15 | −18,63 | 6,88 | −18,51 | 0,0685 | −0,1162 | |||
| MTN / Vail Resorts, Inc. | 0,04 | −6,54 | 6,55 | −8,22 | 0,0652 | −0,0909 | |||
| RWT / Redwood Trust, Inc. | 0,00 | −100,00 | 0,00 | 0,0000 | |||||
| NUE / Nucor Corporation | 0,00 | −100,00 | 0,00 | 0,0000 | |||||
| REGN / Regeneron Pharmaceuticals, Inc. | 0,00 | −100,00 | 0,00 | 0,0000 | |||||
| CVX / Chevron Corporation | 0,00 | −100,00 | 0,00 | 0,0000 | |||||
| EFX / Equifax Inc. | 0,00 | −100,00 | 0,00 | 0,0000 | |||||
| CDW / CDW Corporation | 0,00 | −100,00 | 0,00 | 0,0000 | |||||
| PCG / PG&E Corporation | 0,00 | −100,00 | 0,00 | 0,0000 | |||||
| PH / Parker-Hannifin Corporation | 0,00 | −100,00 | 0,00 | 0,0000 | |||||
| MDT / Medtronic plc | 0,00 | −100,00 | 0,00 | −100,00 | −0,9249 | ||||
| AJG / Arthur J. Gallagher & Co. | 0,00 | −100,00 | 0,00 | 0,0000 | |||||
| ASH / Ashland Inc. | 0,00 | −100,00 | 0,00 | 0,0000 | |||||
| HII / Huntington Ingalls Industries, Inc. | 0,00 | −100,00 | 0,00 | 0,0000 | |||||
| FLO / Flowers Foods, Inc. | 0,00 | −100,00 | 0,00 | 0,0000 | |||||
| CHRD / Chord Energy Corporation | 0,00 | −100,00 | 0,00 | 0,0000 | |||||
| WHD / Cactus, Inc. | 0,00 | −100,00 | 0,00 | 0,0000 | |||||
| PRG / PROG Holdings, Inc. | 0,00 | −100,00 | 0,00 | 0,0000 | |||||
| RHI / Robert Half Inc. | 0,00 | −100,00 | 0,00 | 0,0000 | |||||
| OXM / Oxford Industries, Inc. | 0,00 | −100,00 | 0,00 | 0,0000 | |||||
| AME / AMETEK, Inc. | 0,00 | −100,00 | 0,00 | 0,0000 | |||||
| PLD / Prologis, Inc. | 0,00 | −100,00 | 0,00 | 0,0000 | |||||
| ACN / Accenture plc | 0,00 | −100,00 | 0,00 | 0,0000 | |||||
| UNH / UnitedHealth Group Incorporated | 0,00 | −100,00 | 0,00 | 0,0000 | |||||
| PTEN / Patterson-UTI Energy, Inc. | 0,00 | −100,00 | 0,00 | 0,0000 | |||||
| MRVL / Marvell Technology, Inc. | 0,00 | −100,00 | 0,00 | 0,0000 | |||||
| AEP / American Electric Power Company, Inc. | 0,00 | −100,00 | 0,00 | 0,0000 | |||||
| MCK / McKesson Corporation | 0,00 | −100,00 | 0,00 | 0,0000 | |||||
| STAG / STAG Industrial, Inc. | 0,00 | −100,00 | 0,00 | 0,0000 | |||||
| WD / Walker & Dunlop, Inc. | 0,00 | −100,00 | 0,00 | 0,0000 | |||||
| BBY / Best Buy Co., Inc. | 0,00 | −100,00 | 0,00 | 0,0000 | |||||
| MSCI / MSCI Inc. | 0,00 | −100,00 | 0,00 | 0,0000 |