Grundläggande statistik
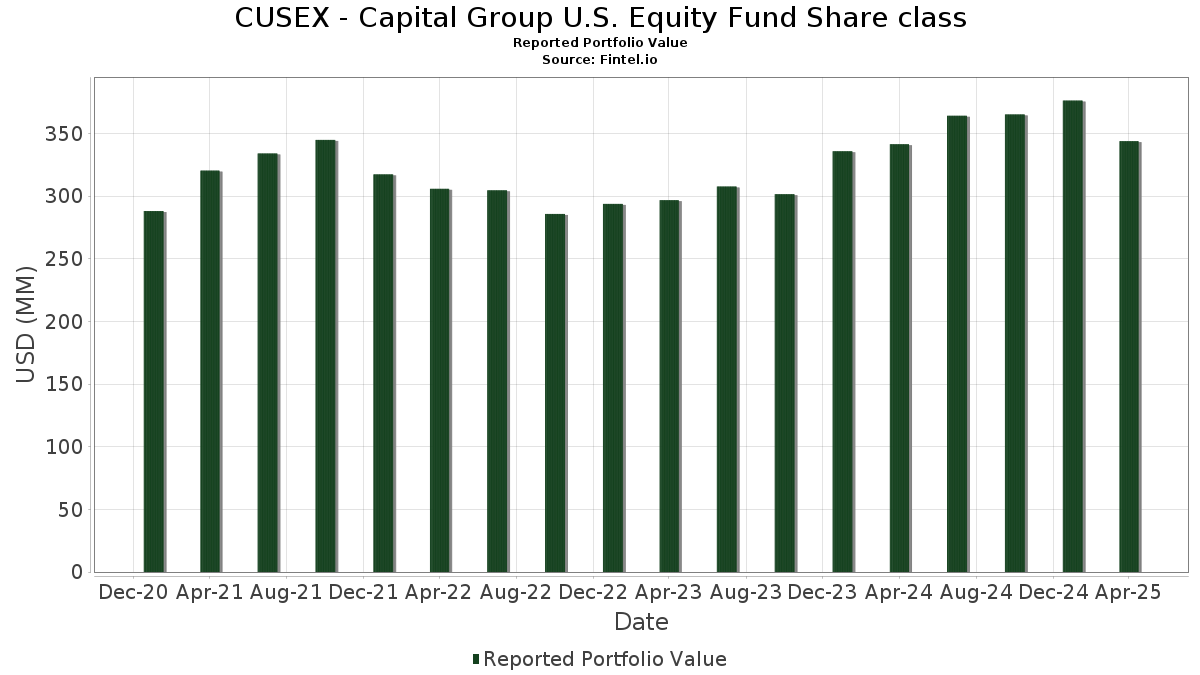
| Portföljvärde | $ 343 965 641 |
| Aktuella positioner | 98 |
Senaste innehav, resultat, förvaltat kapital (från 13F, 13D)
CUSEX - Capital Group U.S. Equity Fund Share class har redovisat 98 totala innehav i sina senaste SEC-arkiveringar. Det senaste portföljvärdet beräknas vara $ 343 965 641 USD. Faktiskt förvaltade tillgångar (AUM) är detta värde plus likvida medel (som inte redovisas). CUSEX - Capital Group U.S. Equity Fund Share classs största innehav är Microsoft Corporation (US:MSFT) , Broadcom Inc. (US:AVGO) , Alphabet Inc. (US:GOOG) , Amazon.com, Inc. (US:AMZN) , and Marsh & McLennan Companies, Inc. (US:MMC) . CUSEX - Capital Group U.S. Equity Fund Share classs nya positioner inkluderar Shopify Inc. (US:SHOP) , The Home Depot, Inc. (US:HD) , The Hershey Company (US:HSY) , Eaton Corporation plc (US:ETN) , and United Rentals, Inc. (IT:1URI) .
Största ökningarna detta kvartal
Vi använder förändringen i portföljallokeringen eftersom det är det mest meningsfulla måttet. Förändringar kan bero på transaktioner eller förändringar i aktiekurser.
| Värdepapper | Aktier (MM) |
Värde (MM$) |
Portfölj % av | ΔPortfölj % av |
|---|---|---|---|---|
| 0,09 | 5,89 | 1,7099 | 1,5007 | |
| 0,01 | 6,61 | 1,9207 | 0,8274 | |
| 0,04 | 7,51 | 2,1819 | 0,6658 | |
| 0,04 | 9,01 | 2,6183 | 0,6470 | |
| 0,02 | 1,65 | 0,4781 | 0,4781 | |
| 0,02 | 3,36 | 0,9776 | 0,4335 | |
| 0,02 | 3,18 | 0,9237 | 0,4011 | |
| 0,05 | 10,95 | 3,1823 | 0,3828 | |
| 0,00 | 1,30 | 0,3791 | 0,3791 | |
| 0,01 | 3,41 | 0,9916 | 0,3564 |
Största minskningarna detta kvartal
Vi använder förändringen i portföljallokeringen eftersom det är det mest meningsfulla måttet. Förändringar kan bero på transaktioner eller förändringar i aktiepriser.
| Värdepapper | Aktier (MM) |
Värde (MM$) |
Portfölj % av | ΔPortfölj % av |
|---|---|---|---|---|
| 0,05 | 9,59 | 2,7848 | −0,9014 | |
| 0,01 | 1,91 | 0,5549 | −0,8058 | |
| 0,04 | 9,42 | 2,7355 | −0,6232 | |
| 0,06 | 11,38 | 3,3048 | −0,5904 | |
| 0,09 | 15,18 | 4,4113 | −0,5781 | |
| 0,10 | 10,07 | 2,9263 | −0,5650 | |
| 0,01 | 1,56 | 0,4519 | −0,4589 | |
| 0,01 | 0,99 | 0,2865 | −0,4125 | |
| 0,03 | 10,71 | 3,1119 | −0,3989 | |
| 0,02 | 8,57 | 2,4911 | −0,3688 |
13F- och fond arkiveringar
Denna blankett lämnades in den 2025-06-26 för rapporteringsperioden 2025-04-30. Klicka på länksymbolen för att se hela transaktionshistoriken.
Uppgradera för att låsa upp premiumdata och exportera till Excel![]() .
.
| Värdepapper | Typ | Genomsnittligt aktiepris | Aktier (MM) |
ΔAktier (%) |
ΔAktier (%) |
Värde ($MM) |
Portfölj (%) |
ΔPortfölj (%) |
|
|---|---|---|---|---|---|---|---|---|---|
| MSFT / Microsoft Corporation | 0,06 | 0,00 | 22,15 | −4,77 | 6,4350 | 0,2551 | |||
| AVGO / Broadcom Inc. | 0,10 | 0,00 | 20,04 | −13,02 | 5,8226 | −0,2992 | |||
| GOOG / Alphabet Inc. | 0,09 | 3,33 | 15,18 | −19,14 | 4,4113 | −0,5781 | |||
| AMZN / Amazon.com, Inc. | 0,06 | 0,00 | 11,38 | −22,41 | 3,3048 | −0,5904 | |||
| MMC / Marsh & McLennan Companies, Inc. | 0,05 | 0,00 | 10,95 | 3,96 | 3,1823 | 0,3828 | |||
| V / Visa Inc. | 0,03 | −19,80 | 10,71 | −18,94 | 3,1119 | −0,3989 | |||
| US14020B1026 / CAPITAL GROUP CENTRAL CASH FUND | 0,10 | −23,32 | 10,07 | −23,34 | 2,9263 | −0,5650 | |||
| AAPL / Apple Inc. | 0,05 | −23,27 | 9,59 | −30,91 | 2,7848 | −0,9014 | |||
| CEG / Constellation Energy Corporation | 0,04 | 0,00 | 9,42 | −25,51 | 2,7355 | −0,6232 | |||
| GE / General Electric Company | 0,04 | 22,69 | 9,01 | 21,47 | 2,6183 | 0,6470 | |||
| META / Meta Platforms, Inc. | 0,02 | 0,00 | 8,57 | −20,34 | 2,4911 | −0,3688 | |||
| LIN / Linde plc | 0,02 | 0,00 | 7,72 | 1,59 | 2,2417 | 0,2237 | |||
| PM / Philip Morris International Inc. | 0,04 | 0,00 | 7,51 | 31,62 | 2,1819 | 0,6658 | |||
| LLY / Eli Lilly and Company | 0,01 | 44,96 | 6,61 | 60,67 | 1,9207 | 0,8274 | |||
| JPM / JPMorgan Chase & Co. | 0,03 | 0,00 | 6,44 | −8,47 | 1,8702 | 0,0012 | |||
| KLAC / KLA Corporation | 0,01 | 18,06 | 5,93 | 12,38 | 1,7226 | 0,3207 | |||
| MDLZ / Mondelez International, Inc. | 0,09 | 536,12 | 5,89 | 647,78 | 1,7099 | 1,5007 | |||
| WCN / Waste Connections, Inc. | 0,03 | 0,00 | 5,00 | 7,52 | 1,4538 | 0,2175 | |||
| GEV / GE Vernova Inc. | 0,01 | 14,75 | 4,97 | 14,11 | 1,4427 | 0,2865 | |||
| CRM / Salesforce, Inc. | 0,02 | 0,00 | 4,66 | −21,37 | 1,3550 | −0,2208 | |||
| TDG / TransDigm Group Incorporated | 0,00 | 0,00 | 4,63 | 4,42 | 1,3466 | 0,1671 | |||
| ABT / Abbott Laboratories | 0,03 | −15,22 | 4,42 | −13,36 | 1,2856 | −0,0713 | |||
| UNH / UnitedHealth Group Incorporated | 0,01 | 0,00 | 4,22 | −24,15 | 1,2252 | −0,2522 | |||
| NOW / ServiceNow, Inc. | 0,00 | 0,00 | 4,16 | −6,24 | 1,2092 | 0,0300 | |||
| COP / ConocoPhillips | 0,04 | 0,00 | 3,74 | −9,83 | 1,0853 | −0,0154 | |||
| RTX / RTX Corporation | 0,03 | 0,00 | 3,65 | −2,20 | 1,0606 | 0,0690 | |||
| RCL / Royal Caribbean Cruises Ltd. | 0,02 | 3,93 | 3,61 | −16,24 | 1,0494 | −0,0962 | |||
| CMG / Chipotle Mexican Grill, Inc. | 0,07 | −17,51 | 3,43 | −28,57 | 0,9968 | −0,2796 | |||
| ELV / Elevance Health, Inc. | 0,01 | 34,33 | 3,41 | 42,80 | 0,9916 | 0,3564 | |||
| ATO / Atmos Energy Corporation | 0,02 | 45,79 | 3,36 | 64,34 | 0,9776 | 0,4335 | |||
| REGN / Regeneron Pharmaceuticals, Inc. | 0,01 | 6,75 | 3,36 | −5,03 | 0,9769 | 0,0362 | |||
| PGR / The Progressive Corporation | 0,01 | 0,00 | 3,33 | 14,34 | 0,9682 | 0,1937 | |||
| AJG / Arthur J. Gallagher & Co. | 0,01 | 0,00 | 3,20 | 6,27 | 0,9300 | 0,1295 | |||
| WELL / Welltower Inc. | 0,02 | 44,56 | 3,18 | 61,62 | 0,9237 | 0,4011 | |||
| PAYX / Paychex, Inc. | 0,02 | 46,97 | 3,04 | 46,44 | 0,8842 | 0,3319 | |||
| DHR / Danaher Corporation | 0,01 | −20,40 | 2,96 | −28,76 | 0,8585 | −0,2437 | |||
| ABBV / AbbVie Inc. | 0,01 | −30,12 | 2,84 | −25,86 | 0,8247 | −0,1926 | |||
| ACN / Accenture plc | 0,01 | −8,60 | 2,78 | −28,99 | 0,8087 | −0,2326 | |||
| LII / Lennox International Inc. | 0,00 | 0,00 | 2,71 | −7,70 | 0,7868 | 0,0071 | |||
| ETR / Entergy Corporation | 0,03 | 0,00 | 2,62 | 2,59 | 0,7608 | 0,0825 | |||
| NOC / Northrop Grumman Corporation | 0,01 | 0,00 | 2,54 | −0,16 | 0,7375 | 0,0620 | |||
| TFC / Truist Financial Corporation | 0,07 | 14,57 | 2,54 | −7,75 | 0,7367 | 0,0063 | |||
| CHD / Church & Dwight Co., Inc. | 0,02 | 0,00 | 2,44 | −5,86 | 0,7103 | 0,0203 | |||
| ARMK / Aramark | 0,07 | 0,00 | 2,40 | −14,09 | 0,6983 | −0,0450 | |||
| TSCO / Tractor Supply Company | 0,05 | 0,00 | 2,34 | −6,86 | 0,6787 | 0,0121 | |||
| TXN / Texas Instruments Incorporated | 0,01 | 78,98 | 2,31 | 55,21 | 0,6706 | 0,2754 | |||
| TSM / Taiwan Semiconductor Manufacturing Company Limited - Depositary Receipt (Common Stock) | 0,01 | 0,00 | 2,27 | −20,37 | 0,6591 | −0,0978 | |||
| AMGN / Amgen Inc. | 0,01 | 74,46 | 2,26 | 77,91 | 0,6575 | 0,3193 | |||
| IR / Ingersoll Rand Inc. | 0,03 | −24,47 | 2,22 | −39,25 | 0,6439 | −0,3256 | |||
| KKR / KKR & Co. Inc. | 0,02 | 50,81 | 2,14 | 3,18 | 0,6229 | 0,0706 | |||
| ATI / ATI Inc. | 0,04 | 0,00 | 2,08 | −4,77 | 0,6031 | 0,0241 | |||
| FDX / FedEx Corporation | 0,01 | 0,00 | 1,94 | −20,60 | 0,5624 | −0,0853 | |||
| MU / Micron Technology, Inc. | 0,02 | 0,00 | 1,92 | −15,69 | 0,5578 | −0,0471 | |||
| TEAM / Atlassian Corporation | 0,01 | −49,88 | 1,91 | −62,70 | 0,5549 | −0,8058 | |||
| TJX / The TJX Companies, Inc. | 0,01 | 0,00 | 1,86 | 3,10 | 0,5417 | 0,0613 | |||
| MA / Mastercard Incorporated | 0,00 | 0,00 | 1,78 | −1,33 | 0,5159 | 0,0377 | |||
| MS / Morgan Stanley | 0,01 | 0,00 | 1,73 | −16,62 | 0,5016 | −0,0486 | |||
| CNP / CenterPoint Energy, Inc. | 0,04 | 0,00 | 1,70 | 19,07 | 0,4935 | 0,1144 | |||
| NVDA / NVIDIA Corporation | 0,02 | 0,00 | 1,69 | −9,24 | 0,4907 | −0,0040 | |||
| NFLX / Netflix, Inc. | 0,00 | 0,00 | 1,67 | 15,85 | 0,4866 | 0,1025 | |||
| SRE / Sempra | 0,02 | 0,00 | 1,66 | −10,45 | 0,4832 | −0,0102 | |||
| SHOP / Shopify Inc. | 0,02 | 1,65 | 0,4781 | 0,4781 | |||||
| PNC / The PNC Financial Services Group, Inc. | 0,01 | 0,00 | 1,64 | −20,02 | 0,4760 | −0,0684 | |||
| SAFRY / Safran SA - Depositary Receipt (Common Stock) | 0,02 | 0,00 | 1,64 | 8,34 | 0,4755 | 0,0742 | |||
| SPGI / S&P Global Inc. | 0,00 | 0,00 | 1,57 | −4,10 | 0,4555 | 0,0211 | |||
| AMAT / Applied Materials, Inc. | 0,01 | −45,70 | 1,56 | −54,63 | 0,4519 | −0,4589 | |||
| AZN / AstraZeneca PLC - Depositary Receipt (Common Stock) | 0,02 | 0,00 | 1,55 | 1,50 | 0,4512 | 0,0445 | |||
| CHTR / Charter Communications, Inc. | 0,00 | −16,38 | 1,54 | −5,12 | 0,4469 | 0,0160 | |||
| MAR / Marriott International, Inc. | 0,01 | 0,00 | 1,52 | −17,91 | 0,4410 | −0,0502 | |||
| EFX / Equifax Inc. | 0,01 | 0,00 | 1,47 | −5,35 | 0,4268 | 0,0145 | |||
| TTWO / Take-Two Interactive Software, Inc. | 0,01 | −40,26 | 1,43 | −24,86 | 0,4147 | −0,0901 | |||
| SHW / The Sherwin-Williams Company | 0,00 | 0,00 | 1,41 | −1,47 | 0,4084 | 0,0294 | |||
| HLT / Hilton Worldwide Holdings Inc. | 0,01 | 0,00 | 1,37 | −11,95 | 0,3982 | −0,0154 | |||
| JKHY / Jack Henry & Associates, Inc. | 0,01 | −26,22 | 1,35 | −26,49 | 0,3935 | −0,0961 | |||
| VRTX / Vertex Pharmaceuticals Incorporated | 0,00 | 1,30 | 0,3791 | 0,3791 | |||||
| BURL / Burlington Stores, Inc. | 0,01 | 0,00 | 1,13 | −20,77 | 0,3294 | −0,0507 | |||
| TOST / Toast, Inc. | 0,03 | 0,00 | 1,12 | −13,09 | 0,3262 | −0,0169 | |||
| PCG / PG&E Corporation | 0,07 | 0,00 | 1,12 | 5,59 | 0,3240 | 0,0433 | |||
| HD / The Home Depot, Inc. | 0,00 | 1,09 | 0,3171 | 0,3171 | |||||
| MSCI / MSCI Inc. | 0,00 | 0,00 | 1,06 | −8,65 | 0,3069 | −0,0004 | |||
| HSY / The Hershey Company | 0,01 | 1,02 | 0,2976 | 0,2976 | |||||
| AME / AMETEK, Inc. | 0,01 | −59,21 | 0,99 | −62,51 | 0,2865 | −0,4125 | |||
| YUM / Yum! Brands, Inc. | 0,01 | 0,00 | 0,96 | 15,26 | 0,2787 | 0,0576 | |||
| DRI / Darden Restaurants, Inc. | 0,00 | 0,00 | 0,95 | 2,70 | 0,2768 | 0,0305 | |||
| AON / Aon plc | 0,00 | 0,00 | 0,93 | −4,24 | 0,2690 | 0,0119 | |||
| ETN / Eaton Corporation plc | 0,00 | 0,92 | 0,2671 | 0,2671 | |||||
| XOM / Exxon Mobil Corporation | 0,01 | −33,15 | 0,86 | −33,92 | 0,2502 | −0,0960 | |||
| BMY / Bristol-Myers Squibb Company | 0,02 | 0,00 | 0,82 | −14,89 | 0,2393 | −0,0177 | |||
| DFS / Discover Financial Services | 0,00 | −39,08 | 0,81 | −44,68 | 0,2358 | −0,1539 | |||
| CSX / CSX Corporation | 0,03 | −9,28 | 0,78 | −22,53 | 0,2259 | −0,0408 | |||
| APD / Air Products and Chemicals, Inc. | 0,00 | 11,89 | 0,77 | −9,47 | 0,2223 | −0,0024 | |||
| 1URI / United Rentals, Inc. | 0,00 | 0,76 | 0,2222 | 0,2222 | |||||
| CDAY / Ceridian HCM Holding Inc. | 0,01 | 0,66 | 0,1914 | 0,1914 | |||||
| CARR / Carrier Global Corporation | 0,01 | 0,00 | 0,63 | −4,24 | 0,1837 | 0,0081 | |||
| HEIA / Heico Corp. - Class A | 0,00 | 0,00 | 0,58 | 5,61 | 0,1697 | 0,0227 | |||
| HEI / HEICO Corporation | 0,00 | 0,00 | 0,58 | 5,05 | 0,1695 | 0,0218 | |||
| SAIA / Saia, Inc. | 0,00 | 0,00 | 0,30 | −49,25 | 0,0885 | −0,0708 | |||
| SRPT / Sarepta Therapeutics, Inc. | 0,00 | 0,00 | 0,27 | −45,31 | 0,0781 | −0,0521 | |||
| CMCSA / Comcast Corporation | 0,00 | −100,00 | 0,00 | −100,00 | −0,2091 |