Grundläggande statistik
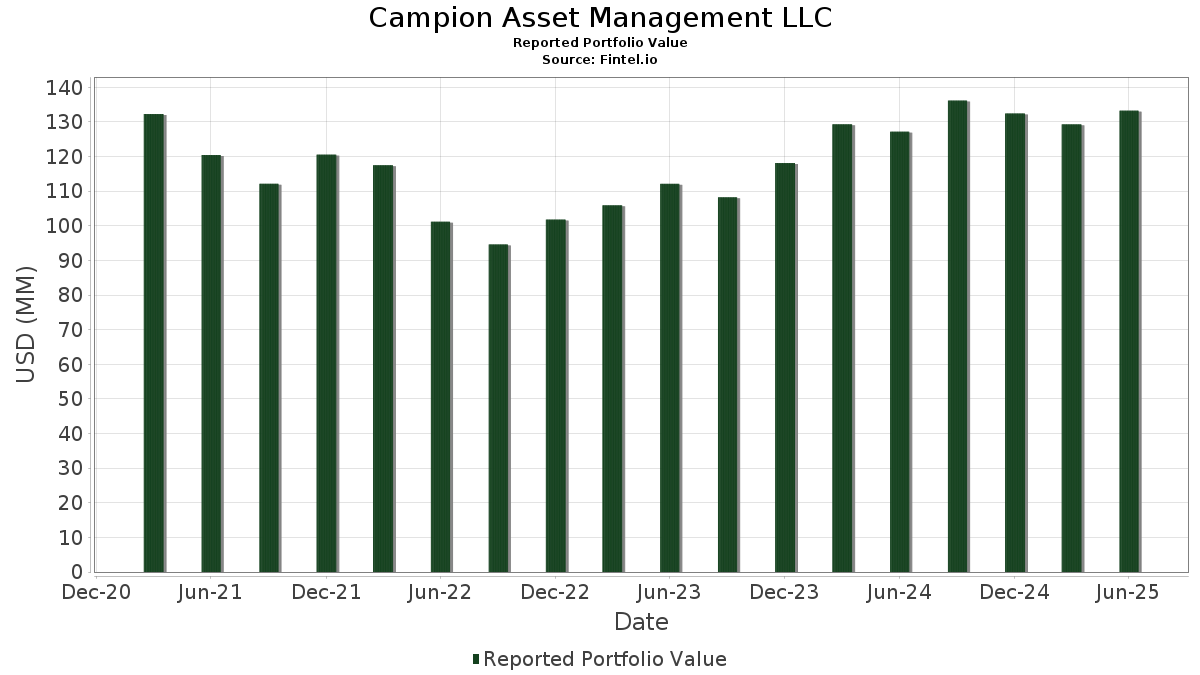
| Portföljvärde | $ 133 254 828 |
| Aktuella positioner | 80 |
Senaste innehav, resultat, förvaltat kapital (från 13F, 13D)
Campion Asset Management LLC har redovisat 80 totala innehav i sina senaste SEC-arkiveringar. Det senaste portföljvärdet beräknas vara $ 133 254 828 USD. Faktiskt förvaltade tillgångar (AUM) är detta värde plus likvida medel (som inte redovisas). Campion Asset Management LLCs största innehav är iShares Trust - iShares Russell 1000 ETF (US:IWB) , iShares Trust - iShares Core S&P Mid-Cap ETF (US:IJH) , iShares Trust - iShares Core S&P 500 ETF (US:IVV) , iShares Trust - iShares Russell Mid-Cap ETF (US:IWR) , and Vanguard Tax-Managed Funds - Vanguard FTSE Developed Markets ETF (US:VEA) . Campion Asset Management LLCs nya positioner inkluderar SPDR Series Trust - SPDR S&P Aerospace & Defense ETF (US:XAR) , Meta Platforms, Inc. (MX:META) , .
Största ökningarna detta kvartal
Vi använder förändringen i portföljallokeringen eftersom det är det mest meningsfulla måttet. Förändringar kan bero på transaktioner eller förändringar i aktiekurser.
| Värdepapper | Aktier (MM) |
Värde (MM$) |
Portfölj % av | ΔPortfölj % av |
|---|---|---|---|---|
| 0,02 | 10,75 | 8,0702 | 1,0342 | |
| 0,18 | 11,26 | 8,4488 | 0,8197 | |
| 0,15 | 8,55 | 6,4196 | 0,6629 | |
| 0,01 | 2,77 | 2,0765 | 0,4615 | |
| 0,03 | 3,81 | 2,8621 | 0,4506 | |
| 0,03 | 11,30 | 8,4795 | 0,4184 | |
| 0,11 | 9,69 | 7,2718 | 0,2815 | |
| 0,00 | 0,81 | 0,6102 | 0,2282 | |
| 0,00 | 0,90 | 0,6784 | 0,2070 | |
| 0,02 | 2,98 | 2,2340 | 0,1944 |
Största minskningarna detta kvartal
Vi använder förändringen i portföljallokeringen eftersom det är det mest meningsfulla måttet. Förändringar kan bero på transaktioner eller förändringar i aktiepriser.
| Värdepapper | Aktier (MM) |
Värde (MM$) |
Portfölj % av | ΔPortfölj % av |
|---|---|---|---|---|
| 0,02 | 3,60 | 2,6984 | −0,4426 | |
| 0,02 | 1,90 | 1,4283 | −0,2303 | |
| 0,00 | 2,32 | 1,7421 | −0,2073 | |
| 0,08 | 6,78 | 5,0917 | −0,1977 | |
| 0,01 | 0,89 | 0,6706 | −0,1597 | |
| 0,01 | 1,48 | 1,1072 | −0,1485 | |
| 0,01 | 0,76 | 0,5731 | −0,1151 | |
| 0,01 | 0,53 | 0,3966 | −0,1056 | |
| 0,00 | 0,96 | 0,7203 | −0,0997 | |
| 0,01 | 0,78 | 0,5823 | −0,0835 |
13F- och fond arkiveringar
Denna blankett lämnades in den 2025-07-17 för rapporteringsperioden 2025-06-30. Klicka på länksymbolen för att se hela transaktionshistoriken.
Uppgradera för att låsa upp premiumdata och exportera till Excel![]() .
.
| Värdepapper | Typ | Genomsnittligt aktiepris | Aktier (MM) |
ΔAktier (%) |
ΔAktier (%) |
Värde ($MM) |
Portfölj (%) |
ΔPortfölj (%) |
|
|---|---|---|---|---|---|---|---|---|---|
| IWB / iShares Trust - iShares Russell 1000 ETF | 0,03 | −2,07 | 11,30 | 8,40 | 8,4795 | 0,4184 | |||
| IJH / iShares Trust - iShares Core S&P Mid-Cap ETF | 0,18 | 7,38 | 11,26 | 14,13 | 8,4488 | 0,8197 | |||
| IVV / iShares Trust - iShares Core S&P 500 ETF | 0,02 | 6,97 | 10,75 | 18,20 | 8,0702 | 1,0342 | |||
| IWR / iShares Trust - iShares Russell Mid-Cap ETF | 0,11 | −0,84 | 9,69 | 7,20 | 7,2718 | 0,2815 | |||
| VEA / Vanguard Tax-Managed Funds - Vanguard FTSE Developed Markets ETF | 0,15 | 2,47 | 8,55 | 14,93 | 6,4196 | 0,6629 | |||
| LMT / Lockheed Martin Corporation | 0,02 | 0,00 | 8,05 | 3,67 | 6,0409 | 0,0362 | |||
| VNQ / Vanguard Specialized Funds - Vanguard Real Estate ETF | 0,08 | 0,86 | 6,78 | −0,80 | 5,0917 | −0,1977 | |||
| IJR / iShares Trust - iShares Core S&P Small-Cap ETF | 0,04 | 4,67 | 4,26 | 9,39 | 3,1991 | 0,1853 | |||
| IGM / iShares Trust - iShares Expanded Tech Sector ETF | 0,03 | −1,28 | 3,81 | 22,29 | 2,8621 | 0,4506 | |||
| AAPL / Apple Inc. | 0,02 | −4,15 | 3,60 | −11,48 | 2,6984 | −0,4426 | |||
| IWM / iShares Trust - iShares Russell 2000 ETF | 0,02 | 0,52 | 3,45 | 8,74 | 2,5855 | 0,1350 | |||
| IJJ / iShares Trust - iShares S&P Mid-Cap 400 Value ETF | 0,03 | −1,18 | 3,42 | 2,00 | 2,5629 | −0,0267 | |||
| VERSX / Vanguard Emerging Markets Stock Index Fund | 0,07 | 0,96 | 3,39 | 10,31 | 2,5453 | 0,1678 | |||
| VOX / Vanguard World Fund - Vanguard Communication Services ETF | 0,02 | −2,06 | 2,98 | 12,86 | 2,2340 | 0,1944 | |||
| MSFT / Microsoft Corporation | 0,01 | 0,00 | 2,77 | 32,52 | 2,0765 | 0,4615 | |||
| LLY / Eli Lilly and Company | 0,00 | −2,42 | 2,32 | −7,90 | 1,7421 | −0,2073 | |||
| XOM / Exxon Mobil Corporation | 0,02 | −2,09 | 1,90 | −11,24 | 1,4283 | −0,2303 | |||
| GJR / Strats Trust For Procter & Gambel Security - Preferred Security | 0,01 | −2,80 | 1,48 | −9,12 | 1,1072 | −0,1485 | |||
| EFV / iShares Trust - iShares MSCI EAFE Value ETF | 0,02 | 0,00 | 1,39 | 7,69 | 1,0407 | 0,0449 | |||
| JPM / JPMorgan Chase & Co. | 0,00 | −3,80 | 1,35 | 13,72 | 1,0143 | 0,0949 | |||
| EMXC / iShares, Inc. - iShares MSCI Emerging Markets ex China ETF | 0,02 | 0,82 | 1,22 | 15,57 | 0,9133 | 0,0987 | |||
| V / Visa Inc. | 0,00 | −1,96 | 1,06 | −0,65 | 0,7985 | −0,0300 | |||
| IJS / iShares Trust - iShares S&P Small-Cap 600 Value ETF | 0,01 | −1,64 | 1,04 | 0,38 | 0,7830 | −0,0208 | |||
| CSCO / Cisco Systems, Inc. | 0,01 | −0,25 | 0,99 | 12,15 | 0,7419 | 0,0601 | |||
| RTX / RTX Corporation | 0,01 | −3,57 | 0,98 | 6,31 | 0,7339 | 0,0224 | |||
| BRK.B / Berkshire Hathaway Inc. | 0,00 | −0,75 | 0,96 | −9,53 | 0,7203 | −0,0997 | |||
| ORCL / Oracle Corporation | 0,00 | −5,16 | 0,90 | 48,44 | 0,6784 | 0,2070 | |||
| CVX / Chevron Corporation | 0,01 | −2,76 | 0,89 | −16,78 | 0,6706 | −0,1597 | |||
| AVGO / Broadcom Inc. | 0,00 | 0,00 | 0,81 | 64,91 | 0,6102 | 0,2282 | |||
| JNJ / Johnson & Johnson | 0,01 | −2,14 | 0,78 | −9,88 | 0,5823 | −0,0835 | |||
| MAA / Mid-America Apartment Communities, Inc. | 0,01 | −2,82 | 0,76 | −14,17 | 0,5731 | −0,1151 | |||
| GOOGL / Alphabet Inc. | 0,00 | −0,76 | 0,74 | 13,08 | 0,5521 | 0,0490 | |||
| VOO / Vanguard Index Funds - Vanguard S&P 500 ETF | 0,00 | 15,73 | 0,72 | 27,96 | 0,5426 | 0,1055 | |||
| MCD / McDonald's Corporation | 0,00 | 0,00 | 0,64 | −6,59 | 0,4795 | −0,0488 | |||
| ABT / Abbott Laboratories | 0,00 | −4,43 | 0,63 | −2,02 | 0,4736 | −0,0245 | |||
| UNM / Unum Group | 0,01 | 0,00 | 0,63 | −0,94 | 0,4727 | −0,0187 | |||
| SYK / Stryker Corporation | 0,00 | −0,65 | 0,61 | 5,57 | 0,4557 | 0,0109 | |||
| TXN / Texas Instruments Incorporated | 0,00 | 0,00 | 0,59 | 15,52 | 0,4417 | 0,0477 | |||
| VZ / Verizon Communications Inc. | 0,01 | −3,20 | 0,56 | −7,55 | 0,4225 | −0,0490 | |||
| EXC / Exelon Corporation | 0,01 | −2,10 | 0,53 | −7,84 | 0,3977 | −0,0466 | |||
| PSA / Public Storage | 0,00 | −0,17 | 0,53 | −2,22 | 0,3977 | −0,0211 | |||
| COP / ConocoPhillips | 0,01 | −4,75 | 0,53 | −18,64 | 0,3966 | −0,1056 | |||
| NOC / Northrop Grumman Corporation | 0,00 | −0,95 | 0,52 | −3,33 | 0,3932 | −0,0257 | |||
| AMGN / Amgen Inc. | 0,00 | −3,69 | 0,50 | −13,60 | 0,3769 | −0,0731 | |||
| NVDD / Direxion Shares ETF Trust - Direxion Daily NVDA Bear 1X Shares | 0,00 | 0,00 | 0,49 | 46,11 | 0,3664 | 0,1074 | |||
| XLY / The Select Sector SPDR Trust - The Consumer Discretionary Select Sector SPDR Fund | 0,00 | −0,04 | 0,49 | 9,93 | 0,3661 | 0,0232 | |||
| ALL / The Allstate Corporation | 0,00 | −3,42 | 0,48 | −6,21 | 0,3630 | −0,0354 | |||
| AMZN / Amazon.com, Inc. | 0,00 | 0,46 | 0,48 | 15,87 | 0,3624 | 0,0400 | |||
| WFC / Wells Fargo & Company | 0,01 | −6,37 | 0,48 | 4,58 | 0,3606 | 0,0050 | |||
| WMT / Walmart Inc. | 0,00 | −0,61 | 0,48 | 10,85 | 0,3604 | 0,0249 | |||
| PSX / Phillips 66 | 0,00 | −1,38 | 0,48 | −4,58 | 0,3595 | −0,0293 | |||
| CI / The Cigna Group | 0,00 | −3,04 | 0,47 | −2,47 | 0,3560 | −0,0206 | |||
| DUK / Duke Energy Corporation | 0,00 | −3,73 | 0,45 | −6,83 | 0,3378 | −0,0360 | |||
| MRK / Merck & Co., Inc. | 0,01 | −2,39 | 0,44 | −14,03 | 0,3271 | −0,0645 | |||
| SO / The Southern Company | 0,00 | −0,25 | 0,41 | −0,49 | 0,3076 | −0,0106 | |||
| TM / Toyota Motor Corporation - Depositary Receipt (Common Stock) | 0,00 | −4,22 | 0,40 | −6,51 | 0,3021 | −0,0310 | |||
| BR / Broadridge Financial Solutions, Inc. | 0,00 | 0,00 | 0,38 | 0,26 | 0,2854 | −0,0080 | |||
| IWD / iShares Trust - iShares Russell 1000 Value ETF | 0,00 | 0,00 | 0,38 | 3,29 | 0,2832 | 0,0005 | |||
| IBM / International Business Machines Corporation | 0,00 | 0,00 | 0,37 | 18,41 | 0,2805 | 0,0367 | |||
| XLE / The Select Sector SPDR Trust - The Energy Select Sector SPDR Fund | 0,00 | −2,76 | 0,37 | −11,82 | 0,2805 | −0,0471 | |||
| ELV / Elevance Health, Inc. | 0,00 | −2,14 | 0,36 | −12,56 | 0,2671 | −0,0474 | |||
| NSC / Norfolk Southern Corporation | 0,00 | −0,23 | 0,34 | 7,72 | 0,2520 | 0,0111 | |||
| ZTS / Zoetis Inc. | 0,00 | −4,60 | 0,32 | −9,52 | 0,2425 | −0,0341 | |||
| IVE / iShares Trust - iShares S&P 500 Value ETF | 0,00 | −2,96 | 0,32 | −0,31 | 0,2402 | −0,0086 | |||
| GOOG / Alphabet Inc. | 0,00 | 0,00 | 0,32 | 13,62 | 0,2383 | 0,0220 | |||
| IYW / iShares Trust - iShares U.S. Technology ETF | 0,00 | 0,00 | 0,31 | 23,41 | 0,2341 | 0,0385 | |||
| STAG / STAG Industrial, Inc. | 0,01 | −0,15 | 0,31 | 0,32 | 0,2323 | −0,0064 | |||
| D / Dominion Energy, Inc. | 0,01 | −3,77 | 0,29 | −3,03 | 0,2164 | −0,0135 | |||
| APD / Air Products and Chemicals, Inc. | 0,00 | 0,00 | 0,28 | −4,38 | 0,2138 | −0,0166 | |||
| PPL / PPL Corporation | 0,01 | −6,02 | 0,28 | −11,82 | 0,2077 | −0,0350 | |||
| UNP / Union Pacific Corporation | 0,00 | 0,00 | 0,28 | −2,47 | 0,2072 | −0,0121 | |||
| MMM / 3M Company | 0,00 | −9,21 | 0,27 | −5,96 | 0,2015 | −0,0192 | |||
| LYB / LyondellBasell Industries N.V. | 0,00 | −3,64 | 0,26 | −20,73 | 0,1954 | −0,0589 | |||
| URI / United Rentals, Inc. | 0,00 | 0,00 | 0,26 | 19,91 | 0,1951 | 0,0278 | |||
| IWV / iShares Trust - iShares Russell 3000 ETF | 0,00 | −1,14 | 0,24 | 9,46 | 0,1827 | 0,0104 | |||
| O / Realty Income Corporation | 0,00 | 0,00 | 0,24 | −0,82 | 0,1815 | −0,0068 | |||
| MLM / Martin Marietta Materials, Inc. | 0,00 | 0,00 | 0,24 | 14,98 | 0,1792 | 0,0184 | |||
| BAC / Bank of America Corporation | 0,00 | −10,48 | 0,23 | 1,80 | 0,1696 | −0,0026 | |||
| XAR / SPDR Series Trust - SPDR S&P Aerospace & Defense ETF | 0,00 | 0,22 | 0,1651 | 0,1651 | |||||
| META / Meta Platforms, Inc. | 0,00 | 0,20 | 0,1523 | 0,1523 | |||||
| MSTR / Strategy Inc | 0,00 | −100,00 | 0,00 | 0,0000 | |||||
| UNH / UnitedHealth Group Incorporated | 0,00 | −100,00 | 0,00 | 0,0000 | |||||
| GIS / General Mills, Inc. | 0,00 | −100,00 | 0,00 | 0,0000 | |||||
| ARKB / ARK 21Shares Bitcoin ETF | 0,00 | −100,00 | 0,00 | 0,0000 | |||||
| LTC / LTC Properties, Inc. | 0,00 | −100,00 | 0,00 | 0,0000 |