Grundläggande statistik
| Portföljvärde | $ 1 255 256 485 |
| Aktuella positioner | 106 |
Senaste innehav, resultat, förvaltat kapital (från 13F, 13D)
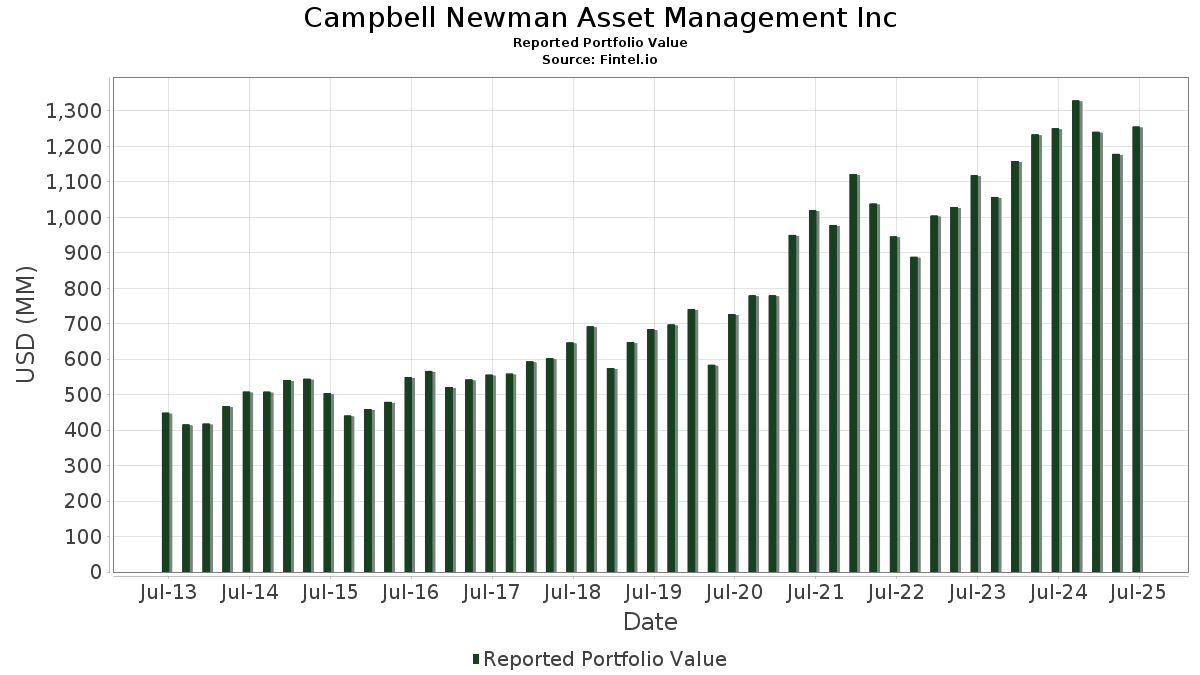
Campbell Newman Asset Management Inc har redovisat 106 totala innehav i sina senaste SEC-arkiveringar. Det senaste portföljvärdet beräknas vara $ 1 255 256 485 USD. Faktiskt förvaltade tillgångar (AUM) är detta värde plus likvida medel (som inte redovisas). Campbell Newman Asset Management Incs största innehav är Microsoft Corporation (US:MSFT) , Broadcom Inc. (US:AVGO) , Apple Inc. (US:AAPL) , KLA Corporation (US:KLAC) , and Amphenol Corporation (US:APH) . Campbell Newman Asset Management Incs nya positioner inkluderar Primo Brands Corporation (US:PRMB) , Skyward Specialty Insurance Group, Inc. (US:SKWD) , Knife River Corporation (US:KNF) , Trane Technologies plc (US:TT) , and Motorola Solutions, Inc. (US:MSI) .
Största ökningarna detta kvartal
Vi använder förändringen i portföljallokeringen eftersom det är det mest meningsfulla måttet. Förändringar kan bero på transaktioner eller förändringar i aktiekurser.
| Värdepapper | Aktier (MM) |
Värde (MM$) |
Portfölj % av | ΔPortfölj % av |
|---|---|---|---|---|
| 0,45 | 44,39 | 3,5363 | 2,0278 | |
| 0,06 | 22,41 | 1,7851 | 1,7851 | |
| 0,25 | 69,45 | 5,5325 | 1,6516 | |
| 0,18 | 89,41 | 7,1231 | 1,2069 | |
| 0,36 | 37,66 | 3,0000 | 1,0299 | |
| 0,17 | 35,29 | 2,8115 | 0,9007 | |
| 0,33 | 29,89 | 2,3812 | 0,8312 | |
| 0,06 | 54,81 | 4,3664 | 0,7268 | |
| 0,24 | 32,44 | 2,5841 | 0,2313 | |
| 0,13 | 29,85 | 2,3777 | 0,1712 |
Största minskningarna detta kvartal
Vi använder förändringen i portföljallokeringen eftersom det är det mest meningsfulla måttet. Förändringar kan bero på transaktioner eller förändringar i aktiepriser.
| Värdepapper | Aktier (MM) |
Värde (MM$) |
Portfölj % av | ΔPortfölj % av |
|---|---|---|---|---|
| 0,00 | 0,00 | −2,0298 | ||
| 0,04 | 31,96 | 2,5458 | −1,3300 | |
| 0,14 | 23,29 | 1,8553 | −1,1684 | |
| 0,34 | 69,33 | 5,5232 | −1,0276 | |
| 0,12 | 38,70 | 3,0827 | −0,5932 | |
| 0,16 | 29,45 | 2,3464 | −0,5712 | |
| 0,14 | 31,28 | 2,4921 | −0,4062 | |
| 0,00 | 0,22 | 0,0175 | −0,3660 | |
| 0,12 | 43,95 | 3,5016 | −0,3060 | |
| 0,08 | 43,32 | 3,4508 | −0,2624 |
13F- och fond arkiveringar
Denna blankett lämnades in den 2025-07-17 för rapporteringsperioden 2025-06-30. Klicka på länksymbolen för att se hela transaktionshistoriken.
Uppgradera för att låsa upp premiumdata och exportera till Excel![]() .
.
| Värdepapper | Typ | Genomsnittligt aktiepris | Aktier (MM) |
ΔAktier (%) |
ΔAktier (%) |
Värde ($MM) |
Portfölj (%) |
ΔPortfölj (%) |
|
|---|---|---|---|---|---|---|---|---|---|
| MSFT / Microsoft Corporation | 0,18 | −3,22 | 89,41 | 28,23 | 7,1231 | 1,2069 | |||
| AVGO / Broadcom Inc. | 0,25 | −7,78 | 69,45 | 51,83 | 5,5325 | 1,6516 | |||
| AAPL / Apple Inc. | 0,34 | −2,78 | 69,33 | −10,20 | 5,5232 | −1,0276 | |||
| KLAC / KLA Corporation | 0,06 | −3,03 | 54,81 | 27,77 | 4,3664 | 0,7268 | |||
| APH / Amphenol Corporation | 0,45 | 65,83 | 44,39 | 149,68 | 3,5363 | 2,0278 | |||
| V / Visa Inc. | 0,12 | −3,32 | 43,95 | −2,05 | 3,5016 | −0,3060 | |||
| MA / Mastercard Incorporated | 0,08 | −3,45 | 43,32 | −1,02 | 3,4508 | −0,2624 | |||
| SYK / Stryker Corporation | 0,10 | −3,73 | 40,73 | 2,31 | 3,2448 | −0,1329 | |||
| AJG / Arthur J. Gallagher & Co. | 0,12 | −3,67 | 38,70 | −10,68 | 3,0827 | −0,5932 | |||
| ICE / Intercontinental Exchange, Inc. | 0,21 | −3,62 | 38,49 | 2,50 | 3,0662 | −0,1197 | |||
| WEC / WEC Energy Group, Inc. | 0,36 | 69,62 | 37,66 | 62,18 | 3,0000 | 1,0299 | |||
| TXN / Texas Instruments Incorporated | 0,17 | 35,64 | 35,29 | 56,71 | 2,8115 | 0,9007 | |||
| J / Jacobs Solutions Inc. | 0,25 | −2,12 | 32,74 | 6,43 | 2,6080 | −0,0018 | |||
| EMR / Emerson Electric Co. | 0,24 | −3,81 | 32,44 | 16,98 | 2,5841 | 0,2313 | |||
| LLY / Eli Lilly and Company | 0,04 | −25,88 | 31,96 | −30,04 | 2,5458 | −1,3300 | |||
| ABT / Abbott Laboratories | 0,23 | −3,13 | 31,86 | −0,68 | 2,5381 | −0,1836 | |||
| RTX / RTX Corporation | 0,21 | −3,53 | 31,35 | 6,34 | 2,4976 | −0,0039 | |||
| LOW / Lowe's Companies, Inc. | 0,14 | −3,73 | 31,28 | −8,42 | 2,4921 | −0,4062 | |||
| NDAQ / Nasdaq, Inc. | 0,33 | 38,81 | 29,89 | 63,62 | 2,3812 | 0,8312 | |||
| ADI / Analog Devices, Inc. | 0,13 | −2,76 | 29,85 | 14,77 | 2,3777 | 0,1712 | |||
| ABBV / AbbVie Inc. | 0,16 | −3,32 | 29,45 | −14,35 | 2,3464 | −0,5712 | |||
| TEL / TE Connectivity plc | 0,14 | −45,25 | 23,29 | −34,65 | 1,8553 | −1,1684 | |||
| MCO / Moody's Corporation | 0,05 | −3,45 | 22,82 | 3,99 | 1,8179 | −0,0440 | |||
| ETN / Eaton Corporation plc | 0,06 | 22,41 | 1,7851 | 1,7851 | |||||
| HON / Honeywell International Inc. | 0,08 | −3,76 | 18,73 | 5,85 | 1,4919 | −0,0093 | |||
| CTSH / Cognizant Technology Solutions Corporation | 0,24 | −1,35 | 18,54 | 0,62 | 1,4773 | −0,0863 | |||
| AMZN / Amazon.com, Inc. | 0,08 | −0,09 | 18,11 | 15,21 | 1,4426 | 0,1090 | |||
| EOG / EOG Resources, Inc. | 0,15 | −3,23 | 17,93 | −9,74 | 1,4281 | −0,2571 | |||
| VMC / Vulcan Materials Company | 0,06 | −1,12 | 16,65 | 10,55 | 1,3266 | 0,0484 | |||
| DE / Deere & Company | 0,03 | −3,74 | 15,32 | 4,28 | 1,2204 | −0,0260 | |||
| ZTS / Zoetis Inc. | 0,10 | −4,65 | 14,91 | −9,69 | 1,1876 | −0,2129 | |||
| SPGI / S&P Global Inc. | 0,02 | −2,83 | 11,73 | 0,84 | 0,9341 | −0,0525 | |||
| IFF / International Flavors & Fragrances Inc. | 0,14 | 0,00 | 10,05 | −5,23 | 0,8008 | −0,0992 | |||
| MCD / McDonald's Corporation | 0,02 | 0,00 | 6,78 | −6,47 | 0,5401 | −0,0749 | |||
| GOOG / Alphabet Inc. | 0,04 | 0,00 | 6,35 | 13,55 | 0,5055 | 0,0313 | |||
| GOOGL / Alphabet Inc. | 0,04 | −0,19 | 6,25 | 13,74 | 0,4981 | 0,0317 | |||
| FN / Fabrinet | 0,01 | −4,67 | 4,39 | 42,25 | 0,3501 | 0,0880 | |||
| MTZ / MasTec, Inc. | 0,03 | −8,00 | 4,36 | 34,37 | 0,3476 | 0,0720 | |||
| NVDA / NVIDIA Corporation | 0,03 | −0,35 | 4,31 | 45,28 | 0,3431 | 0,0916 | |||
| CW / Curtiss-Wright Corporation | 0,01 | 7,09 | 4,26 | 64,96 | 0,3391 | 0,1201 | |||
| DY / Dycom Industries, Inc. | 0,01 | 7,11 | 3,61 | 71,83 | 0,2873 | 0,1092 | |||
| LRN / Stride, Inc. | 0,02 | 7,12 | 3,51 | 22,95 | 0,2796 | 0,0374 | |||
| EXLS / ExlService Holdings, Inc. | 0,08 | 7,21 | 3,46 | −0,57 | 0,2760 | −0,0196 | |||
| JNJ / Johnson & Johnson | 0,02 | 0,00 | 3,45 | −7,90 | 0,2750 | −0,0430 | |||
| FI / Fiserv, Inc. | 0,02 | −0,20 | 3,26 | −22,08 | 0,2601 | −0,0954 | |||
| META / Meta Platforms, Inc. | 0,00 | −4,08 | 3,21 | 22,84 | 0,2554 | 0,0339 | |||
| HD / The Home Depot, Inc. | 0,01 | −13,21 | 3,07 | −13,19 | 0,2449 | −0,0555 | |||
| ENSG / The Ensign Group, Inc. | 0,02 | 7,11 | 2,99 | 27,70 | 0,2384 | 0,0395 | |||
| MEDP / Medpace Holdings, Inc. | 0,01 | 7,13 | 2,93 | 10,35 | 0,2337 | 0,0081 | |||
| LNTH / Lantheus Holdings, Inc. | 0,04 | 7,11 | 2,93 | −10,16 | 0,2333 | −0,0433 | |||
| SFM / Sprouts Farmers Market, Inc. | 0,02 | 7,12 | 2,84 | 15,54 | 0,2263 | 0,0177 | |||
| CIEN / Ciena Corporation | 0,03 | 7,12 | 2,80 | 44,16 | 0,2232 | 0,0583 | |||
| EVR / Evercore Inc. | 0,01 | 7,10 | 2,75 | 44,84 | 0,2190 | 0,0579 | |||
| OLLI / Ollie's Bargain Outlet Holdings, Inc. | 0,02 | 7,13 | 2,74 | 21,34 | 0,2179 | 0,0266 | |||
| RMBS / Rambus Inc. | 0,04 | 7,16 | 2,67 | 32,55 | 0,2125 | 0,0417 | |||
| VITL / Vital Farms, Inc. | 0,07 | 7,11 | 2,64 | 35,46 | 0,2100 | 0,0448 | |||
| CORT / Corcept Therapeutics Incorporated | 0,04 | 7,20 | 2,60 | −31,11 | 0,2068 | −0,1129 | |||
| APG / APi Group Corporation | 0,05 | 7,09 | 2,58 | 52,90 | 0,2057 | 0,0624 | |||
| MOD / Modine Manufacturing Company | 0,03 | 5,04 | 2,50 | 34,84 | 0,1992 | 0,0418 | |||
| PLUS / ePlus inc. | 0,03 | 7,10 | 2,46 | 26,53 | 0,1957 | 0,0310 | |||
| AMSC / American Superconductor Corporation | 0,07 | 7,23 | 2,39 | 117,02 | 0,1900 | 0,0967 | |||
| NSC / Norfolk Southern Corporation | 0,01 | 0,00 | 2,35 | 8,06 | 0,1869 | 0,0027 | |||
| MGY / Magnolia Oil & Gas Corporation | 0,10 | 7,10 | 2,21 | −4,70 | 0,1763 | −0,0207 | |||
| TMUS / T-Mobile US, Inc. | 0,01 | −0,21 | 2,14 | −10,83 | 0,1706 | −0,0332 | |||
| PTC / PTC Inc. | 0,01 | 7,07 | 2,08 | 19,09 | 0,1661 | 0,0175 | |||
| CPRX / Catalyst Pharmaceuticals, Inc. | 0,09 | 7,10 | 2,04 | −4,14 | 0,1624 | −0,0181 | |||
| LAD / Lithia Motors, Inc. | 0,01 | 7,06 | 1,97 | 23,23 | 0,1568 | 0,0213 | |||
| BOOT / Boot Barn Holdings, Inc. | 0,01 | 7,13 | 1,96 | 51,67 | 0,1560 | 0,0464 | |||
| DIS / The Walt Disney Company | 0,02 | 0,00 | 1,93 | 25,65 | 0,1538 | 0,0234 | |||
| HALO / Halozyme Therapeutics, Inc. | 0,04 | 7,11 | 1,91 | −12,67 | 0,1522 | −0,0334 | |||
| ONTO / Onto Innovation Inc. | 0,02 | 7,13 | 1,90 | −10,90 | 0,1512 | −0,0295 | |||
| AMGN / Amgen Inc. | 0,01 | 0,00 | 1,89 | −10,35 | 0,1504 | −0,0283 | |||
| TJX / The TJX Companies, Inc. | 0,02 | −0,20 | 1,89 | 1,18 | 0,1502 | −0,0079 | |||
| NVEE / NV5 Global, Inc. | 0,08 | 7,11 | 1,74 | 28,35 | 0,1389 | 0,0236 | |||
| ORCL / Oracle Corporation | 0,01 | −0,28 | 1,69 | 56,04 | 0,1349 | 0,0428 | |||
| TMDX / TransMedics Group, Inc. | 0,01 | 7,09 | 1,67 | 113,44 | 0,1328 | 0,0665 | |||
| PRMB / Primo Brands Corporation | 0,06 | 1,66 | 0,1319 | 0,1319 | |||||
| BAC / Bank of America Corporation | 0,03 | 0,00 | 1,63 | 13,40 | 0,1295 | 0,0079 | |||
| CSCO / Cisco Systems, Inc. | 0,02 | 0,00 | 1,61 | 12,47 | 0,1279 | 0,0067 | |||
| AAON / AAON, Inc. | 0,02 | 7,14 | 1,59 | 1,15 | 0,1266 | −0,0067 | |||
| SKWD / Skyward Specialty Insurance Group, Inc. | 0,03 | 1,56 | 0,1245 | 0,1245 | |||||
| CCS / Century Communities, Inc. | 0,03 | 7,12 | 1,50 | −10,07 | 0,1196 | −0,0221 | |||
| KNF / Knife River Corporation | 0,02 | 1,45 | 0,1152 | 0,1152 | |||||
| SUPN / Supernus Pharmaceuticals, Inc. | 0,05 | 7,09 | 1,44 | 3,09 | 0,1144 | −0,0038 | |||
| POOL / Pool Corporation | 0,00 | 3,99 | 1,43 | −4,74 | 0,1137 | −0,0135 | |||
| PEP / PepsiCo, Inc. | 0,01 | 0,00 | 1,25 | −11,93 | 0,0994 | −0,0208 | |||
| SBUX / Starbucks Corporation | 0,01 | −0,50 | 1,22 | −7,03 | 0,0969 | −0,0141 | |||
| AMD / Advanced Micro Devices, Inc. | 0,01 | −0,22 | 1,21 | 37,77 | 0,0965 | 0,0219 | |||
| TMO / Thermo Fisher Scientific Inc. | 0,00 | −0,23 | 1,07 | −18,71 | 0,0852 | −0,0264 | |||
| MC / Moelis & Company | 0,02 | 7,18 | 1,06 | 14,41 | 0,0848 | 0,0059 | |||
| HSY / The Hershey Company | 0,01 | 0,00 | 1,06 | −3,02 | 0,0843 | −0,0082 | |||
| MTDR / Matador Resources Company | 0,02 | 7,08 | 0,99 | 0,00 | 0,0789 | −0,0051 | |||
| TT / Trane Technologies plc | 0,00 | 0,99 | 0,0786 | 0,0786 | |||||
| MSI / Motorola Solutions, Inc. | 0,00 | 0,95 | 0,0759 | 0,0759 | |||||
| NKE / NIKE, Inc. | 0,01 | −1,73 | 0,95 | 9,97 | 0,0756 | 0,0024 | |||
| MKTX / MarketAxess Holdings Inc. | 0,00 | 7,06 | 0,79 | 10,50 | 0,0629 | 0,0023 | |||
| VRTX / Vertex Pharmaceuticals Incorporated | 0,00 | −0,31 | 0,72 | −8,48 | 0,0577 | −0,0094 | |||
| ORLY / O'Reilly Automotive, Inc. | 0,01 | 1 400,00 | 0,72 | −5,63 | 0,0575 | −0,0074 | |||
| CARR / Carrier Global Corporation | 0,01 | 0,00 | 0,69 | 15,47 | 0,0553 | 0,0043 | |||
| LGIH / LGI Homes, Inc. | 0,01 | 7,10 | 0,68 | −17,01 | 0,0541 | −0,0153 | |||
| PG / The Procter & Gamble Company | 0,00 | 0,00 | 0,66 | −6,51 | 0,0527 | −0,0073 | |||
| XOM / Exxon Mobil Corporation | 0,01 | 0,00 | 0,55 | −9,34 | 0,0441 | −0,0077 | |||
| COST / Costco Wholesale Corporation | 0,00 | 0,00 | 0,50 | 4,61 | 0,0398 | −0,0007 | |||
| BA / The Boeing Company | 0,00 | −0,31 | 0,47 | 22,66 | 0,0376 | 0,0049 | |||
| JCI / Johnson Controls International plc | 0,00 | 0,00 | 0,38 | 31,94 | 0,0303 | 0,0058 | |||
| COP / ConocoPhillips | 0,00 | −94,31 | 0,22 | −95,15 | 0,0175 | −0,3660 | |||
| ACN / Accenture plc | 0,00 | −100,00 | 0,00 | −100,00 | −2,0298 | ||||
| VRNT / Verint Systems Inc. | 0,00 | −100,00 | 0,00 | 0,0000 | |||||
| BLKB / Blackbaud, Inc. | 0,00 | −100,00 | 0,00 | 0,0000 | |||||
| UNH / UnitedHealth Group Incorporated | 0,00 | −100,00 | 0,00 | 0,0000 | |||||
| SPY / SPDR S&P 500 ETF | 0,00 | −100,00 | 0,00 | 0,0000 |