Grundläggande statistik
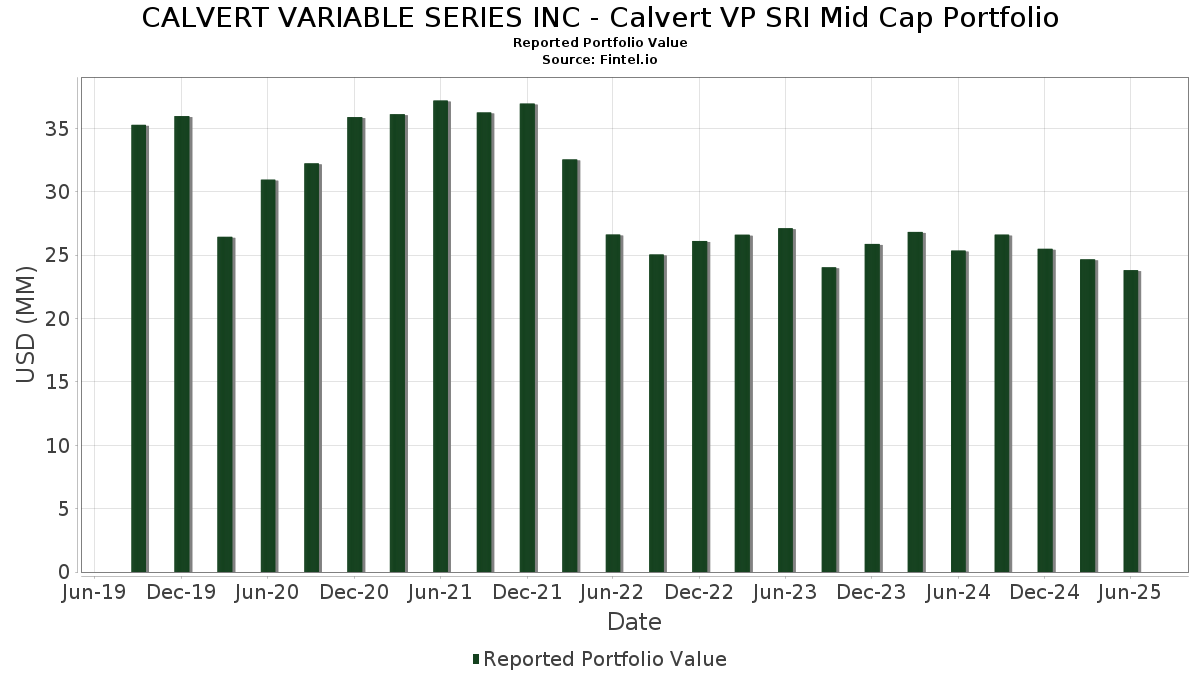
| Portföljvärde | $ 23 813 685 |
| Aktuella positioner | 63 |
Senaste innehav, resultat, förvaltat kapital (från 13F, 13D)
CALVERT VARIABLE SERIES INC - Calvert VP SRI Mid Cap Portfolio har redovisat 63 totala innehav i sina senaste SEC-arkiveringar. Det senaste portföljvärdet beräknas vara $ 23 813 685 USD. Faktiskt förvaltade tillgångar (AUM) är detta värde plus likvida medel (som inte redovisas). CALVERT VARIABLE SERIES INC - Calvert VP SRI Mid Cap Portfolios största innehav är Core & Main, Inc. (US:CNM) , AMETEK, Inc. (US:AME) , Motorola Solutions, Inc. (US:MSI) , AptarGroup, Inc. (US:ATR) , and VeriSign, Inc. (US:VRSN) . CALVERT VARIABLE SERIES INC - Calvert VP SRI Mid Cap Portfolios nya positioner inkluderar Valvoline Inc. (DE:0V4) , Manhattan Associates, Inc. (US:MANH) , The Descartes Systems Group Inc. (US:DSGX) , Caris Life Sciences, Inc. (US:CAI) , and .
Största ökningarna detta kvartal
Vi använder förändringen i portföljallokeringen eftersom det är det mest meningsfulla måttet. Förändringar kan bero på transaktioner eller förändringar i aktiekurser.
| Värdepapper | Aktier (MM) |
Värde (MM$) |
Portfölj % av | ΔPortfölj % av |
|---|---|---|---|---|
| 0,01 | 0,25 | 1,0603 | 1,0603 | |
| 0,01 | 0,77 | 3,2496 | 0,7443 | |
| 0,00 | 0,35 | 1,4689 | 0,7245 | |
| 0,00 | 0,55 | 2,3173 | 0,7189 | |
| 0,00 | 0,63 | 2,6620 | 0,7113 | |
| 0,00 | 0,59 | 2,4982 | 0,6143 | |
| 0,00 | 0,12 | 0,5203 | 0,5203 | |
| 0,00 | 0,12 | 0,5094 | 0,5094 | |
| 0,01 | 0,57 | 2,4085 | 0,4961 | |
| 0,00 | 0,11 | 0,4808 | 0,4808 |
Största minskningarna detta kvartal
Vi använder förändringen i portföljallokeringen eftersom det är det mest meningsfulla måttet. Förändringar kan bero på transaktioner eller förändringar i aktiepriser.
| Värdepapper | Aktier (MM) |
Värde (MM$) |
Portfölj % av | ΔPortfölj % av |
|---|---|---|---|---|
| 0,00 | 0,00 | 0,0058 | −4,1191 | |
| 0,01 | 0,46 | 1,9197 | −1,1716 | |
| 0,00 | 0,49 | 2,0822 | −1,1278 | |
| 0,00 | 0,24 | 0,9982 | −1,0197 | |
| 0,00 | 0,13 | 0,5644 | −0,6887 | |
| 0,01 | 0,39 | 1,6273 | −0,5393 | |
| 0,00 | 0,00 | −0,4082 | ||
| 0,00 | 0,32 | 1,3369 | −0,3498 | |
| 0,00 | 0,13 | 0,5420 | −0,2474 | |
| 0,00 | 0,45 | 1,9148 | −0,1731 |
13F- och fond arkiveringar
Denna blankett lämnades in den 2025-08-25 för rapporteringsperioden 2025-06-30. Klicka på länksymbolen för att se hela transaktionshistoriken.
Uppgradera för att låsa upp premiumdata och exportera till Excel![]() .
.
| Värdepapper | Typ | Genomsnittligt aktiepris | Aktier (MM) |
ΔAktier (%) |
ΔAktier (%) |
Värde ($MM) |
Portfölj (%) |
ΔPortfölj (%) |
|
|---|---|---|---|---|---|---|---|---|---|
| CNM / Core & Main, Inc. | 0,01 | 0,00 | 0,77 | 24,80 | 3,2496 | 0,7443 | |||
| AME / AMETEK, Inc. | 0,00 | 0,00 | 0,72 | 5,11 | 3,0383 | 0,2548 | |||
| MSI / Motorola Solutions, Inc. | 0,00 | 0,00 | 0,70 | −3,96 | 2,9670 | −0,0084 | |||
| ATR / AptarGroup, Inc. | 0,00 | 0,00 | 0,69 | 5,51 | 2,9047 | 0,2512 | |||
| TE Connectivity PLC / EC (IE000IVNQZ81) | 0,00 | 10,12 | 0,63 | 31,46 | 2,6620 | 0,7113 | |||
| VRSN / VeriSign, Inc. | 0,00 | 0,00 | 0,61 | 13,83 | 2,5699 | 0,3942 | |||
| ELS / Equity LifeStyle Properties, Inc. | 0,01 | 0,00 | 0,61 | −7,45 | 2,5676 | −0,1069 | |||
| CMS / CMS Energy Corporation | 0,01 | 0,00 | 0,59 | −7,76 | 2,5074 | −0,1107 | |||
| IDXX / IDEXX Laboratories, Inc. | 0,00 | 0,00 | 0,59 | 27,59 | 2,4982 | 0,6143 | |||
| ARMK / Aramark | 0,01 | 0,00 | 0,57 | 21,23 | 2,4085 | 0,4961 | |||
| LNT / Alliant Energy Corporation | 0,01 | 0,00 | 0,57 | −6,12 | 2,3968 | −0,0596 | |||
| RPRX / Royalty Pharma plc | 0,02 | 0,00 | 0,56 | 15,77 | 2,3529 | 0,3950 | |||
| BURL / Burlington Stores, Inc. | 0,00 | 43,04 | 0,55 | 39,69 | 2,3173 | 0,7189 | |||
| LPLA / LPL Financial Holdings Inc. | 0,00 | 0,00 | 0,54 | 14,62 | 2,2824 | 0,3646 | |||
| WH / Wyndham Hotels & Resorts, Inc. | 0,01 | 0,00 | 0,52 | −10,23 | 2,1844 | −0,1603 | |||
| AOS / A. O. Smith Corporation | 0,01 | 20,63 | 0,51 | 21,14 | 2,1515 | 0,4392 | |||
| ACGL / Arch Capital Group Ltd. | 0,01 | 10,01 | 0,51 | 4,09 | 2,1474 | 0,1615 | |||
| WTM / White Mountains Insurance Group, Ltd. | 0,00 | 0,00 | 0,50 | −6,73 | 2,1043 | −0,0691 | |||
| TW / Tradeweb Markets Inc. | 0,00 | −36,65 | 0,49 | −37,59 | 2,0822 | −1,1278 | |||
| DORM / Dorman Products, Inc. | 0,00 | 0,00 | 0,48 | 1,69 | 2,0317 | 0,1090 | |||
| GGG / Graco Inc. | 0,01 | 6,31 | 0,47 | 9,67 | 1,9605 | 0,2352 | |||
| CPRT / Copart, Inc. | 0,01 | −31,03 | 0,46 | −40,21 | 1,9197 | −1,1716 | |||
| MAA / Mid-America Apartment Communities, Inc. | 0,00 | 0,00 | 0,45 | −11,67 | 1,9148 | −0,1731 | |||
| LAMR / Lamar Advertising Company | 0,00 | 0,00 | 0,44 | 6,59 | 1,8452 | 0,1791 | |||
| MIDD / The Middleby Corporation | 0,00 | 0,00 | 0,43 | −5,26 | 1,8234 | −0,0300 | |||
| CBSH / Commerce Bancshares, Inc. | 0,01 | 11,69 | 0,42 | 11,58 | 1,7883 | 0,2447 | |||
| AFG / American Financial Group, Inc. | 0,00 | 0,00 | 0,39 | −3,93 | 1,6503 | −0,0037 | |||
| USFD / US Foods Holding Corp. | 0,01 | −38,51 | 0,39 | −27,58 | 1,6273 | −0,5393 | |||
| NBIX / Neurocrine Biosciences, Inc. | 0,00 | 0,00 | 0,37 | 13,68 | 1,5773 | 0,2406 | |||
| DCI / Donaldson Company, Inc. | 0,01 | 26,88 | 0,37 | 31,56 | 1,5646 | 0,4162 | |||
| MCHP / Microchip Technology Incorporated | 0,00 | 30,73 | 0,35 | 90,16 | 1,4689 | 0,7245 | |||
| KWR / Quaker Chemical Corporation | 0,00 | 0,00 | 0,34 | −9,21 | 1,4123 | −0,0897 | |||
| KNSL / Kinsale Capital Group, Inc. | 0,00 | 0,00 | 0,33 | −0,60 | 1,3891 | 0,0435 | |||
| TYL / Tyler Technologies, Inc. | 0,00 | −14,06 | 0,33 | −12,37 | 1,3745 | −0,1361 | |||
| RYAN / Ryan Specialty Holdings, Inc. | 0,00 | 0,00 | 0,32 | −8,22 | 1,3699 | −0,0635 | |||
| FFIN / First Financial Bankshares, Inc. | 0,01 | 0,00 | 0,32 | 0,31 | 1,3532 | 0,0521 | |||
| WMS / Advanced Drainage Systems, Inc. | 0,00 | 32,23 | 0,32 | 39,74 | 1,3528 | 0,4208 | |||
| AAON / AAON, Inc. | 0,00 | −3,35 | 0,32 | −8,65 | 1,3377 | −0,0744 | |||
| CHD / Church & Dwight Co., Inc. | 0,00 | −12,56 | 0,32 | −23,61 | 1,3369 | −0,3498 | |||
| URI / United Rentals, Inc. | 0,00 | 0,00 | 0,31 | 20,00 | 1,3180 | 0,2621 | |||
| NVR / NVR, Inc. | 0,00 | 0,00 | 0,30 | 1,68 | 1,2765 | 0,0706 | |||
| NDSN / Nordson Corporation | 0,00 | 0,00 | 0,30 | 6,41 | 1,2606 | 0,1182 | |||
| LSTR / Landstar System, Inc. | 0,00 | −8,05 | 0,29 | −14,75 | 1,2189 | −0,1604 | |||
| CDW / CDW Corporation | 0,00 | 0,00 | 0,27 | 11,62 | 1,1352 | 0,1541 | |||
| LKQ / LKQ Corporation | 0,01 | 0,00 | 0,25 | −13,06 | 1,0694 | −0,1144 | |||
| DPZ / Domino's Pizza, Inc. | 0,00 | 0,00 | 0,25 | −1,94 | 1,0675 | 0,0192 | |||
| 0V4 / Valvoline Inc. | 0,01 | 0,25 | 1,0603 | 1,0603 | |||||
| DAY / Dayforce Inc. | 0,00 | 0,00 | 0,25 | −4,94 | 1,0556 | −0,0150 | |||
| ON / ON Semiconductor Corporation | 0,00 | 12,99 | 0,25 | 46,15 | 1,0414 | 0,3523 | |||
| WRB / W. R. Berkley Corporation | 0,00 | 0,00 | 0,24 | 3,49 | 0,9994 | 0,0672 | |||
| EGP / EastGroup Properties, Inc. | 0,00 | −56,10 | 0,24 | −64,02 | 0,9982 | −1,0197 | |||
| CHE / Chemed Corporation | 0,00 | −33,43 | 0,23 | −39,32 | 0,9852 | −0,0857 | |||
| VRSK / Verisk Analytics, Inc. | 0,00 | 0,00 | 0,23 | 4,48 | 0,9848 | 0,0786 | |||
| ORLY / O'Reilly Automotive, Inc. | 0,00 | 1 400,00 | 0,23 | −5,69 | 0,9802 | −0,0201 | |||
| TER / Teradyne, Inc. | 0,00 | 68,69 | 0,20 | 85,19 | 0,8434 | 0,4011 | |||
| HXL / Hexcel Corporation | 0,00 | −72,27 | 0,13 | −65,54 | 0,5644 | −0,6887 | |||
| CASY / Casey's General Stores, Inc. | 0,00 | −43,75 | 0,13 | −34,02 | 0,5420 | −0,2474 | |||
| ENTG / Entegris, Inc. | 0,00 | 0,00 | 0,13 | −8,09 | 0,5290 | −0,0236 | |||
| MANH / Manhattan Associates, Inc. | 0,00 | 0,12 | 0,5203 | 0,5203 | |||||
| DSGX / The Descartes Systems Group Inc. | 0,00 | 0,12 | 0,5094 | 0,5094 | |||||
| CAI / Caris Life Sciences, Inc. | 0,00 | 0,11 | 0,4808 | 0,4808 | |||||
| AVY / Avery Dennison Corporation | 0,00 | 0,00 | 0,11 | −1,87 | 0,4453 | 0,0103 | |||
| US61747C7074 / Morgan Stanley Institutional Liquidity Funds Government Portfolio, Institutional Class | 0,00 | −99,87 | 0,00 | −99,90 | 0,0058 | −4,1191 | |||
| FRPT / Freshpet, Inc. | 0,00 | −100,00 | 0,00 | −100,00 | −0,4082 |