Grundläggande statistik
| Portföljvärde | $ 191 453 |
| Aktuella positioner | 68 |
Senaste innehav, resultat, förvaltat kapital (från 13F, 13D)
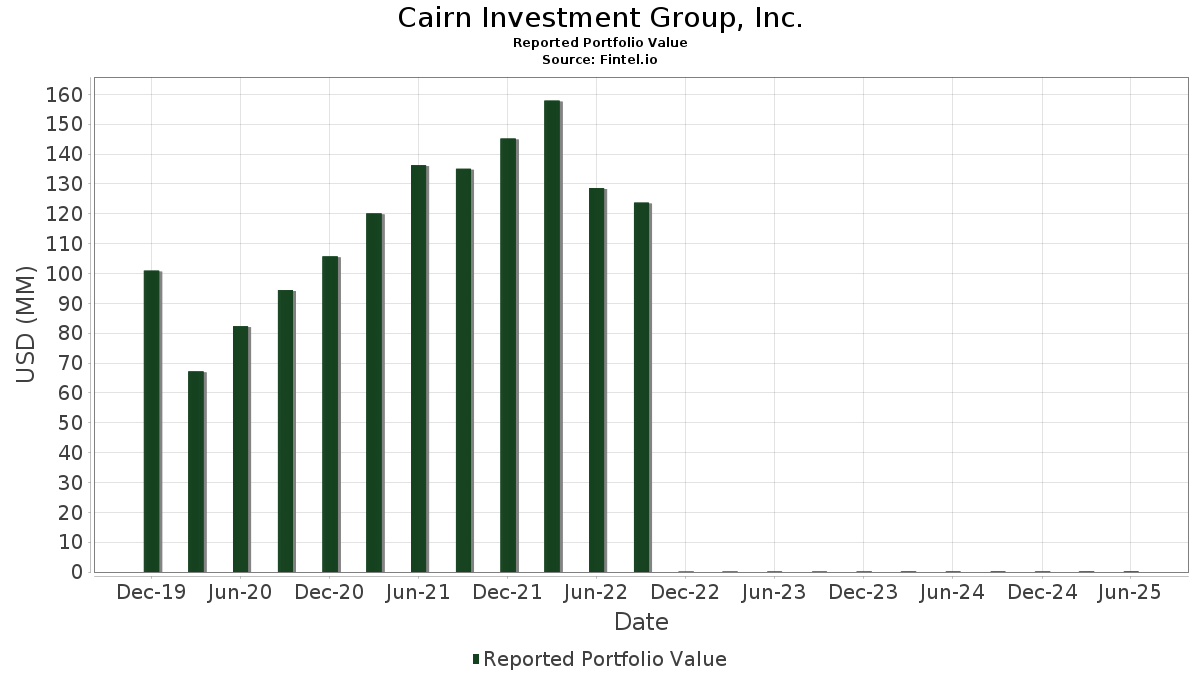
Cairn Investment Group, Inc. har redovisat 68 totala innehav i sina senaste SEC-arkiveringar. Det senaste portföljvärdet beräknas vara $ 191 453 USD. Faktiskt förvaltade tillgångar (AUM) är detta värde plus likvida medel (som inte redovisas). Cairn Investment Group, Inc.s största innehav är Vanguard STAR Funds - Vanguard Total International Stock ETF (US:VXUS) , Vanguard Emerging Markets Stock Index Fund (US:VERSX) , Apple Inc. (US:AAPL) , iShares, Inc. - iShares MSCI Brazil ETF (US:EWZ) , and VanEck ETF Trust - VanEck Gold Miners ETF (US:GDX) . Cairn Investment Group, Inc.s nya positioner inkluderar BorgWarner Inc. (US:BWA) , Sysco Corporation (US:SYY) , .
Största ökningarna detta kvartal
Vi använder förändringen i portföljallokeringen eftersom det är det mest meningsfulla måttet. Förändringar kan bero på transaktioner eller förändringar i aktiekurser.
| Värdepapper | Aktier (MM) |
Värde (MM$) |
Portfölj % av | ΔPortfölj % av |
|---|---|---|---|---|
| 0,04 | 0,00 | 2,4523 | 2,1523 | |
| 0,05 | 0,00 | 2,2570 | 2,0795 | |
| 0,31 | 0,02 | 11,1187 | 0,6402 | |
| 0,01 | 0,01 | 3,7513 | 0,5738 | |
| 0,00 | 0,01 | 3,2384 | 0,3676 | |
| 0,00 | 0,00 | 0,2121 | 0,2121 | |
| 0,28 | 0,01 | 4,2903 | 0,1839 | |
| 0,02 | 0,01 | 3,6468 | 0,1614 | |
| 0,00 | 0,00 | 0,1510 | 0,1510 | |
| 0,01 | 0,00 | 1,0697 | 0,1380 |
Största minskningarna detta kvartal
Vi använder förändringen i portföljallokeringen eftersom det är det mest meningsfulla måttet. Förändringar kan bero på transaktioner eller förändringar i aktiepriser.
| Värdepapper | Aktier (MM) |
Värde (MM$) |
Portfölj % av | ΔPortfölj % av |
|---|---|---|---|---|
| 0,00 | 0,00 | 1,5142 | −1,0040 | |
| 0,04 | 0,01 | 4,6325 | −0,8774 | |
| 0,04 | 0,00 | 1,4097 | −0,4892 | |
| 0,04 | 0,00 | 1,5764 | −0,4480 | |
| 0,00 | 0,00 | 0,2695 | −0,4203 | |
| 0,06 | 0,01 | 2,8132 | −0,4073 | |
| 0,04 | 0,01 | 2,6508 | −0,3386 | |
| 0,03 | 0,00 | 1,8161 | −0,2546 | |
| 0,11 | 0,00 | 2,0193 | −0,1994 | |
| 0,03 | 0,00 | 1,6291 | −0,1857 |
13F- och fond arkiveringar
Denna blankett lämnades in den 2025-07-17 för rapporteringsperioden 2025-06-30. Klicka på länksymbolen för att se hela transaktionshistoriken.
Uppgradera för att låsa upp premiumdata och exportera till Excel![]() .
.
| Värdepapper | Typ | Genomsnittligt aktiepris | Aktier (MM) |
ΔAktier (%) |
ΔAktier (%) |
Värde ($MM) |
Portfölj (%) |
ΔPortfölj (%) |
|
|---|---|---|---|---|---|---|---|---|---|
| VXUS / Vanguard STAR Funds - Vanguard Total International Stock ETF | 0,31 | 3,17 | 0,02 | 16,67 | 11,1187 | 0,6402 | |||
| VERSX / Vanguard Emerging Markets Stock Index Fund | 0,23 | −1,19 | 0,01 | 10,00 | 5,8813 | −0,0110 | |||
| AAPL / Apple Inc. | 0,04 | −1,54 | 0,01 | −11,11 | 4,6325 | −0,8774 | |||
| EWZ / iShares, Inc. - iShares MSCI Brazil ETF | 0,28 | 1,26 | 0,01 | 14,29 | 4,2903 | 0,1839 | |||
| GDX / VanEck ETF Trust - VanEck Gold Miners ETF | 0,16 | −1,91 | 0,01 | 14,29 | 4,2627 | 0,1122 | |||
| GSCE / GS Connect S&P GSCI Enhanced Commodity Total Return ETN | 0,01 | −1,44 | 0,01 | 40,00 | 3,7513 | 0,5738 | |||
| AYI / Acuity Inc. | 0,02 | −0,10 | 0,01 | 0,00 | 3,6468 | 0,1614 | |||
| BKNG / Booking Holdings Inc. | 0,00 | −2,90 | 0,01 | 20,00 | 3,2384 | 0,3676 | |||
| QCOM / QUALCOMM Incorporated | 0,03 | 0,64 | 0,01 | 0,00 | 2,8848 | −0,1057 | |||
| BWA / BorgWarner Inc. | 0,16 | 0,01 | 0,0000 | ||||||
| SBUX / Starbucks Corporation | 0,06 | 1,14 | 0,01 | 0,00 | 2,8132 | −0,4073 | |||
| EXPD / Expeditors International of Washington, Inc. | 0,04 | 0,95 | 0,01 | 0,00 | 2,6508 | −0,3386 | |||
| SYY / Sysco Corporation | 0,07 | 0,00 | 0,0000 | ||||||
| CI / The Cigna Group | 0,01 | 1,34 | 0,00 | 0,00 | 2,5218 | −0,1569 | |||
| PEP / PepsiCo, Inc. | 0,04 | 904,38 | 0,00 | 2,4523 | 2,1523 | ||||
| FFIV / F5, Inc. | 0,02 | −0,99 | 0,00 | 0,00 | 2,4183 | 0,0278 | |||
| CTSH / Cognizant Technology Solutions Corporation | 0,06 | 1,42 | 0,00 | 0,00 | 2,2632 | −0,1036 | |||
| MRK / Merck & Co., Inc. | 0,05 | 1 459,57 | 0,00 | 2,2570 | 2,0795 | ||||
| KR / The Kroger Co. | 0,06 | 0,28 | 0,00 | 33,33 | 2,2068 | −0,0396 | |||
| COST / Costco Wholesale Corporation | 0,00 | 3,89 | 0,00 | 0,00 | 2,0741 | 0,0108 | |||
| CMCSA / Comcast Corporation | 0,11 | 1,77 | 0,00 | 0,00 | 2,0193 | −0,1994 | |||
| EOG / EOG Resources, Inc. | 0,03 | 1,70 | 0,00 | 0,00 | 1,8161 | −0,2546 | |||
| PCAR / PACCAR Inc | 0,03 | −0,54 | 0,00 | 0,00 | 1,6291 | −0,1857 | |||
| OMC / Omnicom Group Inc. | 0,04 | −2,91 | 0,00 | 0,00 | 1,5764 | −0,4480 | |||
| META / Meta Platforms, Inc. | 0,00 | −49,20 | 0,00 | −50,00 | 1,5142 | −1,0040 | |||
| COLM / Columbia Sportswear Company | 0,04 | −0,50 | 0,00 | −33,33 | 1,4097 | −0,4892 | |||
| MCK / McKesson Corporation | 0,00 | −0,95 | 0,00 | 0,00 | 1,3972 | −0,0040 | |||
| GILD / Gilead Sciences, Inc. | 0,02 | 0,72 | 0,00 | 0,00 | 1,2907 | −0,1100 | |||
| LLY / Eli Lilly and Company | 0,00 | 0,00 | 0,00 | 0,00 | 1,2154 | −0,1773 | |||
| GOOGL / Alphabet Inc. | 0,01 | −0,92 | 0,00 | 100,00 | 1,1162 | 0,0472 | |||
| VONV / Vanguard Scottsdale Funds - Vanguard Russell 1000 Value ETF | 0,02 | −3,37 | 0,00 | 0,00 | 1,0838 | −0,0919 | |||
| CAH / Cardinal Health, Inc. | 0,01 | 1,88 | 0,00 | 100,00 | 1,0697 | 0,1380 | |||
| BRK.A / Berkshire Hathaway Inc. | 0,00 | 31,58 | 0,00 | 0,00 | 0,9611 | 0,0949 | |||
| VZ / Verizon Communications Inc. | 0,04 | 9,14 | 0,00 | 0,00 | 0,9605 | −0,0372 | |||
| CSCO / Cisco Systems, Inc. | 0,03 | 1,21 | 0,00 | 0,00 | 0,9099 | 0,0449 | |||
| MSFT / Microsoft Corporation | 0,00 | −2,74 | 0,00 | 0,00 | 0,7657 | 0,1228 | |||
| EW / Edwards Lifesciences Corporation | 0,02 | 16,34 | 0,00 | 0,00 | 0,7271 | 0,1005 | |||
| USB / U.S. Bancorp | 0,03 | 12,10 | 0,00 | 0,00 | 0,6900 | 0,0691 | |||
| BIIB / Biogen Inc. | 0,01 | −0,98 | 0,00 | 0,00 | 0,5427 | −0,1031 | |||
| JPM.WS / JPMorgan Chase & Co. | 0,00 | 0,00 | 0,00 | 0,5385 | 0,0453 | ||||
| GBIL / Goldman Sachs ETF Trust - Goldman Sachs Access Treasury 0-1 Year ETF | 0,01 | −17,13 | 0,00 | −100,00 | 0,4680 | −0,1433 | |||
| AMZN / Amazon.com, Inc. | 0,00 | 36,73 | 0,00 | 0,3839 | 0,1206 | ||||
| NVO / Novo Nordisk A/S - Depositary Receipt (Common Stock) | 0,01 | 4,51 | 0,00 | 0,3724 | −0,0152 | ||||
| AXP / American Express Company | 0,00 | 0,00 | 0,00 | 0,3165 | 0,0278 | ||||
| V / Visa Inc. | 0,00 | −10,63 | 0,00 | 0,3118 | −0,0611 | ||||
| XOM / Exxon Mobil Corporation | 0,00 | −53,40 | 0,00 | −100,00 | 0,2695 | −0,4203 | |||
| MMM / 3M Company | 0,00 | 0,00 | 0,00 | 0,2680 | −0,0117 | ||||
| DIS / The Walt Disney Company | 0,00 | 0,00 | 0,00 | 0,2518 | 0,0354 | ||||
| CTAS / Cintas Corporation | 0,00 | −3,71 | 0,00 | 0,2418 | −0,0085 | ||||
| AMP / Ameriprise Financial, Inc. | 0,00 | 0,00 | 0,00 | 0,2267 | 0,0041 | ||||
| EMR / Emerson Electric Co. | 0,00 | 0,00 | 0,00 | 0,2230 | 0,0247 | ||||
| COWZ / Pacer Funds Trust - Pacer US Cash Cows 100 ETF | 0,01 | 46,21 | 0,00 | 0,2220 | 0,0587 | ||||
| F / Ford Motor Company | 0,04 | −2,28 | 0,00 | 0,2183 | −0,0048 | ||||
| SHV / iShares Trust - iShares Short Treasury Bond ETF | 0,00 | 0,00 | 0,2121 | 0,2121 | |||||
| IEFA / iShares Trust - iShares Core MSCI EAFE ETF | 0,00 | 0,00 | 0,00 | 0,2100 | 0,0043 | ||||
| VGRSX / Vanguard REIT Index Fund | 0,00 | 0,00 | 0,00 | 0,1875 | −0,0046 | ||||
| IVV / iShares Trust - iShares Core S&P 500 ETF | 0,00 | −8,33 | 0,00 | 0,1781 | −0,0123 | ||||
| CVX / Chevron Corporation | 0,00 | −34,09 | 0,00 | 0,1619 | −0,1488 | ||||
| BA / The Boeing Company | 0,00 | 0,00 | 0,1510 | 0,1510 | |||||
| UNH / UnitedHealth Group Incorporated | 0,00 | 0,00 | 0,00 | 0,1368 | −0,1118 | ||||
| UNP / Union Pacific Corporation | 0,00 | 0,00 | 0,00 | 0,1332 | −0,0148 | ||||
| ABT / Abbott Laboratories | 0,00 | 0,00 | 0,00 | 0,1311 | −0,0073 | ||||
| COR / Cencora, Inc. | 0,00 | 0,00 | 0,1222 | 0,1222 | |||||
| DVY / iShares Trust - iShares Select Dividend ETF | 0,00 | 0,00 | 0,00 | 0,1207 | −0,0116 | ||||
| TDY / Teledyne Technologies Incorporated | 0,00 | 0,00 | 0,00 | 0,1191 | −0,0063 | ||||
| BAC / Bank of America Corporation | 0,00 | 0,00 | 0,1180 | 0,1180 | |||||
| SPGI / S&P Global Inc. | 0,00 | 0,00 | 0,00 | 0,1139 | −0,0048 | ||||
| FTXP / Foothills Exploration, Inc. | 0,00 | 0,00 | 0,1086 | 0,1086 | |||||
| ABBV / AbbVie Inc. | 0,00 | −100,00 | 0,00 | 0,0000 | |||||
| LYB / LyondellBasell Industries N.V. | 0,00 | −100,00 | 0,00 | 0,0000 | |||||
| JWN / Nordstrom, Inc. | 0,00 | −100,00 | 0,00 | 0,0000 |