Grundläggande statistik
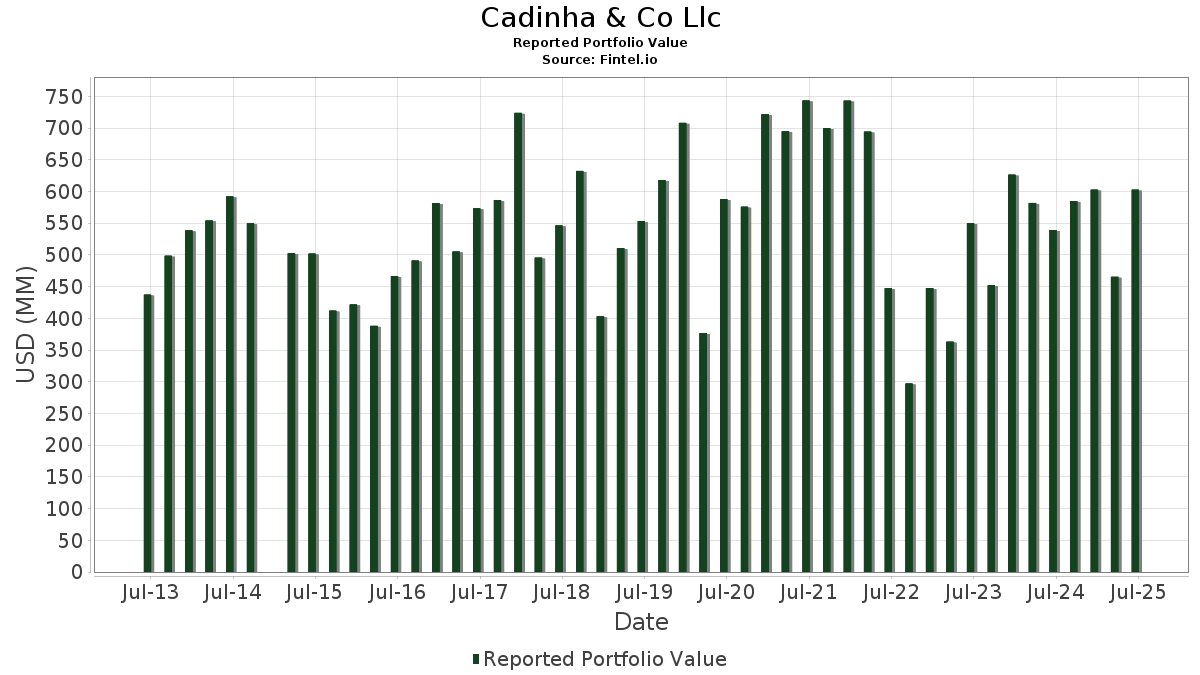
| Portföljvärde | $ 602 801 448 |
| Aktuella positioner | 99 |
Senaste innehav, resultat, förvaltat kapital (från 13F, 13D)
Cadinha & Co Llc har redovisat 99 totala innehav i sina senaste SEC-arkiveringar. Det senaste portföljvärdet beräknas vara $ 602 801 448 USD. Faktiskt förvaltade tillgångar (AUM) är detta värde plus likvida medel (som inte redovisas). Cadinha & Co Llcs största innehav är Costco Wholesale Corporation (US:COST) , Berkshire Hathaway Inc. (US:BRK.B) , Intuitive Surgical, Inc. (US:ISRG) , Microsoft Corporation (US:MSFT) , and iShares Gold Trust (US:IAU) . Cadinha & Co Llcs nya positioner inkluderar Netflix, Inc. (US:NFLX) , Marsh & McLennan Companies, Inc. (US:MMC) , General Electric Company (US:GE) , Deckers Outdoor Corporation (US:DECK) , and .
Största ökningarna detta kvartal
Vi använder förändringen i portföljallokeringen eftersom det är det mest meningsfulla måttet. Förändringar kan bero på transaktioner eller förändringar i aktiekurser.
| Värdepapper | Aktier (MM) |
Värde (MM$) |
Portfölj % av | ΔPortfölj % av |
|---|---|---|---|---|
| 0,07 | 25,16 | 4,1731 | 3,6788 | |
| 0,06 | 21,36 | 3,5429 | 3,5429 | |
| 0,02 | 21,24 | 3,5233 | 3,5233 | |
| 0,13 | 18,88 | 3,1315 | 3,0381 | |
| 0,08 | 18,09 | 3,0006 | 3,0006 | |
| 0,07 | 34,22 | 5,6761 | 2,8953 | |
| 0,14 | 16,00 | 2,6551 | 2,5539 | |
| 0,35 | 15,05 | 2,4960 | 2,3836 | |
| 0,15 | 23,78 | 3,9442 | 2,2039 | |
| 0,04 | 9,83 | 1,6300 | 1,6300 |
Största minskningarna detta kvartal
Vi använder förändringen i portföljallokeringen eftersom det är det mest meningsfulla måttet. Förändringar kan bero på transaktioner eller förändringar i aktiepriser.
| Värdepapper | Aktier (MM) |
Värde (MM$) |
Portfölj % av | ΔPortfölj % av |
|---|---|---|---|---|
| 0,00 | 0,42 | 0,0698 | −4,1255 | |
| 0,00 | 1,14 | 0,1895 | −2,9151 | |
| 0,00 | 1,32 | 0,2198 | −2,8685 | |
| 0,08 | 38,00 | 6,3042 | −2,6830 | |
| 0,01 | 4,66 | 0,7736 | −2,5615 | |
| 0,01 | 2,42 | 0,4006 | −2,5471 | |
| 0,07 | 3,20 | 0,5315 | −1,7347 | |
| 0,04 | 38,60 | 6,4036 | −1,5590 | |
| 0,00 | 0,33 | 0,0555 | −1,3514 | |
| 0,52 | 32,59 | 5,4072 | −1,1441 |
13F- och fond arkiveringar
Denna blankett lämnades in den 2025-07-31 för rapporteringsperioden 2025-06-30. Klicka på länksymbolen för att se hela transaktionshistoriken.
Uppgradera för att låsa upp premiumdata och exportera till Excel![]() .
.
| Värdepapper | Typ | Genomsnittligt aktiepris | Aktier (MM) |
ΔAktier (%) |
ΔAktier (%) |
Värde ($MM) |
Portfölj (%) |
ΔPortfölj (%) |
|
|---|---|---|---|---|---|---|---|---|---|
| COST / Costco Wholesale Corporation | 0,04 | −0,49 | 38,60 | 4,15 | 6,4036 | −1,5590 | |||
| BRK.B / Berkshire Hathaway Inc. | 0,08 | −0,40 | 38,00 | −9,15 | 6,3042 | −2,6830 | |||
| ISRG / Intuitive Surgical, Inc. | 0,06 | −0,80 | 34,47 | 8,84 | 5,7190 | −1,0861 | |||
| MSFT / Microsoft Corporation | 0,07 | 99,51 | 34,22 | 164,35 | 5,6761 | 2,8953 | |||
| IAU / iShares Gold Trust | 0,52 | 1,07 | 32,59 | 6,89 | 5,4072 | −1,1441 | |||
| JPM / JPMorgan Chase & Co. | 0,10 | 66,09 | 28,74 | 96,29 | 4,7673 | 1,6219 | |||
| IVV / iShares Trust - iShares Core S&P 500 ETF | 0,04 | 25,82 | 26,41 | 39,03 | 4,3814 | 0,2999 | |||
| V / Visa Inc. | 0,07 | 979,37 | 25,16 | 993,70 | 4,1731 | 3,6788 | |||
| WMT / Walmart Inc. | 0,25 | 26,90 | 24,36 | 41,34 | 4,0416 | 0,3383 | |||
| NVDA / NVIDIA Corporation | 0,15 | 101,36 | 23,78 | 193,55 | 3,9442 | 2,2039 | |||
| CAT / Caterpillar Inc. | 0,06 | 21,36 | 3,5429 | 3,5429 | |||||
| NFLX / Netflix, Inc. | 0,02 | 21,24 | 3,5233 | 3,5233 | |||||
| CSCO / Cisco Systems, Inc. | 0,28 | 30,54 | 19,41 | 46,76 | 3,2202 | 0,3786 | |||
| RTX / RTX Corporation | 0,13 | 3 838,94 | 18,88 | 4 249,31 | 3,1315 | 3,0381 | |||
| MMC / Marsh & McLennan Companies, Inc. | 0,08 | 18,09 | 3,0006 | 3,0006 | |||||
| AMZN / Amazon.com, Inc. | 0,08 | −10,51 | 17,82 | 3,20 | 2,9563 | −0,7539 | |||
| CHKP / Check Point Software Technologies Ltd. | 0,08 | 5,89 | 16,72 | 2,79 | 2,7731 | −0,7208 | |||
| DUK / Duke Energy Corporation | 0,14 | 3 411,13 | 16,00 | 3 297,88 | 2,6551 | 2,5539 | |||
| GOOGL / Alphabet Inc. | 0,09 | −1,18 | 15,18 | 12,61 | 2,5189 | −0,3780 | |||
| VZ / Verizon Communications Inc. | 0,35 | 2 916,80 | 15,05 | 2 782,18 | 2,4960 | 2,3836 | |||
| XOM / Exxon Mobil Corporation | 0,13 | −2,48 | 14,38 | −11,61 | 2,3848 | −1,1094 | |||
| GE / General Electric Company | 0,04 | 9,83 | 1,6300 | 1,6300 | |||||
| PLTR / Palantir Technologies Inc. | 0,07 | 8,30 | 8,87 | 74,93 | 1,4714 | 0,3820 | |||
| QQQ / Invesco QQQ Trust, Series 1 | 0,01 | 391,23 | 7,11 | 478,28 | 1,1791 | 0,9149 | |||
| LLY / Eli Lilly and Company | 0,01 | −68,17 | 4,66 | −69,96 | 0,7736 | −2,5615 | |||
| AAPL / Apple Inc. | 0,02 | −5,34 | 4,25 | −12,57 | 0,7053 | −0,3394 | |||
| UNP / Union Pacific Corporation | 0,02 | 0,05 | 3,45 | −2,54 | 0,5728 | −0,1885 | |||
| FCX / Freeport-McMoRan Inc. | 0,07 | −73,47 | 3,20 | −69,62 | 0,5315 | −1,7347 | |||
| SPY / SPDR S&P 500 ETF | 0,00 | −0,87 | 2,81 | 9,48 | 0,4656 | −0,0852 | |||
| GWW / W.W. Grainger, Inc. | 0,00 | 26,80 | 2,63 | 33,54 | 0,4368 | 0,0131 | |||
| CVX / Chevron Corporation | 0,02 | 9,20 | 2,60 | −6,55 | 0,4309 | −0,1661 | |||
| IXUS / iShares Trust - iShares Core MSCI Total International Stock ETF | 0,03 | 2,55 | 0,4232 | 0,4232 | |||||
| TLT / iShares Trust - iShares 20+ Year Treasury Bond ETF | 0,03 | 953,29 | 2,50 | 921,63 | 0,4153 | 0,3626 | |||
| MCD / McDonald's Corporation | 0,01 | −81,18 | 2,42 | −82,40 | 0,4006 | −2,5471 | |||
| ABBV / AbbVie Inc. | 0,01 | 0,10 | 2,12 | −11,32 | 0,3524 | −0,1623 | |||
| WFC / Wells Fargo & Company | 0,02 | 0,12 | 1,94 | 11,71 | 0,3214 | −0,0511 | |||
| BA / The Boeing Company | 0,01 | 514,74 | 1,89 | 657,83 | 0,3130 | 0,2594 | |||
| JNJ / Johnson & Johnson | 0,01 | −32,87 | 1,64 | −38,19 | 0,2727 | −0,2984 | |||
| IJH / iShares Trust - iShares Core S&P Mid-Cap ETF | 0,03 | −8,67 | 1,58 | −2,90 | 0,2613 | −0,0873 | |||
| IJR / iShares Trust - iShares Core S&P Small-Cap ETF | 0,01 | −14,92 | 1,46 | −11,10 | 0,2419 | −0,1105 | |||
| BRK.A / Berkshire Hathaway Inc. | 0,00 | 0,00 | 1,46 | −8,71 | 0,2418 | −0,1013 | |||
| AMGN / Amgen Inc. | 0,01 | −1,21 | 1,41 | −11,50 | 0,2337 | −0,1082 | |||
| ABT / Abbott Laboratories | 0,01 | 0,18 | 1,39 | 2,66 | 0,2309 | −0,0602 | |||
| IVW / iShares Trust - iShares S&P 500 Growth ETF | 0,01 | −0,87 | 1,39 | 17,57 | 0,2298 | −0,0233 | |||
| HD / The Home Depot, Inc. | 0,00 | −90,79 | 1,32 | −90,79 | 0,2198 | −2,8685 | |||
| WPM / Wheaton Precious Metals Corp. | 0,01 | −21,07 | 1,23 | −8,68 | 0,2042 | −0,0855 | |||
| CSW / CSW Industrials, Inc. | 0,00 | 0,00 | 1,23 | −1,60 | 0,2038 | −0,0645 | |||
| VTI / Vanguard Index Funds - Vanguard Total Stock Market ETF | 0,00 | −2,94 | 1,22 | 7,38 | 0,2028 | −0,0419 | |||
| IVE / iShares Trust - iShares S&P 500 Value ETF | 0,01 | 0,66 | 1,20 | 3,27 | 0,1991 | −0,0507 | |||
| CW / Curtiss-Wright Corporation | 0,00 | −94,87 | 1,14 | −92,10 | 0,1895 | −2,9151 | |||
| KO / The Coca-Cola Company | 0,02 | 376,58 | 1,13 | 371,97 | 0,1873 | 0,1358 | |||
| HUBB / Hubbell Incorporated | 0,00 | −5,80 | 1,13 | 16,20 | 0,1869 | −0,0213 | |||
| MRK / Merck & Co., Inc. | 0,01 | −3,57 | 1,09 | −14,94 | 0,1814 | −0,0949 | |||
| MA / Mastercard Incorporated | 0,00 | −2,62 | 1,05 | −0,19 | 0,1735 | −0,0516 | |||
| DHR / Danaher Corporation | 0,00 | −7,37 | 0,75 | −10,67 | 0,1236 | −0,0557 | |||
| DECK / Deckers Outdoor Corporation | 0,01 | 0,74 | 0,1234 | 0,1234 | |||||
| CSX / CSX Corporation | 0,02 | −1,56 | 0,74 | 9,13 | 0,1230 | −0,0230 | |||
| XLE / The Select Sector SPDR Trust - The Energy Select Sector SPDR Fund | 0,01 | −9,51 | 0,73 | −17,89 | 0,1211 | −0,0699 | |||
| PG / The Procter & Gamble Company | 0,00 | −17,29 | 0,71 | −22,65 | 0,1173 | −0,0792 | |||
| GOVT / iShares Trust - iShares U.S. Treasury Bond ETF | 0,03 | −0,53 | 0,58 | −0,51 | 0,0963 | −0,0291 | |||
| IBM / International Business Machines Corporation | 0,00 | 1,33 | 0,56 | 20,17 | 0,0929 | −0,0073 | |||
| COP / ConocoPhillips | 0,01 | 0,00 | 0,54 | −14,62 | 0,0902 | −0,0465 | |||
| SCI / Service Corporation International | 0,01 | −23,32 | 0,54 | −22,13 | 0,0888 | −0,0590 | |||
| NSC / Norfolk Southern Corporation | 0,00 | 0,00 | 0,49 | 8,02 | 0,0805 | −0,0160 | |||
| PFE / Pfizer Inc. | 0,02 | −3,62 | 0,45 | −7,82 | 0,0745 | −0,0301 | |||
| PSX / Phillips 66 | 0,00 | 0,32 | 0,45 | −3,05 | 0,0739 | −0,0248 | |||
| INTC / Intel Corporation | 0,02 | 83,79 | 0,42 | 81,55 | 0,0703 | 0,0201 | |||
| FI / Fiserv, Inc. | 0,00 | −97,24 | 0,42 | −97,85 | 0,0698 | −4,1255 | |||
| PEP / PepsiCo, Inc. | 0,00 | −2,15 | 0,42 | −13,96 | 0,0696 | −0,0350 | |||
| AMD / Advanced Micro Devices, Inc. | 0,00 | −26,39 | 0,42 | 1,70 | 0,0694 | −0,0190 | |||
| AEM / Agnico Eagle Mines Limited | 0,00 | 2,75 | 0,38 | 12,72 | 0,0634 | −0,0094 | |||
| VO / Vanguard Index Funds - Vanguard Mid-Cap ETF | 0,00 | 16,35 | 0,38 | 26,00 | 0,0628 | −0,0018 | |||
| ITW / Illinois Tool Works Inc. | 0,00 | −5,70 | 0,38 | −6,25 | 0,0624 | −0,0236 | |||
| ITOT / iShares Trust - iShares Core S&P Total U.S. Stock Market ETF | 0,00 | 0,00 | 0,37 | 10,51 | 0,0612 | −0,0104 | |||
| MKC / McCormick & Company, Incorporated | 0,00 | 0,00 | 0,36 | −8,10 | 0,0604 | −0,0245 | |||
| AVGO / Broadcom Inc. | 0,00 | −10,03 | 0,36 | 48,16 | 0,0603 | 0,0076 | |||
| SHY / iShares Trust - iShares 1-3 Year Treasury Bond ETF | 0,00 | −12,03 | 0,35 | −11,90 | 0,0578 | −0,0272 | |||
| SYK / Stryker Corporation | 0,00 | 0,00 | 0,34 | 6,17 | 0,0572 | −0,0125 | |||
| CL / Colgate-Palmolive Company | 0,00 | 0,00 | 0,34 | −2,89 | 0,0558 | −0,0187 | |||
| CLX / The Clorox Company | 0,00 | 11,92 | 0,34 | −8,97 | 0,0557 | −0,0234 | |||
| META / Meta Platforms, Inc. | 0,00 | −96,01 | 0,33 | −94,90 | 0,0555 | −1,3514 | |||
| EMR / Emerson Electric Co. | 0,00 | 0,00 | 0,31 | 21,79 | 0,0520 | −0,0034 | |||
| BWXT / BWX Technologies, Inc. | 0,00 | −7,00 | 0,29 | 35,85 | 0,0479 | 0,0022 | |||
| GLD / SPDR Gold Trust | 0,00 | 12,05 | 0,28 | 18,41 | 0,0470 | −0,0044 | |||
| LII / Lennox International Inc. | 0,00 | −12,50 | 0,28 | −10,83 | 0,0466 | −0,0209 | |||
| TRMB / Trimble Inc. | 0,00 | 0,00 | 0,28 | 15,83 | 0,0462 | −0,0055 | |||
| BX / Blackstone Inc. | 0,00 | −3,90 | 0,28 | 2,60 | 0,0459 | −0,0119 | |||
| NAK / Northern Dynasty Minerals Ltd. | 0,20 | 0,00 | 0,27 | 16,81 | 0,0450 | −0,0050 | |||
| MDY / SPDR S&P MidCap 400 ETF Trust | 0,00 | −37,60 | 0,26 | −33,67 | 0,0435 | −0,0415 | |||
| AGG / iShares Trust - iShares Core U.S. Aggregate Bond ETF | 0,00 | 0,04 | 0,26 | 0,00 | 0,0433 | −0,0126 | |||
| HON / Honeywell International Inc. | 0,00 | 0,09 | 0,25 | 9,87 | 0,0408 | −0,0072 | |||
| ED / Consolidated Edison, Inc. | 0,00 | −0,41 | 0,25 | −9,93 | 0,0408 | −0,0177 | |||
| NOC / Northrop Grumman Corporation | 0,00 | −1,22 | 0,24 | −3,59 | 0,0402 | −0,0137 | |||
| CMG / Chipotle Mexican Grill, Inc. | 0,00 | −12,66 | 0,23 | −2,11 | 0,0386 | −0,0126 | |||
| DD / DuPont de Nemours, Inc. | 0,00 | 0,00 | 0,23 | −8,00 | 0,0382 | −0,0157 | |||
| BOH / Bank of Hawaii Corporation | 0,00 | −12,86 | 0,23 | −14,93 | 0,0380 | −0,0197 | |||
| ECL / Ecolab Inc. | 0,00 | 0,00 | 0,22 | 6,28 | 0,0365 | −0,0080 | |||
| SPGI / S&P Global Inc. | 0,00 | 0,00 | 0,21 | 3,45 | 0,0350 | −0,0087 | |||
| TSCO / Tractor Supply Company | 0,00 | −13,48 | 0,20 | −17,14 | 0,0337 | −0,0190 | |||
| DOW / Dow Inc. | 0,00 | −100,00 | 0,00 | 0,0000 | |||||
| BMY / Bristol-Myers Squibb Company | 0,00 | −100,00 | 0,00 | 0,0000 | |||||
| CPF / Central Pacific Financial Corp. | 0,00 | −100,00 | 0,00 | 0,0000 | |||||
| GS / The Goldman Sachs Group, Inc. | 0,00 | −100,00 | 0,00 | 0,0000 | |||||
| ADBE / Adobe Inc. | 0,00 | −100,00 | 0,00 | 0,0000 | |||||
| ADP / Automatic Data Processing, Inc. | 0,00 | −100,00 | 0,00 | 0,0000 |