Grundläggande statistik
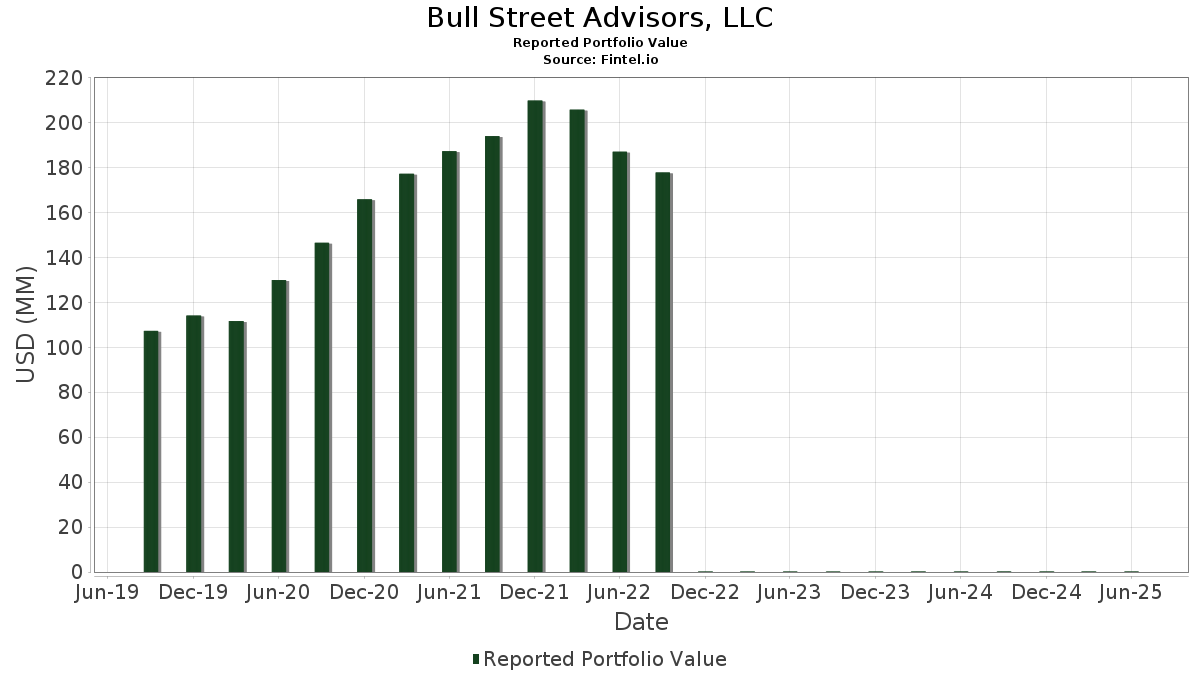
| Portföljvärde | $ 207 980 |
| Aktuella positioner | 89 |
Senaste innehav, resultat, förvaltat kapital (från 13F, 13D)
Bull Street Advisors, LLC har redovisat 89 totala innehav i sina senaste SEC-arkiveringar. Det senaste portföljvärdet beräknas vara $ 207 980 USD. Faktiskt förvaltade tillgångar (AUM) är detta värde plus likvida medel (som inte redovisas). Bull Street Advisors, LLCs största innehav är The TJX Companies, Inc. (US:TJX) , Microsoft Corporation (US:MSFT) , Vanguard Bond Index Funds - Vanguard Short-Term Bond ETF (US:BSV) , Vanguard Scottsdale Funds - Vanguard Short-Term Treasury ETF (US:VGSH) , and Costco Wholesale Corporation (CL:COST) . Bull Street Advisors, LLCs nya positioner inkluderar Ralliant Corporation (US:RAL) , .
Största ökningarna detta kvartal
Vi använder förändringen i portföljallokeringen eftersom det är det mest meningsfulla måttet. Förändringar kan bero på transaktioner eller förändringar i aktiekurser.
| Värdepapper | Aktier (MM) |
Värde (MM$) |
Portfölj % av | ΔPortfölj % av |
|---|---|---|---|---|
| 0,02 | 0,01 | 4,1297 | 0,9847 | |
| 0,02 | 0,00 | 2,3454 | 0,3539 | |
| 0,03 | 0,00 | 1,5516 | 0,3194 | |
| 0,01 | 0,00 | 1,7531 | 0,2732 | |
| 0,02 | 0,00 | 1,1597 | 0,2102 | |
| 0,01 | 0,00 | 1,1780 | 0,1475 | |
| 0,01 | 0,00 | 0,1438 | 0,1438 | |
| 0,01 | 0,00 | 1,5780 | 0,1408 | |
| 0,04 | 0,00 | 1,2669 | 0,1354 | |
| 0,01 | 0,00 | 0,6818 | 0,1299 |
Största minskningarna detta kvartal
Vi använder förändringen i portföljallokeringen eftersom det är det mest meningsfulla måttet. Förändringar kan bero på transaktioner eller förändringar i aktiepriser.
| Värdepapper | Aktier (MM) |
Värde (MM$) |
Portfölj % av | ΔPortfölj % av |
|---|---|---|---|---|
| 0,03 | 0,01 | 2,6349 | −0,7507 | |
| 0,04 | 0,01 | 3,7071 | −0,4344 | |
| 0,05 | 0,01 | 3,5133 | −0,2866 | |
| 0,01 | 0,00 | 2,3060 | −0,2206 | |
| 0,02 | 0,00 | 1,1891 | −0,2108 | |
| 0,01 | 0,00 | 1,7502 | −0,1953 | |
| 0,04 | 0,00 | 1,9459 | −0,1927 | |
| 0,02 | 0,00 | 0,4597 | −0,1890 | |
| 0,02 | 0,00 | 1,2636 | −0,1607 | |
| 0,01 | 0,00 | 1,2905 | −0,1476 |
13F- och fond arkiveringar
Denna blankett lämnades in den 2025-07-25 för rapporteringsperioden 2025-06-30. Klicka på länksymbolen för att se hela transaktionshistoriken.
Uppgradera för att låsa upp premiumdata och exportera till Excel![]() .
.
| Värdepapper | Typ | Genomsnittligt aktiepris | Aktier (MM) |
ΔAktier (%) |
ΔAktier (%) |
Värde ($MM) |
Portfölj (%) |
ΔPortfölj (%) |
|
|---|---|---|---|---|---|---|---|---|---|
| TJX / The TJX Companies, Inc. | 0,07 | −0,68 | 0,01 | 0,00 | 4,2509 | 0,0447 | |||
| MSFT / Microsoft Corporation | 0,02 | −1,26 | 0,01 | 33,33 | 4,1297 | 0,9847 | |||
| BSV / Vanguard Bond Index Funds - Vanguard Short-Term Bond ETF | 0,11 | −2,06 | 0,01 | 0,00 | 4,0499 | −0,0480 | |||
| VGSH / Vanguard Scottsdale Funds - Vanguard Short-Term Treasury ETF | 0,14 | 0,20 | 0,01 | 0,00 | 3,8388 | 0,0274 | |||
| COST / Costco Wholesale Corporation | 0,01 | −2,33 | 0,01 | 0,00 | 3,7571 | 0,0956 | |||
| AAPL / Apple Inc. | 0,04 | −3,45 | 0,01 | −12,50 | 3,7071 | −0,4344 | |||
| KO / The Coca-Cola Company | 0,10 | −0,04 | 0,01 | 0,00 | 3,5215 | −0,0317 | |||
| JNJ / Johnson & Johnson | 0,05 | 0,02 | 0,01 | 0,00 | 3,5133 | −0,2866 | |||
| HD / The Home Depot, Inc. | 0,02 | −1,89 | 0,01 | 0,00 | 3,0128 | −0,0456 | |||
| XPRO / Expro Group Holdings N.V. | 0,03 | −0,67 | 0,01 | −28,57 | 2,6349 | −0,7507 | |||
| JPM / JPMorgan Chase & Co. | 0,02 | −0,71 | 0,00 | 0,00 | 2,3454 | 0,3539 | |||
| BRK.A / Berkshire Hathaway Inc. | 0,01 | −0,30 | 0,00 | −20,00 | 2,3060 | −0,2206 | |||
| IGSB / iShares Trust - iShares 1-5 Year Investment Grade Corporate Bond ETF | 0,08 | 0,00 | 0,00 | 0,00 | 2,0935 | 0,0230 | |||
| VCSH / Vanguard Scottsdale Funds - Vanguard Short-Term Corporate Bond ETF | 0,05 | −1,35 | 0,00 | 0,00 | 2,0199 | −0,0061 | |||
| DHR / Danaher Corporation | 0,02 | 0,00 | 0,00 | 0,00 | 1,9920 | −0,0675 | |||
| ADP / Automatic Data Processing, Inc. | 0,01 | −0,15 | 0,00 | 0,00 | 1,9487 | 0,0219 | |||
| XOM / Exxon Mobil Corporation | 0,04 | 0,01 | 0,00 | 0,00 | 1,9459 | −0,1927 | |||
| VCIT / Vanguard Scottsdale Funds - Vanguard Intermediate-Term Corporate Bond ETF | 0,05 | −0,43 | 0,00 | 0,00 | 1,8483 | 0,0249 | |||
| GJR / Strats Trust For Procter & Gambel Security - Preferred Security | 0,02 | −0,43 | 0,00 | 0,00 | 1,7593 | −0,1239 | |||
| AXP / American Express Company | 0,01 | −0,44 | 0,00 | 0,00 | 1,7531 | 0,2732 | |||
| AMGN / Amgen Inc. | 0,01 | 0,00 | 0,00 | −25,00 | 1,7502 | −0,1953 | |||
| 0LC6 / Sysco Corporation | 0,05 | 0,00 | 0,00 | 0,00 | 1,6814 | 0,0215 | |||
| HON / Honeywell International Inc. | 0,01 | −0,53 | 0,00 | 0,00 | 1,5780 | 0,1408 | |||
| DIS / The Walt Disney Company | 0,03 | −0,15 | 0,00 | 50,00 | 1,5516 | 0,3194 | |||
| VGIT / Vanguard Scottsdale Funds - Vanguard Intermediate-Term Treasury ETF | 0,05 | 3,33 | 0,00 | 0,00 | 1,5372 | 0,0650 | |||
| MDLZ / Mondelez International, Inc. | 0,04 | −3,58 | 0,00 | −33,33 | 1,4232 | −0,0561 | |||
| SPY / SPDR S&P 500 ETF | 0,00 | −2,50 | 0,00 | 0,00 | 1,3343 | 0,0997 | |||
| RSG / Republic Services, Inc. | 0,01 | −7,78 | 0,00 | 0,00 | 1,3213 | −0,0805 | |||
| ELV / Elevance Health, Inc. | 0,01 | 0,00 | 0,00 | −33,33 | 1,2905 | −0,1476 | |||
| CSCO / Cisco Systems, Inc. | 0,04 | −0,78 | 0,00 | 0,00 | 1,2669 | 0,1354 | |||
| PEP / PepsiCo, Inc. | 0,02 | 0,37 | 0,00 | 0,00 | 1,2636 | −0,1607 | |||
| RTX / RTX Corporation | 0,02 | 0,00 | 0,00 | 0,00 | 1,2492 | 0,1200 | |||
| CHVD / Chevron Corporation | 0,02 | −1,12 | 0,00 | 0,00 | 1,1891 | −0,2108 | |||
| GOOGL / Alphabet Inc. | 0,01 | −0,07 | 0,00 | 0,00 | 1,1780 | 0,1475 | |||
| EMR / Emerson Electric Co. | 0,02 | 0,07 | 0,00 | 100,00 | 1,1597 | 0,2102 | |||
| TIP / iShares Trust - iShares TIPS Bond ETF | 0,02 | −6,92 | 0,00 | 0,00 | 1,0674 | −0,0862 | |||
| VITS.X / Vanguard Index Funds - Vanguard Total Stock Market ETF | 0,01 | 1,14 | 0,00 | 0,00 | 0,9337 | 0,1021 | |||
| GOOG / Alphabet Inc. | 0,01 | 0,00 | 0,00 | 0,00 | 0,9246 | 0,1131 | |||
| ABT / Abbott Laboratories | 0,01 | 0,00 | 0,00 | 0,00 | 0,8448 | 0,0237 | |||
| DUK / Duke Energy Corporation | 0,01 | 0,00 | 0,00 | 0,00 | 0,8409 | −0,0252 | |||
| CMCS.A / Comcast Corporation | 0,05 | 1,52 | 0,00 | 0,00 | 0,8025 | −0,0119 | |||
| SYK / Stryker Corporation | 0,00 | −0,52 | 0,00 | 0,00 | 0,7323 | 0,0424 | |||
| D / Dominion Energy, Inc. | 0,03 | −0,48 | 0,00 | 0,00 | 0,6991 | 0,0049 | |||
| CPT / Camden Property Trust | 0,01 | 0,00 | 0,00 | 0,00 | 0,6900 | −0,0559 | |||
| NUE / Nucor Corporation | 0,01 | 14,36 | 0,00 | 0,00 | 0,6818 | 0,1299 | |||
| UNP / Union Pacific Corporation | 0,01 | 0,00 | 0,00 | 0,00 | 0,6755 | −0,0153 | |||
| PFE / Pfizer Inc. | 0,05 | 0,00 | 0,00 | 0,00 | 0,6227 | −0,0260 | |||
| VXF / Vanguard Index Funds - Vanguard Extended Market ETF | 0,01 | 0,00 | 0,00 | 0,00 | 0,6068 | 0,0664 | |||
| USB / U.S. Bancorp | 0,03 | −9,36 | 0,00 | 0,00 | 0,5847 | −0,0146 | |||
| SUB / iShares Trust - iShares Short-Term National Muni Bond ETF | 0,01 | 0,00 | 0,00 | 0,00 | 0,5534 | 0,0058 | |||
| MRK / Merck & Co., Inc. | 0,01 | 0,00 | 0,00 | 0,00 | 0,5376 | −0,0699 | |||
| AVB / AvalonBay Communities, Inc. | 0,01 | 0,00 | 0,00 | 0,00 | 0,5323 | −0,0273 | |||
| MS / Morgan Stanley | 0,01 | 0,00 | 0,00 | 0,5130 | 0,0895 | ||||
| GIS / General Mills, Inc. | 0,02 | 0,00 | 0,00 | 0,00 | 0,5125 | −0,0767 | |||
| DD / DuPont de Nemours, Inc. | 0,02 | −0,35 | 0,00 | 0,00 | 0,5097 | −0,0456 | |||
| NVO / Novo Nordisk A/S - Depositary Receipt (Common Stock) | 0,01 | 0,00 | 0,00 | 0,00 | 0,4900 | −0,0016 | |||
| COP / ConocoPhillips | 0,01 | −0,84 | 0,00 | −100,00 | 0,4601 | −0,0807 | |||
| 0IRE / Fortive Corporation | 0,02 | −0,81 | 0,00 | −100,00 | 0,4597 | −0,1890 | |||
| PSX / Phillips 66 | 0,01 | 0,00 | 0,00 | 0,4361 | −0,0137 | ||||
| CB / Chubb Limited | 0,00 | 0,00 | 0,00 | 0,4250 | −0,0162 | ||||
| CL / Colgate-Palmolive Company | 0,01 | 1,26 | 0,00 | 0,3697 | −0,0054 | ||||
| DEO / Diageo plc - Depositary Receipt (Common Stock) | 0,01 | −5,12 | 0,00 | 0,3596 | −0,0327 | ||||
| CARR / Carrier Global Corporation | 0,01 | 0,00 | 0,00 | 0,3582 | 0,0492 | ||||
| AFL / Aflac Incorporated | 0,01 | 0,00 | 0,00 | 0,3505 | −0,0179 | ||||
| MUSA / Murphy USA Inc. | 0,00 | 0,00 | 0,00 | 0,3481 | −0,0524 | ||||
| GPC / Genuine Parts Company | 0,01 | −2,17 | 0,00 | 0,3279 | −0,0002 | ||||
| GSCE / GS Connect S&P GSCI Enhanced Commodity Total Return ETN | 0,00 | 0,00 | 0,00 | 0,3260 | 0,0750 | ||||
| VZ / Verizon Communications Inc. | 0,01 | −5,94 | 0,00 | 0,3111 | −0,0343 | ||||
| BND / Vanguard Bond Index Funds - Vanguard Total Bond Market ETF | 0,01 | 1,86 | 0,00 | 0,2919 | 0,0068 | ||||
| GLD / SPDR Gold Trust | 0,00 | 0,00 | 0,00 | 0,2678 | 0,0158 | ||||
| EQR / Equity Residential | 0,01 | 0,00 | 0,00 | 0,2635 | −0,0148 | ||||
| OTIS / Otis Worldwide Corporation | 0,01 | 0,00 | 0,00 | 0,2606 | −0,0101 | ||||
| VLTO / Veralto Corporation | 0,01 | −8,30 | 0,00 | 0,2548 | −0,0125 | ||||
| DVY / iShares Trust - iShares Select Dividend ETF | 0,00 | 0,00 | 0,00 | 0,2313 | −0,0020 | ||||
| VEU / Vanguard International Equity Index Funds - Vanguard FTSE All-World ex-US ETF | 0,01 | 1,30 | 0,00 | 0,2116 | 0,0238 | ||||
| CVS / CVS Health Corporation | 0,01 | −2,46 | 0,00 | 0,1971 | −0,0002 | ||||
| CI / The Cigna Group | 0,00 | 0,00 | 0,00 | 0,1914 | 0,0017 | ||||
| MMM / 3M Company | 0,00 | −0,92 | 0,00 | 0,1741 | 0,0054 | ||||
| IJH / iShares Trust - iShares Core S&P Mid-Cap ETF | 0,01 | 0,00 | 0,00 | 0,1712 | 0,0107 | ||||
| EFA / iShares Trust - iShares MSCI EAFE ETF | 0,00 | 0,00 | 0,00 | 0,1654 | 0,0145 | ||||
| EPD / Enterprise Products Partners L.P. - Limited Partnership | 0,01 | 0,00 | 0,00 | 0,1572 | −0,0152 | ||||
| BAC / Bank of America Corporation | 0,01 | −3,53 | 0,00 | 0,1558 | 0,0140 | ||||
| WMT / Walmart Inc. | 0,00 | −1,58 | 0,00 | 0,1466 | 0,0135 | ||||
| RAL / Ralliant Corporation | 0,01 | 0,00 | 0,1438 | 0,1438 | |||||
| GE / General Electric Company | 0,00 | 0,00 | 0,00 | 0,1433 | 0,0326 | ||||
| CTVA / Corteva, Inc. | 0,00 | 0,00 | 0,00 | 0,1289 | 0,0201 | ||||
| IBM / International Business Machines Corporation | 0,00 | 0,00 | 0,00 | 0,1274 | 0,0201 | ||||
| PEG / Public Service Enterprise Group Incorporated | 0,00 | 0,00 | 0,00 | 0,1231 | 0,0033 | ||||
| LOW / Lowe's Companies, Inc. | 0,00 | 0,00 | 0,00 | 0,1039 | −0,0049 | ||||
| BDX / Becton, Dickinson and Company | 0,00 | −100,00 | 0,00 | 0,0000 |