Grundläggande statistik
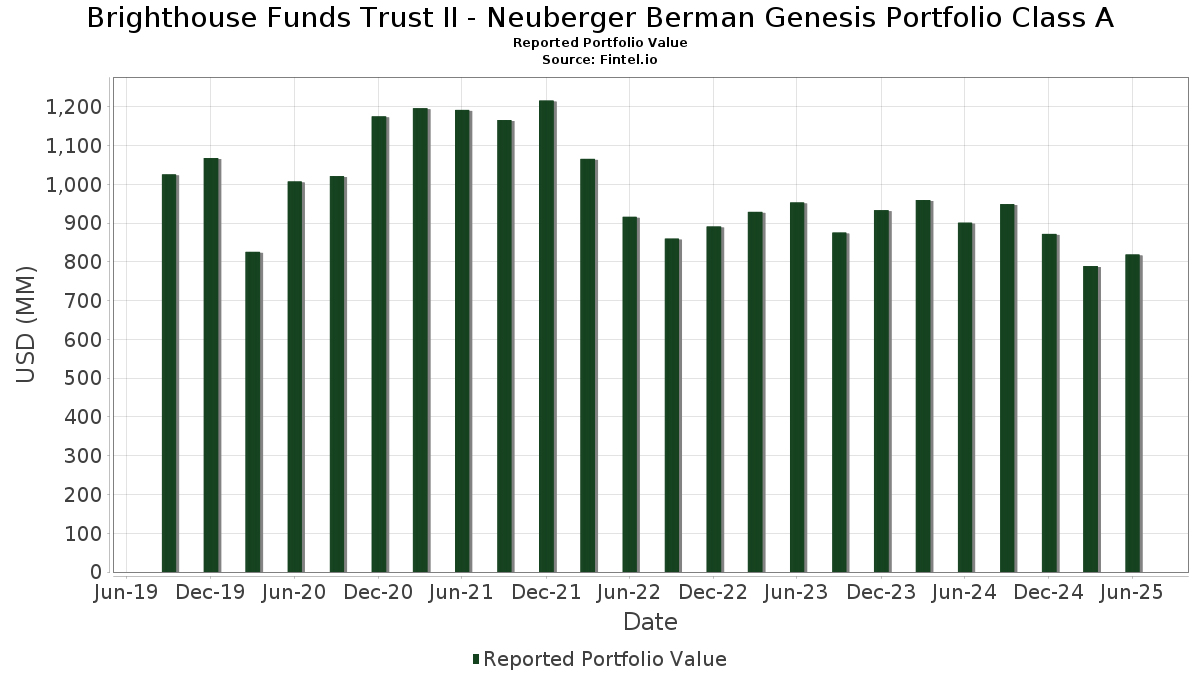
| Portföljvärde | $ 819 187 077 |
| Aktuella positioner | 110 |
Senaste innehav, resultat, förvaltat kapital (från 13F, 13D)
Brighthouse Funds Trust II - Neuberger Berman Genesis Portfolio Class A har redovisat 110 totala innehav i sina senaste SEC-arkiveringar. Det senaste portföljvärdet beräknas vara $ 819 187 077 USD. Faktiskt förvaltade tillgångar (AUM) är detta värde plus likvida medel (som inte redovisas). Brighthouse Funds Trust II - Neuberger Berman Genesis Portfolio Class As största innehav är Valmont Industries, Inc. (US:VMI) , Texas Roadhouse, Inc. (US:TXRH) , RBC Bearings Incorporated (US:RBC) , FirstService Corporation (US:FSV) , and Kirby Corporation (US:KEX) . Brighthouse Funds Trust II - Neuberger Berman Genesis Portfolio Class As nya positioner inkluderar Murphy USA Inc. (US:MUSA) , Saia, Inc. (US:SAIA) , .
Största ökningarna detta kvartal
Vi använder förändringen i portföljallokeringen eftersom det är det mest meningsfulla måttet. Förändringar kan bero på transaktioner eller förändringar i aktiekurser.
| Värdepapper | Aktier (MM) |
Värde (MM$) |
Portfölj % av | ΔPortfölj % av |
|---|---|---|---|---|
| 9,72 | 1,1873 | 1,1873 | ||
| 0,01 | 3,78 | 0,4617 | 0,4617 | |
| 0,15 | 6,74 | 0,8232 | 0,4152 | |
| 0,45 | 4,28 | 0,5228 | 0,4008 | |
| 0,07 | 7,74 | 0,9454 | 0,3915 | |
| 0,08 | 9,00 | 1,0992 | 0,3711 | |
| 0,01 | 2,79 | 0,3406 | 0,3406 | |
| 0,09 | 5,04 | 0,6152 | 0,3294 | |
| 0,45 | 10,33 | 1,2619 | 0,3114 | |
| 0,06 | 7,98 | 0,9751 | 0,2875 |
Största minskningarna detta kvartal
Vi använder förändringen i portföljallokeringen eftersom det är det mest meningsfulla måttet. Förändringar kan bero på transaktioner eller förändringar i aktiepriser.
| Värdepapper | Aktier (MM) |
Värde (MM$) |
Portfölj % av | ΔPortfölj % av |
|---|---|---|---|---|
| 0,04 | 8,11 | 0,9901 | −0,5021 | |
| 0,03 | 12,38 | 1,5119 | −0,4854 | |
| 0,03 | 6,26 | 0,7644 | −0,4473 | |
| 0,06 | 8,15 | 0,9948 | −0,4254 | |
| 0,11 | 8,14 | 0,9946 | −0,3814 | |
| 0,02 | 2,33 | 0,2840 | −0,3787 | |
| 0,02 | 5,08 | 0,6206 | −0,3734 | |
| 0,13 | 6,82 | 0,8332 | −0,3490 | |
| 0,07 | 11,79 | 1,4402 | −0,2726 | |
| 0,03 | 8,69 | 1,0611 | −0,2582 |
13F- och fond arkiveringar
Denna blankett lämnades in den 2025-08-27 för rapporteringsperioden 2025-06-30. Klicka på länksymbolen för att se hela transaktionshistoriken.
Uppgradera för att låsa upp premiumdata och exportera till Excel![]() .
.
| Värdepapper | Typ | Genomsnittligt aktiepris | Aktier (MM) |
ΔAktier (%) |
ΔAktier (%) |
Värde ($MM) |
Portfölj (%) |
ΔPortfölj (%) |
|
|---|---|---|---|---|---|---|---|---|---|
| VMI / Valmont Industries, Inc. | 0,05 | −0,73 | 15,90 | 13,61 | 1,9416 | 0,1678 | |||
| TXRH / Texas Roadhouse, Inc. | 0,08 | −0,72 | 14,45 | 11,65 | 1,7653 | 0,1244 | |||
| RBC / RBC Bearings Incorporated | 0,04 | −18,52 | 14,31 | −2,56 | 1,7474 | −0,1138 | |||
| FSV / FirstService Corporation | 0,08 | −0,73 | 14,24 | 4,46 | 1,7398 | 0,0112 | |||
| KEX / Kirby Corporation | 0,12 | −0,73 | 14,16 | 11,46 | 1,7295 | 0,1191 | |||
| HAE / Haemonetics Corporation | 0,19 | −0,73 | 13,92 | 16,55 | 1,6999 | 0,1861 | |||
| LFUS / Littelfuse, Inc. | 0,06 | 4,29 | 12,89 | 20,20 | 1,5737 | 0,2148 | |||
| TTEK / Tetra Tech, Inc. | 0,35 | −0,73 | 12,55 | 22,05 | 1,5326 | 0,2293 | |||
| CHE / Chemed Corporation | 0,03 | −0,72 | 12,38 | −21,44 | 1,5119 | −0,4854 | |||
| SPXC / SPX Technologies, Inc. | 0,07 | −3,34 | 12,32 | 25,86 | 1,5044 | 0,2638 | |||
| MANH / Manhattan Associates, Inc. | 0,06 | −0,73 | 12,26 | 13,29 | 1,4975 | 0,1256 | |||
| CNX / CNX Resources Corporation | 0,36 | −0,73 | 12,08 | 6,21 | 1,4758 | 0,0337 | |||
| POWI / Power Integrations, Inc. | 0,22 | 3,93 | 12,05 | 15,05 | 1,4719 | 0,1440 | |||
| PB / Prosperity Bancshares, Inc. | 0,17 | 9,40 | 11,86 | 7,66 | 1,4483 | 0,0522 | |||
| ESAB / ESAB Corporation | 0,10 | −0,73 | 11,86 | 2,73 | 1,4483 | −0,0150 | |||
| NXST / Nexstar Media Group, Inc. | 0,07 | −9,57 | 11,79 | −12,73 | 1,4402 | −0,2726 | |||
| CBU / Community Financial System, Inc. | 0,20 | 7,59 | 11,51 | 7,60 | 1,4055 | 0,0499 | |||
| ESE / ESCO Technologies Inc. | 0,06 | −0,73 | 11,29 | 19,70 | 1,3789 | 0,1833 | |||
| LSCC / Lattice Semiconductor Corporation | 0,23 | 3,70 | 11,21 | −3,15 | 1,3691 | −0,0980 | |||
| TYL / Tyler Technologies, Inc. | 0,02 | −0,73 | 11,06 | 1,23 | 1,3510 | −0,0342 | |||
| FICO / Fair Isaac Corporation | 0,01 | −9,10 | 10,99 | −9,90 | 1,3424 | −0,2039 | |||
| CVLT / Commvault Systems, Inc. | 0,06 | −21,62 | 10,57 | −13,39 | 1,2906 | −0,2560 | |||
| ACA / Arcosa, Inc. | 0,12 | −0,73 | 10,49 | 11,62 | 1,2809 | 0,0899 | |||
| GTES / Gates Industrial Corporation plc | 0,45 | 10,15 | 10,33 | 37,78 | 1,2619 | 0,3114 | |||
| WSO / Watsco, Inc. | 0,02 | −0,73 | 10,01 | −13,75 | 1,2222 | −0,2485 | |||
| FIXED INC CLEARING CORP.REPO / RA (000000000) | 9,72 | 1,1873 | 1,1873 | ||||||
| ATR / AptarGroup, Inc. | 0,06 | −0,73 | 9,54 | 4,67 | 1,1646 | 0,0097 | |||
| MKSI / MKS Inc. | 0,10 | −0,73 | 9,48 | 23,07 | 1,1580 | 0,1814 | |||
| CFR / Cullen/Frost Bankers, Inc. | 0,07 | 18,00 | 9,01 | 21,15 | 1,1003 | 0,1577 | |||
| FSS / Federal Signal Corporation | 0,08 | 8,30 | 9,00 | 56,71 | 1,0992 | 0,3711 | |||
| AWI / Armstrong World Industries, Inc. | 0,05 | −0,73 | 8,73 | 14,47 | 1,0668 | 0,0995 | |||
| KAI / Kadant Inc. | 0,03 | −11,41 | 8,69 | −16,53 | 1,0611 | −0,2582 | |||
| QLYS / Qualys, Inc. | 0,06 | −0,73 | 8,56 | 12,63 | 1,0455 | 0,0821 | |||
| GBCI / Glacier Bancorp, Inc. | 0,20 | 20,12 | 8,56 | 17,02 | 1,0453 | 0,1182 | |||
| UCB / United Community Banks, Inc. | 0,29 | 15,69 | 8,51 | 22,52 | 1,0388 | 0,1588 | |||
| LNN / Lindsay Corporation | 0,06 | −0,73 | 8,24 | 13,18 | 1,0070 | 0,0836 | |||
| SPSC / SPS Commerce, Inc. | 0,06 | −29,10 | 8,15 | −27,30 | 0,9948 | −0,4254 | |||
| RLI / RLI Corp. | 0,11 | −16,55 | 8,14 | −24,98 | 0,9946 | −0,3814 | |||
| EXP / Eagle Materials Inc. | 0,04 | −24,38 | 8,11 | −31,14 | 0,9901 | −0,5021 | |||
| TTC / The Toro Company | 0,11 | 5,23 | 8,02 | 2,23 | 0,9800 | −0,0149 | |||
| AEIS / Advanced Energy Industries, Inc. | 0,06 | 5,87 | 7,98 | 47,20 | 0,9751 | 0,2875 | |||
| ROL / Rollins, Inc. | 0,14 | −0,73 | 7,98 | 3,66 | 0,9743 | −0,0012 | |||
| SXI / Standex International Corporation | 0,05 | −0,72 | 7,92 | −3,74 | 0,9671 | −0,0757 | |||
| IDA / IDACORP, Inc. | 0,07 | 22,13 | 7,83 | 21,34 | 0,9557 | 0,1381 | |||
| WTM / White Mountains Insurance Group, Ltd. | 0,00 | 41,33 | 7,76 | 31,78 | 0,9472 | 0,2012 | |||
| BFAM / Bright Horizons Family Solutions Inc. | 0,06 | −0,73 | 7,75 | −3,43 | 0,9465 | −0,0707 | |||
| UMBF / UMB Financial Corporation | 0,07 | 70,31 | 7,74 | 77,16 | 0,9454 | 0,3915 | |||
| CIGI / Colliers International Group Inc. | 0,06 | −0,73 | 7,65 | 6,83 | 0,9343 | 0,0266 | |||
| GGG / Graco Inc. | 0,09 | −0,73 | 7,63 | 2,21 | 0,9324 | −0,0145 | |||
| SYBT / Stock Yards Bancorp, Inc. | 0,10 | 11,88 | 7,54 | 27,95 | 0,9214 | 0,1740 | |||
| BRC / Brady Corporation | 0,11 | 37,62 | 7,54 | 32,42 | 0,9214 | 0,1992 | |||
| TDW / Tidewater Inc. | 0,16 | 4,15 | 7,52 | 13,67 | 0,9182 | 0,0798 | |||
| CR / Crane Company | 0,04 | −0,73 | 7,34 | 23,08 | 0,8962 | 0,1404 | |||
| TSCO / Tractor Supply Company | 0,14 | −0,73 | 7,25 | −4,92 | 0,8859 | −0,0812 | |||
| AWR / American States Water Company | 0,09 | 23,96 | 7,16 | 20,77 | 0,8743 | 0,1230 | |||
| ESI / Element Solutions Inc | 0,31 | −0,73 | 7,13 | −0,54 | 0,8705 | −0,0380 | |||
| WINA / Winmark Corporation | 0,02 | −0,73 | 7,11 | 17,93 | 0,8679 | 0,1041 | |||
| CRAI / CRA International, Inc. | 0,04 | −0,73 | 6,98 | 7,40 | 0,8528 | 0,0286 | |||
| EPAC / Enerpac Tool Group Corp. | 0,17 | 4,87 | 6,97 | −5,18 | 0,8517 | −0,0806 | |||
| CSW / CSW Industrials, Inc. | 0,02 | −10,77 | 6,93 | −12,21 | 0,8461 | −0,1541 | |||
| HLI / Houlihan Lokey, Inc. | 0,04 | −0,73 | 6,86 | 10,61 | 0,8378 | 0,0517 | |||
| TECH / Bio-Techne Corporation | 0,13 | −16,64 | 6,82 | −26,85 | 0,8332 | −0,3490 | |||
| WLY / John Wiley & Sons, Inc. | 0,15 | 109,07 | 6,74 | 109,45 | 0,8232 | 0,4152 | |||
| EXPO / Exponent, Inc. | 0,09 | −11,72 | 6,70 | −18,64 | 0,8185 | −0,2256 | |||
| FFIN / First Financial Bankshares, Inc. | 0,19 | 13,87 | 6,66 | 14,06 | 0,8136 | 0,0733 | |||
| CPK / Chesapeake Utilities Corporation | 0,05 | 31,63 | 6,47 | 23,22 | 0,7908 | 0,1247 | |||
| FOUR / Shift4 Payments, Inc. | 0,06 | −0,73 | 6,40 | 20,41 | 0,7817 | 0,1079 | |||
| VERX / Vertex, Inc. | 0,18 | −0,73 | 6,37 | 0,20 | 0,7784 | −0,0279 | |||
| US82983N1081 / Sitio Royalties Corp | 0,34 | −3,22 | 6,29 | −10,47 | 0,7684 | −0,1225 | |||
| ABG / Asbury Automotive Group, Inc. | 0,03 | −39,38 | 6,26 | −34,52 | 0,7644 | −0,4473 | |||
| HAYW / Hayward Holdings, Inc. | 0,45 | −0,73 | 6,19 | −1,59 | 0,7562 | −0,0413 | |||
| JKHY / Jack Henry & Associates, Inc. | 0,03 | −0,73 | 6,15 | −2,04 | 0,7512 | −0,0448 | |||
| IBP / Installed Building Products, Inc. | 0,03 | 17,10 | 6,14 | 23,18 | 0,7497 | 0,1179 | |||
| SSD / Simpson Manufacturing Co., Inc. | 0,04 | −0,72 | 5,98 | −1,84 | 0,7299 | −0,0419 | |||
| STC / Stewart Information Services Corporation | 0,09 | 0,00 | 5,97 | −8,77 | 0,7291 | −0,1003 | |||
| NPO / Enpro Inc. | 0,03 | −0,73 | 5,62 | 17,53 | 0,6870 | 0,0803 | |||
| VSEC / VSE Corporation | 0,04 | −0,73 | 5,48 | 8,38 | 0,6698 | 0,0283 | |||
| HLNE / Hamilton Lane Incorporated | 0,04 | −0,72 | 5,16 | −5,09 | 0,6305 | −0,0590 | |||
| BMI / Badger Meter, Inc. | 0,02 | −0,72 | 5,11 | 27,82 | 0,6247 | 0,1174 | |||
| LKFN / Lakeland Financial Corporation | 0,08 | 18,16 | 5,10 | 22,15 | 0,6232 | 0,0937 | |||
| FND / Floor & Decor Holdings, Inc. | 0,07 | −0,73 | 5,10 | −6,28 | 0,6230 | −0,0670 | |||
| STVN / Stevanato Group S.p.A. | 0,21 | −0,73 | 5,09 | 18,75 | 0,6213 | 0,0784 | |||
| POOL / Pool Corporation | 0,02 | −29,22 | 5,08 | −35,20 | 0,6206 | −0,3734 | |||
| BL / BlackLine, Inc. | 0,09 | 91,07 | 5,04 | 123,43 | 0,6152 | 0,3294 | |||
| TREX / Trex Company, Inc. | 0,09 | 31,65 | 5,01 | 23,24 | 0,6114 | 0,0964 | |||
| UFPT / UFP Technologies, Inc. | 0,02 | −0,73 | 4,67 | 20,17 | 0,5706 | 0,0778 | |||
| SITE / SiteOne Landscape Supply, Inc. | 0,04 | −0,73 | 4,67 | −1,14 | 0,5705 | −0,0284 | |||
| VNOM / Viper Energy, Inc. | 0,12 | −0,73 | 4,48 | −16,15 | 0,5467 | −0,1301 | |||
| AMSF / AMERISAFE, Inc. | 0,10 | −0,73 | 4,39 | −17,40 | 0,5364 | −0,1375 | |||
| CWST / Casella Waste Systems, Inc. | 0,04 | −0,73 | 4,34 | 2,70 | 0,5299 | −0,0055 | |||
| OII / Oceaneering International, Inc. | 0,21 | −4,04 | 4,32 | −8,82 | 0,5275 | −0,0731 | |||
| CCCS / CCC Intelligent Solutions Holdings Inc. | 0,45 | 326,64 | 4,28 | 344,91 | 0,5228 | 0,4008 | |||
| WST / West Pharmaceutical Services, Inc. | 0,02 | −0,73 | 4,17 | −2,98 | 0,5095 | −0,0355 | |||
| KN / Knowles Corporation | 0,23 | 29,26 | 4,10 | 49,87 | 0,5010 | 0,1540 | |||
| TRNS / Transcat, Inc. | 0,05 | −0,73 | 3,98 | 14,62 | 0,4857 | 0,0459 | |||
| MUSA / Murphy USA Inc. | 0,01 | 3,78 | 0,4617 | 0,4617 | |||||
| NOVT / Novanta Inc. | 0,03 | −0,73 | 3,72 | 0,08 | 0,4542 | −0,0167 | |||
| CHD / Church & Dwight Co., Inc. | 0,03 | −0,72 | 3,31 | −13,34 | 0,4047 | −0,0799 | |||
| WHD / Cactus, Inc. | 0,07 | −5,14 | 3,22 | −9,51 | 0,3930 | −0,0578 | |||
| HGTY / Hagerty, Inc. | 0,31 | 2,11 | 3,09 | 14,22 | 0,3777 | 0,0344 | |||
| TVK / TerraVest Industries Inc. | 0,02 | 0,00 | 3,03 | 25,72 | 0,3697 | 0,0645 | |||
| WSC / WillScot Holdings Corporation | 0,11 | −0,73 | 2,91 | −2,15 | 0,3552 | −0,0216 | |||
| SAIA / Saia, Inc. | 0,01 | 2,79 | 0,3406 | 0,3406 | |||||
| WDFC / WD-40 Company | 0,01 | −13,63 | 2,79 | −19,26 | 0,3405 | −0,0972 | |||
| REVG / REV Group, Inc. | 0,05 | 348,01 | 2,60 | 576,10 | 0,3180 | 0,2691 | |||
| CRVL / CorVel Corporation | 0,02 | −51,54 | 2,33 | −55,53 | 0,2840 | −0,3787 | |||
| MLR / Miller Industries, Inc. | 0,05 | 20,88 | 2,22 | 26,83 | 0,2714 | 0,0493 | |||
| VVV / Valvoline Inc. | 0,05 | 0,00 | 2,03 | 8,78 | 0,2482 | 0,0114 | |||
| TPL / Texas Pacific Land Corporation | 0,00 | −0,76 | 1,94 | −20,87 | 0,2366 | −0,0738 | |||
| CMDXF / Computer Modelling Group Ltd. | 0,30 | −0,73 | 1,59 | −6,21 | 0,1936 | −0,0207 |