Grundläggande statistik
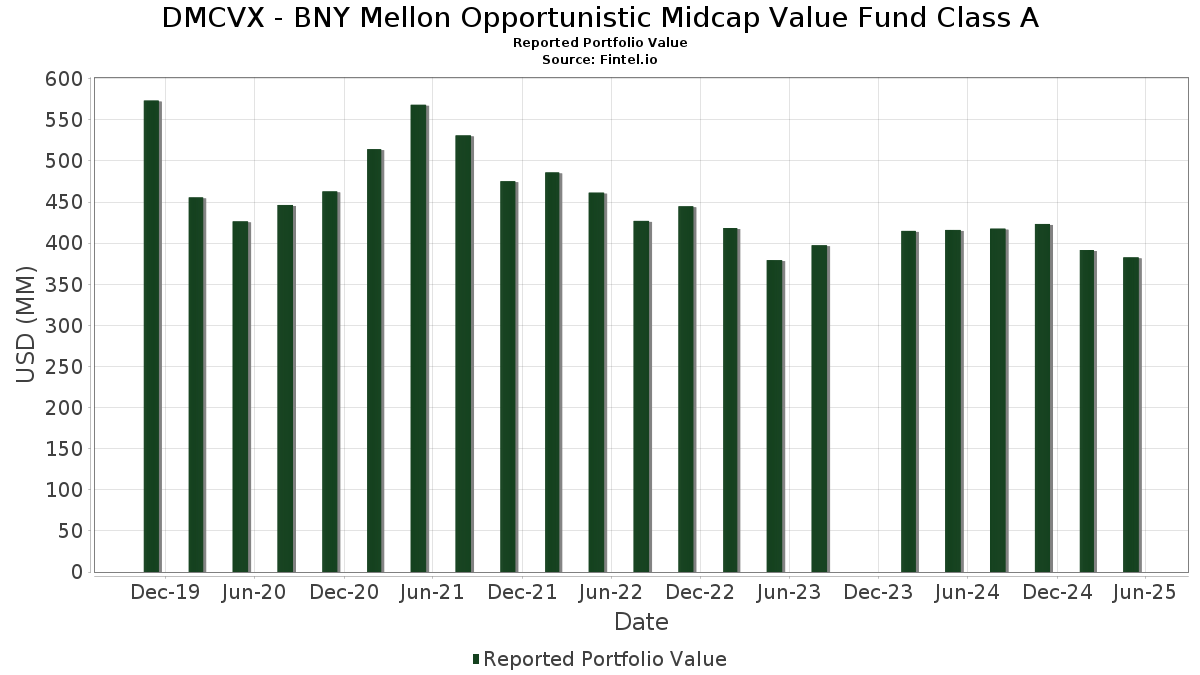
| Portföljvärde | $ 382 718 603 |
| Aktuella positioner | 69 |
Senaste innehav, resultat, förvaltat kapital (från 13F, 13D)
DMCVX - BNY Mellon Opportunistic Midcap Value Fund Class A har redovisat 69 totala innehav i sina senaste SEC-arkiveringar. Det senaste portföljvärdet beräknas vara $ 382 718 603 USD. Faktiskt förvaltade tillgångar (AUM) är detta värde plus likvida medel (som inte redovisas). DMCVX - BNY Mellon Opportunistic Midcap Value Fund Class As största innehav är Johnson Controls International plc (US:JCI) , Encompass Health Corporation (US:EHC) , Exelon Corporation (US:EXC) , Dominion Energy, Inc. (US:D) , and Kenvue Inc. (US:KVUE) . DMCVX - BNY Mellon Opportunistic Midcap Value Fund Class As nya positioner inkluderar Block, Inc. (US:XYZ) , Healthpeak Properties, Inc. (US:PEAK) , SLM Corporation (US:SLM) , Ulta Beauty, Inc. (US:ULTA) , and Clean Harbors, Inc. (US:CLH) .
Största ökningarna detta kvartal
Vi använder förändringen i portföljallokeringen eftersom det är det mest meningsfulla måttet. Förändringar kan bero på transaktioner eller förändringar i aktiekurser.
| Värdepapper | Aktier (MM) |
Värde (MM$) |
Portfölj % av | ΔPortfölj % av |
|---|---|---|---|---|
| 9,22 | 9,22 | 2,4501 | 2,4501 | |
| 6,53 | 6,53 | 1,7338 | 1,7338 | |
| 0,10 | 6,27 | 1,6647 | 1,6647 | |
| 0,35 | 6,17 | 1,6393 | 1,6393 | |
| 0,19 | 6,03 | 1,6015 | 1,6015 | |
| 0,01 | 6,00 | 1,5929 | 1,5929 | |
| 0,03 | 5,70 | 1,5151 | 1,5151 | |
| 0,44 | 5,58 | 1,4810 | 1,4810 | |
| 0,03 | 5,40 | 1,4354 | 1,4354 | |
| 0,04 | 3,76 | 0,9988 | 0,9988 |
Största minskningarna detta kvartal
Vi använder förändringen i portföljallokeringen eftersom det är det mest meningsfulla måttet. Förändringar kan bero på transaktioner eller förändringar i aktiepriser.
| Värdepapper | Aktier (MM) |
Värde (MM$) |
Portfölj % av | ΔPortfölj % av |
|---|---|---|---|---|
| 0,11 | 4,40 | 1,1683 | −1,3965 | |
| 0,02 | 4,50 | 1,1957 | −1,1162 | |
| 0,03 | 2,89 | 0,7666 | −0,9802 | |
| 0,14 | 4,25 | 1,1278 | −0,8356 | |
| 0,03 | 5,54 | 1,4711 | −0,7829 | |
| 0,05 | 3,73 | 0,9913 | −0,6203 | |
| 0,11 | 5,63 | 1,4953 | −0,5166 | |
| 0,08 | 5,01 | 1,3313 | −0,5006 | |
| 0,23 | 2,70 | 0,7183 | −0,3803 | |
| 0,06 | 3,78 | 1,0046 | −0,3493 |
13F- och fond arkiveringar
Denna blankett lämnades in den 2025-07-29 för rapporteringsperioden 2025-05-31. Klicka på länksymbolen för att se hela transaktionshistoriken.
Uppgradera för att låsa upp premiumdata och exportera till Excel![]() .
.
| Värdepapper | Typ | Genomsnittligt aktiepris | Aktier (MM) |
ΔAktier (%) |
ΔAktier (%) |
Värde ($MM) |
Portfölj (%) |
ΔPortfölj (%) |
|
|---|---|---|---|---|---|---|---|---|---|
| JCI / Johnson Controls International plc | 0,11 | −3,78 | 11,14 | 13,87 | 2,9602 | 0,4625 | |||
| DREYFUS INSTITUTIONAL PREFERRED GOVERNMENT PLUS MONEY MARKET FUND / STIV (000000000) | 9,22 | 9,22 | 2,4501 | 2,4501 | |||||
| EHC / Encompass Health Corporation | 0,07 | −6,01 | 8,75 | 13,49 | 2,3249 | 0,3565 | |||
| EXC / Exelon Corporation | 0,19 | 16,92 | 8,42 | 15,92 | 2,2362 | 0,3828 | |||
| D / Dominion Energy, Inc. | 0,14 | −3,78 | 8,21 | −3,69 | 2,1821 | 0,0052 | |||
| KVUE / Kenvue Inc. | 0,34 | 0,12 | 8,20 | 1,27 | 2,1772 | 0,1116 | |||
| FHN / First Horizon Corporation | 0,40 | −3,78 | 8,00 | −11,19 | 2,1263 | −0,1741 | |||
| RNR / RenaissanceRe Holdings Ltd. | 0,03 | −3,78 | 7,99 | 1,00 | 2,1214 | 0,1033 | |||
| NEM / Newmont Corporation | 0,15 | −20,80 | 7,84 | −2,54 | 2,0815 | 0,0297 | |||
| AIZ / Assurant, Inc. | 0,04 | −3,78 | 7,82 | −6,05 | 2,0762 | −0,0471 | |||
| DLR / Digital Realty Trust, Inc. | 0,04 | −16,24 | 7,64 | −8,09 | 2,0298 | −0,0922 | |||
| LPLA / LPL Financial Holdings Inc. | 0,02 | −3,78 | 7,61 | 0,21 | 2,0207 | 0,0834 | |||
| PWR / Quanta Services, Inc. | 0,02 | −3,78 | 7,45 | 26,94 | 1,9779 | 0,4810 | |||
| EFX / Equifax Inc. | 0,03 | 16,29 | 7,28 | 25,31 | 1,9344 | 0,4512 | |||
| DLB / Dolby Laboratories, Inc. | 0,10 | 12,07 | 7,26 | 1,98 | 1,9280 | 0,1115 | |||
| CEG / Constellation Energy Corporation | 0,02 | −5,25 | 6,90 | 15,78 | 1,8324 | 0,3118 | |||
| SKX / Skechers U.S.A., Inc. | 0,11 | −4,67 | 6,69 | −3,02 | 1,7764 | 0,0165 | |||
| DREYFUS INSTITUTIONAL PREFERRED GOVERNMENT PLUS MONEY MARKET FUND / STIV (000000000) | 6,53 | 6,53 | 1,7338 | 1,7338 | |||||
| BAX / Baxter International Inc. | 0,21 | −4,36 | 6,35 | −15,47 | 1,6866 | −0,2305 | |||
| AR / Antero Resources Corporation | 0,17 | −12,91 | 6,29 | −11,13 | 1,6715 | −0,1355 | |||
| XYZ / Block, Inc. | 0,10 | 6,27 | 1,6647 | 1,6647 | |||||
| PEAK / Healthpeak Properties, Inc. | 0,35 | 6,17 | 1,6393 | 1,6393 | |||||
| CRH / CRH plc | 0,07 | 1,71 | 6,10 | −9,57 | 1,6198 | −0,1009 | |||
| VOYA / Voya Financial, Inc. | 0,09 | 7,40 | 6,06 | −1,13 | 1,6095 | 0,0455 | |||
| SLM / SLM Corporation | 0,19 | 6,03 | 1,6015 | 1,6015 | |||||
| ULTA / Ulta Beauty, Inc. | 0,01 | 6,00 | 1,5929 | 1,5929 | |||||
| WY / Weyerhaeuser Company | 0,23 | 7,43 | 5,92 | −7,53 | 1,5727 | −0,0613 | |||
| WCN / Waste Connections, Inc. | 0,03 | −3,78 | 5,84 | −0,05 | 1,5517 | 0,0600 | |||
| CCK / Crown Holdings, Inc. | 0,06 | 143,09 | 5,75 | 167,22 | 1,5269 | 0,9778 | |||
| CTSH / Cognizant Technology Solutions Corporation | 0,07 | 1,67 | 5,71 | −1,18 | 1,5155 | 0,0420 | |||
| CLH / Clean Harbors, Inc. | 0,03 | 5,70 | 1,5151 | 1,5151 | |||||
| IP / International Paper Company | 0,12 | −3,78 | 5,70 | −18,36 | 1,5147 | −0,2679 | |||
| TAP / Molson Coors Beverage Company | 0,11 | −18,34 | 5,63 | −28,59 | 1,4953 | −0,5166 | |||
| RKT / Rocket Companies, Inc. | 0,44 | 5,58 | 1,4810 | 1,4810 | |||||
| GEV / GE Vernova Inc. | 0,01 | −4,36 | 5,57 | 34,97 | 1,4794 | 0,4262 | |||
| EXPE / Expedia Group, Inc. | 0,03 | −25,56 | 5,54 | −37,30 | 1,4711 | −0,7829 | |||
| FIS / Fidelity National Information Services, Inc. | 0,07 | 4,77 | 5,46 | 17,28 | 1,4498 | 0,2621 | |||
| LOPE / Grand Canyon Education, Inc. | 0,03 | 5,40 | 1,4354 | 1,4354 | |||||
| LH / Labcorp Holdings Inc. | 0,02 | −3,78 | 5,26 | −4,57 | 1,3984 | −0,0095 | |||
| VLO / Valero Energy Corporation | 0,04 | −3,78 | 5,18 | −5,07 | 1,3769 | −0,0167 | |||
| GMED / Globus Medical, Inc. | 0,08 | −5,24 | 5,01 | −30,19 | 1,3313 | −0,5006 | |||
| ACM / AECOM | 0,05 | −19,75 | 5,01 | −11,90 | 1,3313 | −0,1204 | |||
| FCX / Freeport-McMoRan Inc. | 0,13 | 6,85 | 5,01 | 11,40 | 1,3297 | 0,1828 | |||
| NSC / Norfolk Southern Corporation | 0,02 | −23,39 | 4,77 | −22,97 | 1,2681 | −0,3134 | |||
| RMBS / Rambus Inc. | 0,09 | −4,70 | 4,76 | −8,82 | 1,2653 | −0,0680 | |||
| FERG / Ferguson Enterprises Inc. | 0,03 | −23,87 | 4,76 | −21,80 | 1,2649 | −0,2890 | |||
| RGA / Reinsurance Group of America, Incorporated | 0,02 | −20,97 | 4,75 | −20,74 | 1,2620 | −0,2676 | |||
| CACI / CACI International Inc | 0,01 | −28,98 | 4,63 | −9,23 | 1,2312 | −0,0718 | |||
| BURL / Burlington Stores, Inc. | 0,02 | −45,73 | 4,50 | −50,31 | 1,1957 | −1,1162 | |||
| OMC / Omnicom Group Inc. | 0,06 | 69,47 | 4,46 | 50,40 | 1,1859 | 0,4283 | |||
| FANG / Diamondback Energy, Inc. | 0,03 | 25,35 | 4,40 | 6,10 | 1,1684 | 0,1104 | |||
| ARMK / Aramark | 0,11 | −59,97 | 4,40 | −56,24 | 1,1683 | −1,3965 | |||
| LVS / Las Vegas Sands Corp. | 0,11 | −5,28 | 4,40 | −12,80 | 1,1678 | −0,1189 | |||
| PINS / Pinterest, Inc. | 0,14 | −34,40 | 4,25 | −44,82 | 1,1278 | −0,8356 | |||
| KNX / Knight-Swift Transportation Holdings Inc. | 0,10 | 22,44 | 4,23 | 7,58 | 1,1232 | 0,1202 | |||
| HUBB / Hubbell Incorporated | 0,01 | 110,20 | 4,05 | 120,46 | 1,0766 | 0,6072 | |||
| CNC / Centene Corporation | 0,07 | −3,78 | 3,93 | −6,63 | 1,0432 | −0,0302 | |||
| CF / CF Industries Holdings, Inc. | 0,04 | −31,29 | 3,92 | −23,08 | 1,0415 | −0,2592 | |||
| HAS / Hasbro, Inc. | 0,06 | −30,42 | 3,78 | −28,71 | 1,0046 | −0,3493 | |||
| FRT / Federal Realty Investment Trust | 0,04 | 3,76 | 0,9988 | 0,9988 | |||||
| AKAM / Akamai Technologies, Inc. | 0,05 | −37,21 | 3,73 | −40,91 | 0,9913 | −0,6203 | |||
| GPS / The Gap, Inc. | 0,15 | 3,43 | 0,9100 | 0,9100 | |||||
| BNTX / BioNTech SE - Depositary Receipt (Common Stock) | 0,03 | 39,42 | 3,06 | 18,28 | 0,8130 | 0,1527 | |||
| BPOP / Popular, Inc. | 0,03 | −59,10 | 2,89 | −57,83 | 0,7666 | −0,9802 | |||
| FTAI / FTAI Aviation Ltd. | 0,02 | 2,86 | 0,7602 | 0,7602 | |||||
| DATABRICKS INC / EC (000000000) | 0,03 | 2,73 | 0,7244 | 0,7244 | |||||
| NOV / NOV Inc. | 0,23 | −21,89 | 2,70 | −37,17 | 0,7183 | −0,3803 | |||
| TSN / Tyson Foods, Inc. | 0,03 | −4,41 | 1,86 | −12,49 | 0,4951 | −0,0484 | |||
| Databricks Inc Series I Preferred / EP (000000000) | 0,00 | 0,22 | 0,0597 | 0,0597 |