Grundläggande statistik
| Portföljvärde | $ 279 665 146 |
| Aktuella positioner | 70 |
Senaste innehav, resultat, förvaltat kapital (från 13F, 13D)
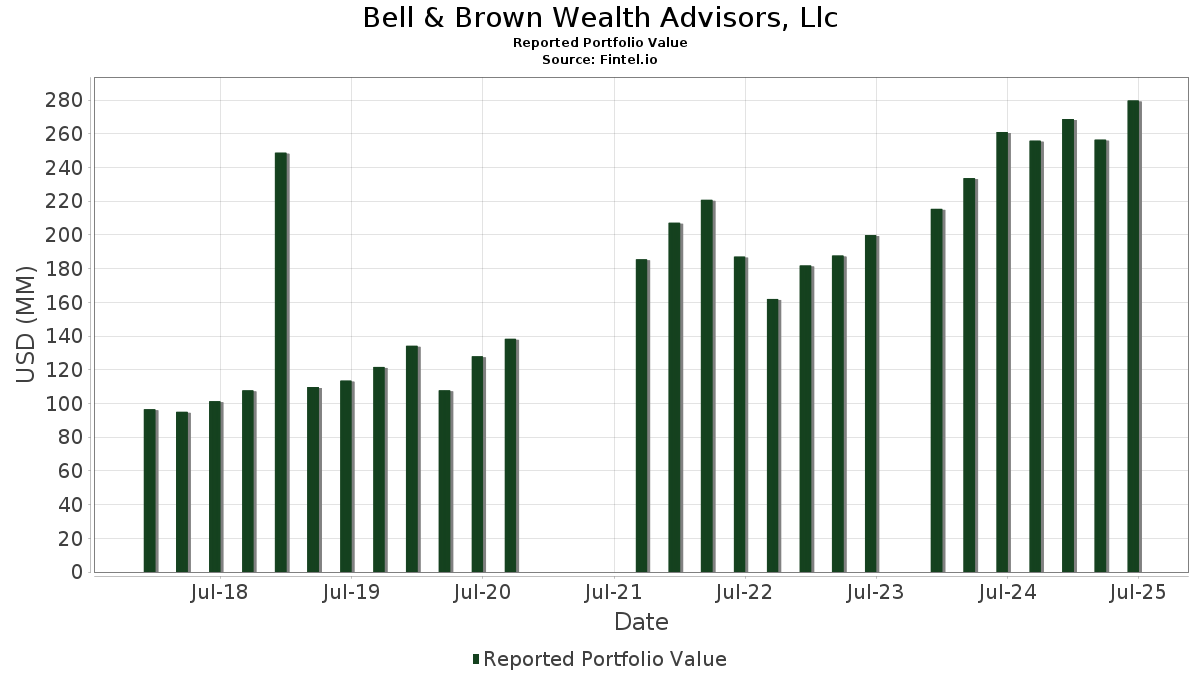
Bell & Brown Wealth Advisors, Llc har redovisat 70 totala innehav i sina senaste SEC-arkiveringar. Det senaste portföljvärdet beräknas vara $ 279 665 146 USD. Faktiskt förvaltade tillgångar (AUM) är detta värde plus likvida medel (som inte redovisas). Bell & Brown Wealth Advisors, Llcs största innehav är Broadcom Inc. (US:AVGO) , Apple Inc. (US:AAPL) , Meta Platforms, Inc. (US:META) , Alphabet Inc. (US:GOOGL) , and The Goldman Sachs Group, Inc. (US:GS) . Bell & Brown Wealth Advisors, Llcs nya positioner inkluderar Capital One Financial Corporation (US:COF) , Target Corporation (US:TGT) , .
Största ökningarna detta kvartal
Vi använder förändringen i portföljallokeringen eftersom det är det mest meningsfulla måttet. Förändringar kan bero på transaktioner eller förändringar i aktiekurser.
| Värdepapper | Aktier (MM) |
Värde (MM$) |
Portfölj % av | ΔPortfölj % av |
|---|---|---|---|---|
| 0,06 | 17,73 | 6,3415 | 1,8164 | |
| 0,02 | 3,72 | 1,3316 | 1,3316 | |
| 0,03 | 6,66 | 2,3802 | 0,6953 | |
| 0,02 | 12,59 | 4,5018 | 0,6145 | |
| 0,01 | 10,12 | 3,6181 | 0,5445 | |
| 0,02 | 8,05 | 2,8773 | 0,4130 | |
| 0,01 | 6,76 | 2,4168 | 0,3532 | |
| 0,05 | 6,66 | 2,3801 | 0,3161 | |
| 0,04 | 7,66 | 2,7379 | 0,3042 | |
| 0,03 | 9,85 | 3,5230 | 0,2772 |
Största minskningarna detta kvartal
Vi använder förändringen i portföljallokeringen eftersom det är det mest meningsfulla måttet. Förändringar kan bero på transaktioner eller förändringar i aktiepriser.
| Värdepapper | Aktier (MM) |
Värde (MM$) |
Portfölj % av | ΔPortfölj % av |
|---|---|---|---|---|
| 0,00 | 0,00 | −1,1751 | ||
| 0,01 | 9,81 | 3,5080 | −0,8878 | |
| 0,06 | 12,79 | 4,5726 | −0,7981 | |
| 0,07 | 8,01 | 2,8635 | −0,6056 | |
| 0,04 | 4,42 | 1,5821 | −0,4143 | |
| 0,03 | 4,21 | 1,5060 | −0,3766 | |
| 0,09 | 3,65 | 1,3042 | −0,3436 | |
| 0,04 | 1,97 | 0,7029 | −0,3120 | |
| 0,04 | 3,45 | 1,2324 | −0,2961 | |
| 0,01 | 6,20 | 2,2159 | −0,2895 |
13F- och fond arkiveringar
Denna blankett lämnades in den 2025-07-29 för rapporteringsperioden 2025-06-30. Klicka på länksymbolen för att se hela transaktionshistoriken.
Uppgradera för att låsa upp premiumdata och exportera till Excel![]() .
.
| Värdepapper | Typ | Genomsnittligt aktiepris | Aktier (MM) |
ΔAktier (%) |
ΔAktier (%) |
Värde ($MM) |
Portfölj (%) |
ΔPortfölj (%) |
|
|---|---|---|---|---|---|---|---|---|---|
| AVGO / Broadcom Inc. | 0,06 | −7,17 | 17,73 | 52,84 | 6,3415 | 1,8164 | |||
| AAPL / Apple Inc. | 0,06 | 0,55 | 12,79 | −7,14 | 4,5726 | −0,7981 | |||
| META / Meta Platforms, Inc. | 0,02 | −1,47 | 12,59 | 26,29 | 4,5018 | 0,6145 | |||
| GOOGL / Alphabet Inc. | 0,06 | −1,32 | 10,23 | 12,46 | 3,6566 | 0,1104 | |||
| GS / The Goldman Sachs Group, Inc. | 0,01 | −0,92 | 10,12 | 28,37 | 3,6181 | 0,5445 | |||
| JPM / JPMorgan Chase & Co. | 0,03 | 0,15 | 9,85 | 18,37 | 3,5230 | 0,2772 | |||
| LLY / Eli Lilly and Company | 0,01 | −7,84 | 9,81 | −12,97 | 3,5080 | −0,8878 | |||
| AMZN / Amazon.com, Inc. | 0,04 | −2,68 | 8,32 | 12,07 | 2,9748 | 0,0798 | |||
| MSFT / Microsoft Corporation | 0,02 | −3,81 | 8,05 | 27,33 | 2,8773 | 0,4130 | |||
| XOM / Exxon Mobil Corporation | 0,07 | −0,66 | 8,01 | −9,98 | 2,8635 | −0,6056 | |||
| BA / The Boeing Company | 0,04 | −0,06 | 7,66 | 22,71 | 2,7379 | 0,3042 | |||
| WFC / Wells Fargo & Company | 0,09 | −0,62 | 7,31 | 10,91 | 2,6131 | 0,0438 | |||
| QCOM / QUALCOMM Incorporated | 0,05 | −0,22 | 7,23 | 3,16 | 2,5837 | −0,1479 | |||
| ULTA / Ulta Beauty, Inc. | 0,01 | 0,31 | 6,76 | 27,73 | 2,4168 | 0,3532 | |||
| ORCL / Oracle Corporation | 0,03 | −1,48 | 6,66 | 54,07 | 2,3802 | 0,6953 | |||
| DIS / The Walt Disney Company | 0,05 | 0,10 | 6,66 | 25,77 | 2,3801 | 0,3161 | |||
| COST / Costco Wholesale Corporation | 0,01 | −7,95 | 6,20 | −3,53 | 2,2159 | −0,2895 | |||
| VLO / Valero Energy Corporation | 0,04 | −0,43 | 5,73 | 1,33 | 2,0490 | −0,1565 | |||
| WMT / Walmart Inc. | 0,06 | 0,59 | 5,64 | 12,04 | 2,0169 | 0,0537 | |||
| PYPL / PayPal Holdings, Inc. | 0,07 | 1,77 | 5,48 | 15,75 | 1,9608 | 0,1135 | |||
| WSM / Williams-Sonoma, Inc. | 0,03 | 0,47 | 5,06 | 3,79 | 1,8108 | −0,0920 | |||
| AXP / American Express Company | 0,01 | −0,14 | 4,68 | 18,38 | 1,6723 | 0,1320 | |||
| FDX / FedEx Corporation | 0,02 | −0,50 | 4,67 | −6,86 | 1,6703 | −0,2856 | |||
| GLD / SPDR Gold Trust | 0,02 | −0,09 | 4,59 | 5,71 | 1,6421 | −0,0523 | |||
| SBUX / Starbucks Corporation | 0,05 | 0,82 | 4,45 | −5,82 | 1,5914 | −0,2514 | |||
| BABA / Alibaba Group Holding Limited - Depositary Receipt (Common Stock) | 0,04 | 0,77 | 4,42 | −13,58 | 1,5821 | −0,4143 | |||
| CVX / Chevron Corporation | 0,03 | 1,92 | 4,21 | −12,76 | 1,5060 | −0,3766 | |||
| TSLA / Tesla, Inc. | 0,01 | −0,79 | 4,17 | 21,60 | 1,4921 | 0,1541 | |||
| RTX / RTX Corporation | 0,03 | −2,94 | 3,91 | 6,83 | 1,3982 | −0,0293 | |||
| COF / Capital One Financial Corporation | 0,02 | 3,72 | 1,3316 | 1,3316 | |||||
| OXY / Occidental Petroleum Corporation | 0,09 | 1,59 | 3,65 | −13,68 | 1,3042 | −0,3436 | |||
| HD / The Home Depot, Inc. | 0,01 | 0,86 | 3,52 | 0,92 | 1,2601 | −0,1018 | |||
| MRK / Merck & Co., Inc. | 0,04 | −0,30 | 3,45 | −12,07 | 1,2324 | −0,2961 | |||
| WMB / The Williams Companies, Inc. | 0,05 | −0,19 | 3,21 | 4,46 | 1,1466 | −0,0502 | |||
| KO / The Coca-Cola Company | 0,05 | 1,01 | 3,20 | −0,25 | 1,1457 | −0,1065 | |||
| MCD / McDonald's Corporation | 0,01 | −1,52 | 3,13 | −7,88 | 1,1201 | −0,2060 | |||
| AMGN / Amgen Inc. | 0,01 | 2,17 | 3,12 | −8,13 | 1,1154 | −0,2085 | |||
| PG / The Procter & Gamble Company | 0,02 | 1,23 | 2,88 | −5,36 | 1,0293 | −0,1569 | |||
| UBER / Uber Technologies, Inc. | 0,03 | 0,20 | 2,80 | 28,28 | 1,0025 | 0,1504 | |||
| C / Citigroup Inc. | 0,03 | 0,51 | 2,64 | 20,53 | 0,9426 | 0,0896 | |||
| PEP / PepsiCo, Inc. | 0,02 | 1,46 | 2,63 | −10,65 | 0,9419 | −0,2077 | |||
| DD / DuPont de Nemours, Inc. | 0,04 | 1,61 | 2,52 | −6,67 | 0,9004 | −0,1518 | |||
| NKE / NIKE, Inc. | 0,03 | 5,79 | 2,40 | 18,42 | 0,8596 | 0,0678 | |||
| KMB / Kimberly-Clark Corporation | 0,02 | 0,95 | 2,23 | −8,50 | 0,7972 | −0,1529 | |||
| BMY / Bristol-Myers Squibb Company | 0,04 | −0,48 | 1,97 | −24,48 | 0,7029 | −0,3120 | |||
| TGT / Target Corporation | 0,02 | 4,15 | 1,95 | −1,82 | 0,6959 | −0,0772 | |||
| CTVA / Corteva, Inc. | 0,03 | −2,42 | 1,92 | 15,58 | 0,6871 | 0,0387 | |||
| NFLX / Netflix, Inc. | 0,00 | −3,17 | 1,77 | 37,20 | 0,6345 | 0,1301 | |||
| TK / Teekay Corporation Ltd. | 0,20 | 0,53 | 1,66 | 26,24 | 0,5919 | 0,0805 | |||
| LULU / lululemon athletica inc. | 0,01 | −0,11 | 1,56 | −16,15 | 0,5590 | −0,1681 | |||
| CE / Celanese Corporation | 0,03 | 63,15 | 1,50 | 59,05 | 0,5375 | 0,1688 | |||
| LOW / Lowe's Companies, Inc. | 0,01 | −0,73 | 1,21 | −5,55 | 0,4323 | −0,0669 | |||
| NVDA / NVIDIA Corporation | 0,01 | 3,21 | 1,12 | 50,61 | 0,3992 | 0,1098 | |||
| GE / General Electric Company | 0,00 | −3,08 | 1,01 | 24,35 | 0,3618 | 0,0446 | |||
| GOOG / Alphabet Inc. | 0,00 | 2,38 | 0,76 | 14,93 | 0,2726 | 0,0138 | |||
| BRK.B / Berkshire Hathaway Inc. | 0,00 | 0,00 | 0,71 | −8,55 | 0,2528 | −0,0484 | |||
| MS / Morgan Stanley | 0,00 | 0,51 | 0,64 | 21,33 | 0,2281 | 0,0231 | |||
| CRWD / CrowdStrike Holdings, Inc. | 0,00 | −0,52 | 0,58 | 43,70 | 0,2083 | 0,0502 | |||
| DOW / Dow Inc. | 0,02 | −1,35 | 0,45 | −25,21 | 0,1594 | −0,0730 | |||
| GEV / GE Vernova Inc. | 0,00 | 1,87 | 0,43 | 77,05 | 0,1546 | 0,0591 | |||
| IOSP / Innospec Inc. | 0,00 | −4,79 | 0,42 | −15,59 | 0,1493 | −0,0434 | |||
| V / Visa Inc. | 0,00 | 4,63 | 0,34 | 6,31 | 0,1205 | −0,0035 | |||
| QQQ / Invesco QQQ Trust, Series 1 | 0,00 | 0,00 | 0,27 | 18,14 | 0,0955 | 0,0070 | |||
| NOC / Northrop Grumman Corporation | 0,00 | 0,00 | 0,24 | −2,02 | 0,0866 | −0,0100 | |||
| JNJ / Johnson & Johnson | 0,00 | 7,95 | 0,22 | −0,90 | 0,0786 | −0,0076 | |||
| EIX / Edison International | 0,00 | −19,56 | 0,21 | −29,57 | 0,0759 | −0,0416 | |||
| IBRX / ImmunityBio, Inc. | 0,08 | 32,45 | 0,21 | 16,48 | 0,0734 | 0,0045 | |||
| BAC / Bank of America Corporation | 0,00 | 0,20 | 0,0719 | 0,0719 | |||||
| RIVN / Rivian Automotive, Inc. | 0,01 | 0,00 | 0,18 | 10,18 | 0,0660 | 0,0008 | |||
| TGT / Target Corporation | Put | 0,00 | 0,05 | 0,0176 | 0,0176 | ||||
| VZ / Verizon Communications Inc. | 0,00 | −100,00 | 0,00 | −100,00 | −0,0861 | ||||
| DFS / Discover Financial Services | 0,00 | −100,00 | 0,00 | −100,00 | −1,1751 |