Grundläggande statistik
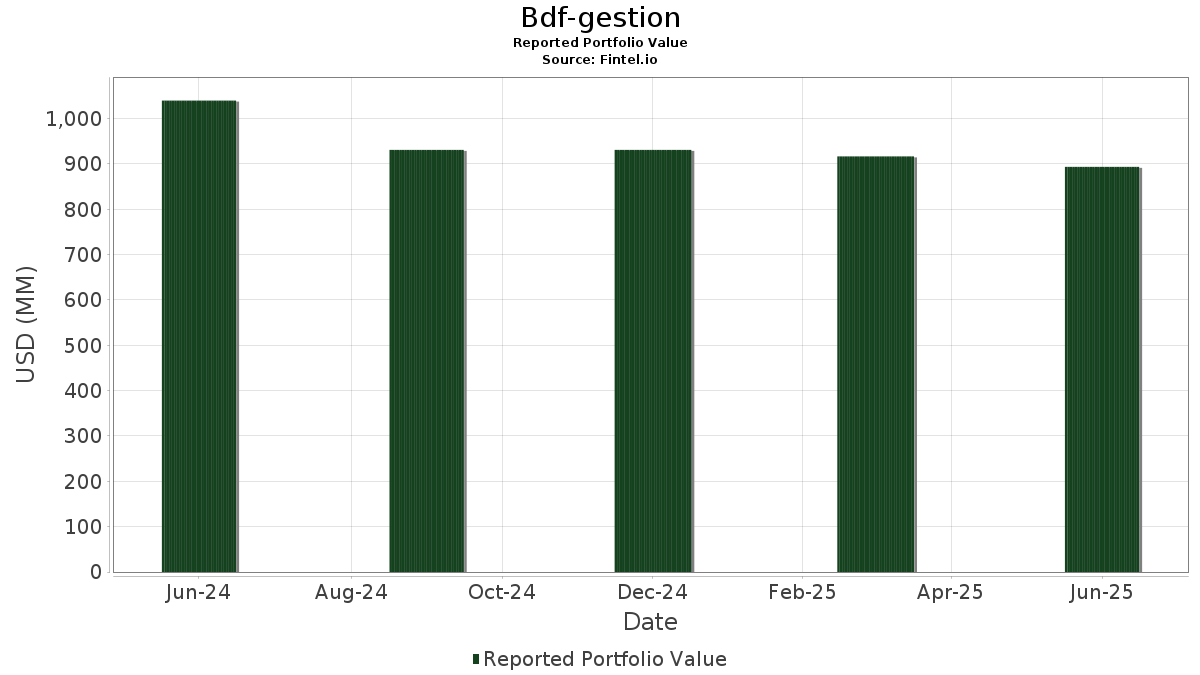
| Portföljvärde | $ 893 525 135 |
| Aktuella positioner | 137 |
Senaste innehav, resultat, förvaltat kapital (från 13F, 13D)
Bdf-gestion har redovisat 137 totala innehav i sina senaste SEC-arkiveringar. Det senaste portföljvärdet beräknas vara $ 893 525 135 USD. Faktiskt förvaltade tillgångar (AUM) är detta värde plus likvida medel (som inte redovisas). Bdf-gestions största innehav är NVIDIA Corporation (US:NVDA) , Microsoft Corporation (US:MSFT) , Apple Inc. (US:AAPL) , Meta Platforms, Inc. (US:META) , and Broadcom Inc. (US:AVGO) . Bdf-gestions nya positioner inkluderar Netflix, Inc. (US:NFLX) , Wells Fargo & Company (US:WFC) , Lam Research Corporation (US:LRCX) , .
Största ökningarna detta kvartal
Vi använder förändringen i portföljallokeringen eftersom det är det mest meningsfulla måttet. Förändringar kan bero på transaktioner eller förändringar i aktiekurser.
| Värdepapper | Aktier (MM) |
Värde (MM$) |
Portfölj % av | ΔPortfölj % av |
|---|---|---|---|---|
| 0,60 | 94,69 | 10,5970 | 3,5105 | |
| 0,12 | 33,34 | 3,7318 | 1,4929 | |
| 0,18 | 91,11 | 10,1965 | 1,3139 | |
| 0,05 | 38,09 | 4,2625 | 1,2953 | |
| 0,01 | 9,37 | 1,0491 | 1,0491 | |
| 0,08 | 22,38 | 2,5052 | 0,5726 | |
| 0,03 | 4,41 | 0,4935 | 0,4935 | |
| 0,05 | 4,01 | 0,4483 | 0,4483 | |
| 0,19 | 4,20 | 0,4699 | 0,3751 | |
| 0,03 | 6,95 | 0,7777 | 0,3403 |
Största minskningarna detta kvartal
Vi använder förändringen i portföljallokeringen eftersom det är det mest meningsfulla måttet. Förändringar kan bero på transaktioner eller förändringar i aktiepriser.
| Värdepapper | Aktier (MM) |
Värde (MM$) |
Portfölj % av | ΔPortfölj % av |
|---|---|---|---|---|
| 0,34 | 70,66 | 7,9081 | −1,3476 | |
| 0,02 | 6,46 | 0,7228 | −1,2182 | |
| 0,00 | 0,02 | 0,0026 | −1,1863 | |
| 0,14 | 24,29 | 2,7180 | −0,9511 | |
| 0,00 | 0,00 | −0,7740 | ||
| 0,06 | 4,52 | 0,5054 | −0,4982 | |
| 0,01 | 2,15 | 0,2407 | −0,4412 | |
| 0,04 | 7,74 | 0,8663 | −0,3649 | |
| 0,02 | 18,79 | 2,1024 | −0,3056 | |
| 0,00 | 0,73 | 0,0819 | −0,2535 |
13F- och fond arkiveringar
Denna blankett lämnades in den 2025-07-11 för rapporteringsperioden 2025-06-30. Klicka på länksymbolen för att se hela transaktionshistoriken.
Uppgradera för att låsa upp premiumdata och exportera till Excel![]() .
.
| Värdepapper | Typ | Genomsnittligt aktiepris | Aktier (MM) |
ΔAktier (%) |
ΔAktier (%) |
Värde ($MM) |
Portfölj (%) |
ΔPortfölj (%) |
|
|---|---|---|---|---|---|---|---|---|---|
| NVDA / NVIDIA Corporation | 0,60 | 0,00 | 94,69 | 45,78 | 10,5970 | 3,5105 | |||
| MSFT / Microsoft Corporation | 0,18 | −15,55 | 91,11 | 11,90 | 10,1965 | 1,3139 | |||
| AAPL / Apple Inc. | 0,34 | −9,82 | 70,66 | −16,71 | 7,9081 | −1,3476 | |||
| META / Meta Platforms, Inc. | 0,05 | 9,35 | 38,09 | 40,04 | 4,2625 | 1,2953 | |||
| AVGO / Broadcom Inc. | 0,12 | −1,31 | 33,34 | 62,48 | 3,7318 | 1,4929 | |||
| GOOGL / Alphabet Inc. | 0,14 | −36,40 | 24,29 | −27,79 | 2,7180 | −0,9511 | |||
| JPM / JPMorgan Chase & Co. | 0,08 | 6,92 | 22,38 | 26,37 | 2,5052 | 0,5726 | |||
| LLY / Eli Lilly and Company | 0,02 | −9,83 | 18,79 | −14,89 | 2,1024 | −0,3056 | |||
| V / Visa Inc. | 0,04 | −9,83 | 15,49 | −8,64 | 1,7336 | −0,1163 | |||
| MA / Mastercard Incorporated | 0,02 | −9,83 | 11,25 | −7,56 | 1,2591 | −0,0687 | |||
| HD / The Home Depot, Inc. | 0,03 | −9,83 | 11,16 | −9,79 | 1,2493 | −0,1007 | |||
| BAC / Bank of America Corporation | 0,23 | −28,70 | 10,72 | −19,15 | 1,1999 | −0,2469 | |||
| GSCE / GS Connect S&P GSCI Enhanced Commodity Total Return ETN | 0,02 | −30,53 | 10,69 | −10,00 | 1,1961 | −0,0994 | |||
| AMD / Advanced Micro Devices, Inc. | 0,07 | 0,00 | 10,26 | 38,12 | 1,1486 | 0,3379 | |||
| NFLX / Netflix, Inc. | 0,01 | 9,37 | 1,0491 | 1,0491 | |||||
| CRM / Salesforce, Inc. | 0,03 | 27,78 | 8,76 | 29,84 | 0,9803 | 0,2443 | |||
| VZ / Verizon Communications Inc. | 0,19 | −9,82 | 8,03 | −13,98 | 0,8987 | −0,1197 | |||
| ABT / Abbott Laboratories | 0,06 | −9,83 | 7,99 | −7,54 | 0,8944 | −0,0486 | |||
| PG / The Procter & Gamble Company | 0,05 | −9,83 | 7,86 | −15,70 | 0,8795 | −0,1375 | |||
| NOW / ServiceNow, Inc. | 0,01 | 0,00 | 7,84 | 29,15 | 0,8778 | 0,2151 | |||
| ABBV / AbbVie Inc. | 0,04 | −22,58 | 7,74 | −31,41 | 0,8663 | −0,3649 | |||
| MSI / Motorola Solutions, Inc. | 0,02 | −9,83 | 7,12 | −13,40 | 0,7973 | −0,1002 | |||
| TXN / Texas Instruments Incorporated | 0,03 | 50,00 | 6,95 | 73,33 | 0,7777 | 0,3403 | |||
| ORCL / Oracle Corporation | 0,03 | −9,83 | 6,90 | 41,02 | 0,7722 | 0,2384 | |||
| CSCO / Cisco Systems, Inc. | 0,10 | −9,82 | 6,69 | 1,39 | 0,7488 | 0,0288 | |||
| KO / The Coca-Cola Company | 0,09 | −9,82 | 6,58 | −10,92 | 0,7368 | −0,0695 | |||
| ISRG / Intuitive Surgical, Inc. | 0,01 | −5,89 | 6,53 | 3,26 | 0,7311 | 0,0409 | |||
| TJX / The TJX Companies, Inc. | 0,05 | 13,67 | 6,46 | 15,25 | 0,7234 | 0,1115 | |||
| UNH / UnitedHealth Group Incorporated | 0,02 | −39,06 | 6,46 | −63,70 | 0,7228 | −1,2182 | |||
| C / Citigroup Inc. | 0,07 | −22,38 | 6,31 | −6,94 | 0,7066 | −0,0335 | |||
| ACN / Accenture plc | 0,02 | −9,83 | 6,05 | −13,62 | 0,6771 | −0,0871 | |||
| TMUS / T-Mobile US, Inc. | 0,02 | 42,37 | 5,82 | 27,20 | 0,6512 | 0,1521 | |||
| BKT / BlackRock Income Trust, Inc. | 0,01 | −9,84 | 5,51 | −0,05 | 0,6166 | 0,0152 | |||
| MDLZ / Mondelez International, Inc. | 0,08 | −9,83 | 5,50 | −10,38 | 0,6158 | −0,0540 | |||
| DDOG / Datadog, Inc. | 0,04 | −9,82 | 5,40 | 22,10 | 0,6041 | 0,1218 | |||
| ADP / Automatic Data Processing, Inc. | 0,02 | −9,83 | 5,16 | −9,00 | 0,5774 | −0,0410 | |||
| ADSK / Autodesk, Inc. | 0,02 | −9,83 | 5,14 | 6,62 | 0,5747 | 0,0493 | |||
| LIN / Linde plc | 0,01 | −9,84 | 5,05 | −9,15 | 0,5656 | −0,0413 | |||
| TMO / Thermo Fisher Scientific Inc. | 0,01 | −9,83 | 4,99 | −26,53 | 0,5585 | −0,1825 | |||
| AXP / American Express Company | 0,02 | −9,83 | 4,97 | 6,91 | 0,5560 | 0,0490 | |||
| ALL / The Allstate Corporation | 0,02 | −9,83 | 4,89 | −12,33 | 0,5467 | −0,0612 | |||
| PLD / Prologis, Inc. | 0,05 | −9,83 | 4,85 | −15,21 | 0,5424 | −0,0812 | |||
| EA / Electronic Arts Inc. | 0,03 | −9,83 | 4,61 | −0,35 | 0,5160 | 0,0112 | |||
| MRK / Merck & Co., Inc. | 0,06 | −44,34 | 4,52 | −50,91 | 0,5054 | −0,4982 | |||
| PLTR / Palantir Technologies Inc. | 0,03 | 4,41 | 0,4935 | 0,4935 | |||||
| RSG / Republic Services, Inc. | 0,02 | −9,83 | 4,38 | −8,16 | 0,4902 | −0,0302 | |||
| MET / MetLife, Inc. | 0,05 | −9,83 | 4,21 | −9,69 | 0,4717 | −0,0374 | |||
| INTC / Intel Corporation | 0,19 | 390,24 | 4,20 | 383,64 | 0,4699 | 0,3751 | |||
| SPGI / S&P Global Inc. | 0,01 | −9,83 | 4,17 | −6,42 | 0,4666 | −0,0195 | |||
| SPG / Simon Property Group, Inc. | 0,03 | −9,83 | 4,15 | −12,73 | 0,4641 | −0,0542 | |||
| ADI / Analog Devices, Inc. | 0,02 | 0,00 | 4,13 | 18,02 | 0,4620 | 0,0804 | |||
| EQR / Equity Residential | 0,06 | −9,83 | 4,11 | −14,98 | 0,4600 | −0,0674 | |||
| ADBE / Adobe Inc. | 0,01 | −9,84 | 4,09 | −9,04 | 0,4572 | −0,0328 | |||
| HIG / The Hartford Insurance Group, Inc. | 0,03 | −9,83 | 4,01 | −7,54 | 0,4487 | −0,0244 | |||
| WFC / Wells Fargo & Company | 0,05 | 4,01 | 0,4483 | 0,4483 | |||||
| DXCM / DexCom, Inc. | 0,05 | −5,89 | 4,00 | 20,33 | 0,4478 | 0,0849 | |||
| BSX / Boston Scientific Corporation | 0,04 | −9,83 | 3,97 | −4,01 | 0,4447 | −0,0068 | |||
| SYK / Stryker Corporation | 0,01 | −9,83 | 3,97 | −4,16 | 0,4438 | −0,0077 | |||
| ZS / Zscaler, Inc. | 0,01 | 0,00 | 3,92 | 58,23 | 0,4392 | 0,1686 | |||
| WDAY / Workday, Inc. | 0,02 | −9,83 | 3,91 | −7,35 | 0,4376 | −0,0227 | |||
| BR / Broadridge Financial Solutions, Inc. | 0,02 | −9,83 | 3,89 | −9,61 | 0,4356 | −0,0342 | |||
| VTR / Ventas, Inc. | 0,06 | −9,83 | 3,65 | −17,20 | 0,4089 | −0,0724 | |||
| AMAT / Applied Materials, Inc. | 0,02 | −9,83 | 3,54 | 13,74 | 0,3967 | 0,0567 | |||
| JLL / Jones Lang LaSalle Incorporated | 0,01 | −9,83 | 3,53 | −6,96 | 0,3951 | −0,0189 | |||
| EW / Edwards Lifesciences Corporation | 0,04 | −9,83 | 3,48 | −2,69 | 0,3894 | −0,0007 | |||
| DHR / Danaher Corporation | 0,02 | −9,83 | 3,40 | −13,11 | 0,3806 | −0,0464 | |||
| QCOM / QUALCOMM Incorporated | 0,02 | −9,83 | 3,38 | −6,50 | 0,3784 | −0,0162 | |||
| CSX / CSX Corporation | 0,10 | −9,83 | 3,37 | −0,03 | 0,3775 | 0,0094 | |||
| ELV / Elevance Health, Inc. | 0,01 | −9,84 | 3,34 | −19,37 | 0,3742 | −0,0782 | |||
| INTU / Intuit Inc. | 0,00 | −9,85 | 3,33 | 15,67 | 0,3726 | 0,0585 | |||
| HOLX / Hologic, Inc. | 0,05 | −9,83 | 3,19 | −4,86 | 0,3571 | −0,0089 | |||
| RGLD / Royal Gold, Inc. | 0,02 | −9,83 | 3,19 | −1,94 | 0,3569 | 0,0021 | |||
| JNJ / Johnson & Johnson | 0,03 | −9,83 | 3,12 | 18,90 | 0,3494 | 0,0629 | |||
| ICE / Intercontinental Exchange, Inc. | 0,02 | −9,83 | 3,05 | −4,09 | 0,3410 | −0,0056 | |||
| AZO / AutoZone, Inc. | 0,00 | −9,92 | 3,03 | −12,32 | 0,3394 | −0,0379 | |||
| EHC / Encompass Health Corporation | 0,02 | −9,83 | 3,02 | 9,15 | 0,3378 | 0,0362 | |||
| CL / Colgate-Palmolive Company | 0,03 | −9,83 | 2,96 | −12,53 | 0,3313 | −0,0379 | |||
| LRCX / Lam Research Corporation | 0,03 | 2,94 | 0,3285 | 0,3285 | |||||
| CTSH / Cognizant Technology Solutions Corporation | 0,04 | −9,83 | 2,93 | −8,01 | 0,3280 | −0,0196 | |||
| NDAQ / Nasdaq, Inc. | 0,03 | 162,73 | 2,86 | 209,64 | 0,3200 | 0,2192 | |||
| FI / Fiserv, Inc. | 0,02 | −9,83 | 2,86 | −29,61 | 0,3199 | −0,1231 | |||
| AMP / Ameriprise Financial, Inc. | 0,01 | −9,84 | 2,83 | −0,60 | 0,3164 | 0,0061 | |||
| SNOW / Snowflake Inc. | 0,01 | −9,83 | 2,82 | 38,03 | 0,3161 | 0,0929 | |||
| DE / Deere & Company | 0,01 | −9,84 | 2,81 | −2,33 | 0,3148 | 0,0006 | |||
| CAT / Caterpillar Inc. | 0,01 | −9,84 | 2,79 | 6,13 | 0,3119 | 0,0254 | |||
| URI / United Rentals, Inc. | 0,00 | −9,85 | 2,79 | 8,40 | 0,3118 | 0,0313 | |||
| ANET / Arista Networks Inc | 0,03 | −9,83 | 2,78 | 19,10 | 0,3106 | 0,0563 | |||
| HON / Honeywell International Inc. | 0,01 | −9,83 | 2,75 | −0,83 | 0,3081 | 0,0052 | |||
| RMD / ResMed Inc. | 0,01 | −9,83 | 2,74 | 3,94 | 0,3070 | 0,0190 | |||
| PAYX / Paychex, Inc. | 0,02 | −9,83 | 2,74 | −14,97 | 0,3064 | −0,0449 | |||
| MAR / Marriott International, Inc. | 0,01 | −9,83 | 2,72 | 3,43 | 0,3040 | 0,0175 | |||
| VRSK / Verisk Analytics, Inc. | 0,01 | −9,84 | 2,70 | −5,63 | 0,3020 | −0,0100 | |||
| OC / Owens Corning | 0,02 | −9,83 | 2,67 | −13,16 | 0,2991 | −0,0367 | |||
| TRU / TransUnion | 0,03 | −9,83 | 2,59 | −4,36 | 0,2895 | −0,0057 | |||
| LH / Labcorp Holdings Inc. | 0,01 | −9,83 | 2,59 | 1,69 | 0,2894 | 0,0120 | |||
| CI / The Cigna Group | 0,01 | −9,83 | 2,50 | −9,39 | 0,2796 | −0,0212 | |||
| GM / General Motors Company | 0,05 | −9,83 | 2,44 | −5,65 | 0,2730 | −0,0091 | |||
| SNPS / Synopsys, Inc. | 0,00 | −9,85 | 2,43 | 7,77 | 0,2716 | 0,0259 | |||
| OTIS / Otis Worldwide Corporation | 0,02 | −9,83 | 2,39 | −13,49 | 0,2677 | −0,0339 | |||
| STE / STERIS plc | 0,01 | −9,84 | 2,31 | −4,43 | 0,2584 | −0,0052 | |||
| DECK / Deckers Outdoor Corporation | 0,02 | −9,83 | 2,29 | −16,88 | 0,2568 | −0,0444 | |||
| ETN / Eaton Corporation plc | 0,01 | −9,85 | 2,28 | 18,40 | 0,2550 | 0,0450 | |||
| WAB / Westinghouse Air Brake Technologies Corporation | 0,01 | −9,83 | 2,27 | 4,09 | 0,2535 | 0,0161 | |||
| STT / State Street Corporation | 0,02 | −9,83 | 2,24 | 7,12 | 0,2511 | 0,0225 | |||
| EQIX / Equinix, Inc. | 0,00 | −9,87 | 2,23 | −12,08 | 0,2495 | −0,0271 | |||
| CDW / CDW Corporation | 0,01 | −69,12 | 2,15 | −65,59 | 0,2407 | −0,4412 | |||
| BL / BlackLine, Inc. | 0,04 | −9,83 | 2,04 | 5,48 | 0,2286 | 0,0173 | |||
| A / Agilent Technologies, Inc. | 0,02 | −9,83 | 1,98 | −9,02 | 0,2213 | −0,0159 | |||
| J / Jacobs Solutions Inc. | 0,02 | −9,83 | 1,97 | −1,99 | 0,2210 | 0,0013 | |||
| G / Genpact Limited | 0,04 | −9,83 | 1,92 | −21,26 | 0,2144 | −0,0509 | |||
| APD / Air Products and Chemicals, Inc. | 0,01 | −9,84 | 1,90 | −13,77 | 0,2132 | −0,0278 | |||
| PKG / Packaging Corporation of America | 0,01 | −9,84 | 1,83 | −14,19 | 0,2051 | −0,0279 | |||
| DD / DuPont de Nemours, Inc. | 0,03 | −9,83 | 1,78 | −17,16 | 0,1988 | −0,0352 | |||
| HCA / HCA Healthcare, Inc. | 0,00 | −9,85 | 1,72 | −0,06 | 0,1930 | 0,0048 | |||
| TEL / TE Connectivity plc | 0,01 | −9,84 | 1,65 | 7,63 | 0,1848 | 0,0174 | |||
| CMI / Cummins Inc. | 0,01 | −9,85 | 1,65 | −5,82 | 0,1848 | −0,0065 | |||
| DELL / Dell Technologies Inc. | 0,01 | −9,83 | 1,62 | 21,29 | 0,1811 | 0,0355 | |||
| REG / Regency Centers Corporation | 0,02 | −9,83 | 1,59 | −12,92 | 0,1781 | −0,0213 | |||
| GIS / General Mills, Inc. | 0,03 | −9,83 | 1,58 | −21,89 | 0,1766 | −0,0437 | |||
| CHD / Church & Dwight Co., Inc. | 0,02 | −9,83 | 1,57 | −21,28 | 0,1759 | −0,0419 | |||
| PTC / PTC Inc. | 0,01 | −9,83 | 1,51 | 0,27 | 0,1693 | 0,0047 | |||
| SWK / Stanley Black & Decker, Inc. | 0,02 | −9,83 | 1,47 | −20,54 | 0,1641 | −0,0372 | |||
| ITW / Illinois Tool Works Inc. | 0,01 | −9,83 | 1,44 | −10,13 | 0,1609 | −0,0136 | |||
| BAH / Booz Allen Hamilton Holding Corporation | 0,01 | −9,83 | 1,43 | −10,26 | 0,1596 | −0,0137 | |||
| MSA / MSA Safety Incorporated | 0,01 | −9,83 | 1,39 | 2,97 | 0,1554 | 0,0083 | |||
| MSCI / MSCI Inc. | 0,00 | −9,86 | 1,39 | −8,02 | 0,1552 | −0,0094 | |||
| GEHC / GE HealthCare Technologies Inc. | 0,02 | −9,83 | 1,38 | −17,27 | 0,1545 | −0,0275 | |||
| MOH / Molina Healthcare, Inc. | 0,00 | −9,86 | 1,27 | −18,47 | 0,1423 | −0,0279 | |||
| NXPI / NXP Semiconductors N.V. | 0,01 | −9,83 | 1,19 | 3,74 | 0,1336 | 0,0080 | |||
| REGN / Regeneron Pharmaceuticals, Inc. | 0,00 | −50,84 | 1,15 | −59,31 | 0,1286 | −0,1795 | |||
| ALV / Autoliv, Inc. | 0,01 | −9,84 | 1,11 | 14,15 | 0,1246 | 0,0181 | |||
| RPRX / Royalty Pharma plc | 0,03 | −9,83 | 1,10 | 4,38 | 0,1229 | 0,0081 | |||
| HUM / Humana Inc. | 0,00 | −74,25 | 0,73 | −76,22 | 0,0819 | −0,2535 | |||
| MRNA / Moderna, Inc. | 0,02 | −9,83 | 0,69 | −12,28 | 0,0769 | −0,0085 | |||
| APTV / Aptiv PLC | 0,01 | −9,83 | 0,60 | 3,29 | 0,0668 | 0,0038 | |||
| TROX / Tronox Holdings plc | 0,07 | −9,83 | 0,34 | −35,24 | 0,0382 | −0,0191 | |||
| AMTM / Amentum Holdings, Inc. | 0,00 | −94,64 | 0,02 | −99,80 | 0,0026 | −1,1863 | |||
| TFX / Teleflex Incorporated | 0,00 | −100,00 | 0,00 | 0,0000 | |||||
| MCK / McKesson Corporation | 0,00 | −100,00 | 0,00 | 0,0000 | |||||
| COO / The Cooper Companies, Inc. | 0,00 | −100,00 | 0,00 | 0,0000 | |||||
| KDP / Keurig Dr Pepper Inc. | 0,00 | −100,00 | 0,00 | 0,0000 | |||||
| GE / General Electric Company | 0,00 | −100,00 | 0,00 | 0,0000 | |||||
| BURL / Burlington Stores, Inc. | 0,00 | −100,00 | 0,00 | 0,0000 | |||||
| SCI / Service Corporation International | 0,00 | −100,00 | 0,00 | 0,0000 | |||||
| PPG / PPG Industries, Inc. | 0,00 | −100,00 | 0,00 | 0,0000 | |||||
| FITB / Fifth Third Bancorp | 0,00 | −100,00 | 0,00 | 0,0000 | |||||
| BKNG / Booking Holdings Inc. | 0,00 | −100,00 | 0,00 | −100,00 | −0,7740 | ||||
| TSLA / Tesla, Inc. | 0,00 | −100,00 | 0,00 | 0,0000 |