Grundläggande statistik
| Portföljvärde | $ 1 322 422 |
| Aktuella positioner | 52 |
Senaste innehav, resultat, förvaltat kapital (från 13F, 13D)
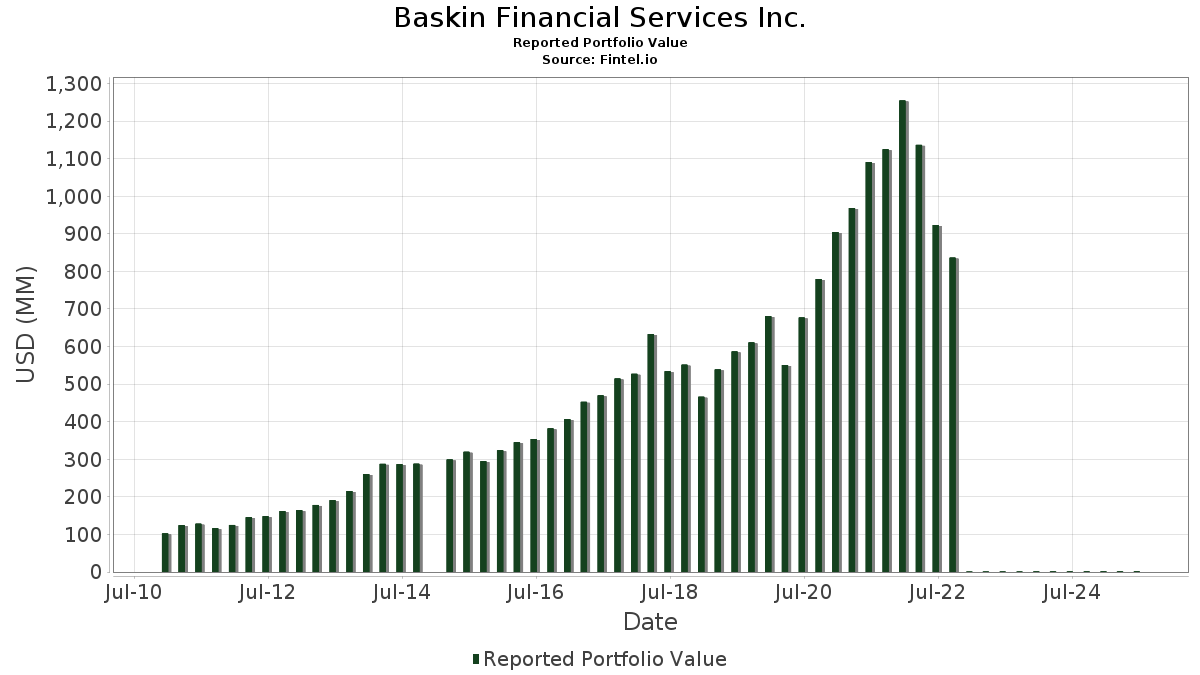
Baskin Financial Services Inc. har redovisat 52 totala innehav i sina senaste SEC-arkiveringar. Det senaste portföljvärdet beräknas vara $ 1 322 422 USD. Faktiskt förvaltade tillgångar (AUM) är detta värde plus likvida medel (som inte redovisas). Baskin Financial Services Inc.s största innehav är Microsoft Corporation (US:MSFT) , Netflix, Inc. (US:NFLX) , Apple Inc. (US:AAPL) , Costco Wholesale Corporation (US:COST) , and Alphabet Inc. (US:GOOGL) . Baskin Financial Services Inc.s nya positioner inkluderar Taiwan Semiconductor Manufacturing Company Limited - Depositary Receipt (Common Stock) (US:TSM) , Tesla, Inc. (US:TSLA) , Celestica Inc. (CA:CLS) , Emera Incorporated (DE:C61) , and .
Största ökningarna detta kvartal
Vi använder förändringen i portföljallokeringen eftersom det är det mest meningsfulla måttet. Förändringar kan bero på transaktioner eller förändringar i aktiekurser.
| Värdepapper | Aktier (MM) |
Värde (MM$) |
Portfölj % av | ΔPortfölj % av |
|---|---|---|---|---|
| 0,13 | 0,03 | 2,1864 | 2,1864 | |
| 0,05 | 0,07 | 5,3791 | 1,2373 | |
| 0,15 | 0,07 | 5,5134 | 1,0100 | |
| 0,04 | 0,03 | 2,1111 | 0,4032 | |
| 0,92 | 0,06 | 4,3023 | 0,3939 | |
| 0,24 | 0,05 | 4,0048 | 0,2773 | |
| 0,32 | 0,05 | 3,6642 | 0,2505 | |
| 0,42 | 0,04 | 2,8517 | 0,2499 | |
| 0,35 | 0,06 | 4,7615 | 0,2487 | |
| 0,11 | 0,05 | 4,0980 | 0,2459 |
Största minskningarna detta kvartal
Vi använder förändringen i portföljallokeringen eftersom det är det mest meningsfulla måttet. Förändringar kan bero på transaktioner eller förändringar i aktiepriser.
| Värdepapper | Aktier (MM) |
Värde (MM$) |
Portfölj % av | ΔPortfölj % av |
|---|---|---|---|---|
| 0,32 | 0,07 | 5,0262 | −0,9434 | |
| 0,77 | 0,04 | 2,8421 | −0,6378 | |
| 0,29 | 0,05 | 4,1138 | −0,5116 | |
| 0,09 | 0,04 | 3,1898 | −0,5013 | |
| 0,07 | 0,03 | 2,3157 | −0,4754 | |
| 0,17 | 0,06 | 4,6559 | −0,3297 | |
| 0,15 | 0,03 | 2,3857 | −0,2603 | |
| 0,08 | 0,04 | 2,7154 | −0,2438 | |
| 0,07 | 0,07 | 5,0008 | −0,1843 | |
| 0,07 | 0,04 | 3,2099 | −0,1582 |
13F- och fond arkiveringar
Denna blankett lämnades in den 2025-07-24 för rapporteringsperioden 2025-06-30. Klicka på länksymbolen för att se hela transaktionshistoriken.
Uppgradera för att låsa upp premiumdata och exportera till Excel![]() .
.
| Värdepapper | Typ | Genomsnittligt aktiepris | Aktier (MM) |
ΔAktier (%) |
ΔAktier (%) |
Värde ($MM) |
Portfölj (%) |
ΔPortfölj (%) |
|
|---|---|---|---|---|---|---|---|---|---|
| MSFT / Microsoft Corporation | 0,15 | −0,66 | 0,07 | 30,91 | 5,5134 | 1,0100 | |||
| NFLX / Netflix, Inc. | 0,05 | −2,76 | 0,07 | 42,00 | 5,3791 | 1,2373 | |||
| AAPL / Apple Inc. | 0,32 | −1,99 | 0,07 | −9,59 | 5,0262 | −0,9434 | |||
| COST / Costco Wholesale Corporation | 0,07 | −0,93 | 0,07 | 4,76 | 5,0008 | −0,1843 | |||
| GOOGL / Alphabet Inc. | 0,35 | −0,09 | 0,06 | 12,73 | 4,7615 | 0,2487 | |||
| V / Visa Inc. | 0,17 | −0,89 | 0,06 | 0,00 | 4,6559 | −0,3297 | |||
| BKFOF / Brookfield Corporation - Preferred Stock | 0,92 | 0,07 | 0,06 | 16,67 | 4,3023 | 0,3939 | |||
| WCN / Waste Connections, Inc. | 0,29 | −0,23 | 0,05 | −3,57 | 4,1138 | −0,5116 | |||
| RACE / Ferrari N.V. | 0,11 | −0,27 | 0,05 | 14,89 | 4,0980 | 0,2459 | |||
| DUT / Moody's Corporation | 0,11 | 0,17 | 0,05 | 8,16 | 4,0473 | 0,0140 | |||
| AMZN / Amazon.com, Inc. | 0,24 | 0,17 | 0,05 | 15,56 | 4,0048 | 0,2773 | |||
| LYV / Live Nation Entertainment, Inc. | 0,32 | −0,39 | 0,05 | 17,07 | 3,6642 | 0,2505 | |||
| SYK / Stryker Corporation | 0,11 | 0,60 | 0,04 | 7,32 | 3,3745 | −0,0187 | |||
| FSV / FirstService Corporation | 0,25 | 0,09 | 0,04 | 4,88 | 3,3259 | −0,0690 | |||
| MSCI / MSCI Inc. | 0,07 | 0,47 | 0,04 | 2,44 | 3,2099 | −0,1582 | |||
| BRK.B / Berkshire Hathaway Inc. | 0,09 | 1,87 | 0,04 | −6,67 | 3,1898 | −0,5013 | |||
| TFII N / TFI International Inc. | 0,42 | 1,64 | 0,04 | 15,63 | 2,8517 | 0,2499 | |||
| CPRT / Copart, Inc. | 0,77 | 1,27 | 0,04 | −11,90 | 2,8421 | −0,6378 | |||
| DPZ / Domino's Pizza, Inc. | 0,08 | 0,59 | 0,04 | −2,78 | 2,7154 | −0,2438 | |||
| TDG / TransDigm Group Incorporated | 0,02 | −0,36 | 0,03 | 9,68 | 2,5938 | 0,0479 | |||
| CNQ / Canadian Natural Resources Limited | 1,01 | 0,94 | 0,03 | 3,33 | 2,4109 | −0,1030 | |||
| GRMN / Garmin Ltd. | 0,15 | 0,84 | 0,03 | −3,12 | 2,3857 | −0,2603 | |||
| WSO.B / Watsco, Inc. | 0,07 | 2,67 | 0,03 | −11,76 | 2,3157 | −0,4754 | |||
| TSM / Taiwan Semiconductor Manufacturing Company Limited - Depositary Receipt (Common Stock) | 0,13 | 0,03 | 2,1864 | 2,1864 | |||||
| META / Meta Platforms, Inc. | 0,04 | 3,77 | 0,03 | 28,57 | 2,1111 | 0,4032 | |||
| VCSH / Vanguard Scottsdale Funds - Vanguard Short-Term Corporate Bond ETF | 0,31 | 0,45 | 0,02 | 0,00 | 1,8485 | −0,1161 | |||
| QSR / Restaurant Brands International Inc. | 0,35 | 1,29 | 0,02 | 0,00 | 1,7385 | −0,1159 | |||
| ADBE / Adobe Inc. | 0,06 | −2,57 | 0,02 | −4,55 | 1,6382 | −0,1540 | |||
| RW5 / Brookfield Asset Management Ltd. | 0,28 | −1,20 | 0,02 | 15,38 | 1,1620 | 0,0561 | |||
| BIP / Brookfield Infrastructure Partners L.P. - Limited Partnership | 0,33 | −3,49 | 0,01 | 0,00 | 0,8256 | 0,0089 | |||
| RY / Royal Bank of Canada | 0,06 | 3,33 | 0,01 | 14,29 | 0,6471 | 0,0716 | |||
| PBA / Pembina Pipeline Corporation | 0,19 | 2,69 | 0,01 | 0,00 | 0,5399 | −0,0623 | |||
| AMT / American Tower Corporation | 0,02 | −1,90 | 0,01 | 0,00 | 0,3993 | −0,0315 | |||
| GRP.U / Granite Real Estate Investment Trust | 0,08 | −12,24 | 0,00 | 0,00 | 0,3214 | −0,0398 | |||
| GOOGL / Alphabet Inc. | 0,01 | −2,64 | 0,00 | 100,00 | 0,1526 | 0,0047 | |||
| BIPC / Brookfield Infrastructure Corporation | 0,04 | 1,56 | 0,00 | 0,00 | 0,1106 | 0,0090 | |||
| TJX / The TJX Companies, Inc. | 0,01 | 0,00 | 0,00 | 0,00 | 0,1034 | −0,0063 | |||
| MA / Mastercard Incorporated | 0,00 | 0,00 | 0,00 | 0,0586 | −0,0029 | ||||
| GDXD / MicroSectors Gold Miners -3X Inverse Leveraged ETNs due June 29, 2040 | 0,01 | −7,49 | 0,00 | 0,0575 | −0,0001 | ||||
| QQQ / Invesco QQQ Trust, Series 1 | 0,00 | 0,00 | 0,00 | 0,0479 | 0,0040 | ||||
| JPM / JPMorgan Chase & Co. | 0,00 | 0,00 | 0,00 | 0,0333 | 0,0030 | ||||
| 0VL8 / The Toronto-Dominion Bank | 0,01 | −12,74 | 0,00 | 0,0300 | −0,0001 | ||||
| ENB / Enbridge Inc. | 0,01 | 0,00 | 0,00 | 0,0287 | −0,0015 | ||||
| FTS / Fortis Inc. | 0,01 | −0,48 | 0,00 | 0,0269 | −0,0009 | ||||
| NVDA / NVIDIA Corporation | 0,00 | −11,20 | 0,00 | 0,0257 | 0,0043 | ||||
| TSLA / Tesla, Inc. | 0,00 | 0,00 | 0,0194 | 0,0194 | |||||
| HEI / HEICO Corporation | 0,00 | 0,00 | 0,00 | 0,0186 | 0,0023 | ||||
| CLS / Celestica Inc. | 0,00 | 0,00 | 0,0177 | 0,0177 | |||||
| BND / Vanguard Bond Index Funds - Vanguard Total Bond Market ETF | 0,00 | 0,00 | 0,00 | 0,0177 | −0,0013 | ||||
| BSV / Vanguard Bond Index Funds - Vanguard Short-Term Bond ETF | 0,00 | 0,00 | 0,00 | 0,0175 | −0,0013 | ||||
| VCIT / Vanguard Scottsdale Funds - Vanguard Intermediate-Term Corporate Bond ETF | 0,00 | −32,26 | 0,00 | 0,0175 | −0,0099 | ||||
| C61 / Emera Incorporated | 0,00 | 0,00 | 0,0156 | 0,0156 | |||||
| CSGP / CoStar Group, Inc. | 0,00 | −100,00 | 0,00 | 0,0000 |