Grundläggande statistik
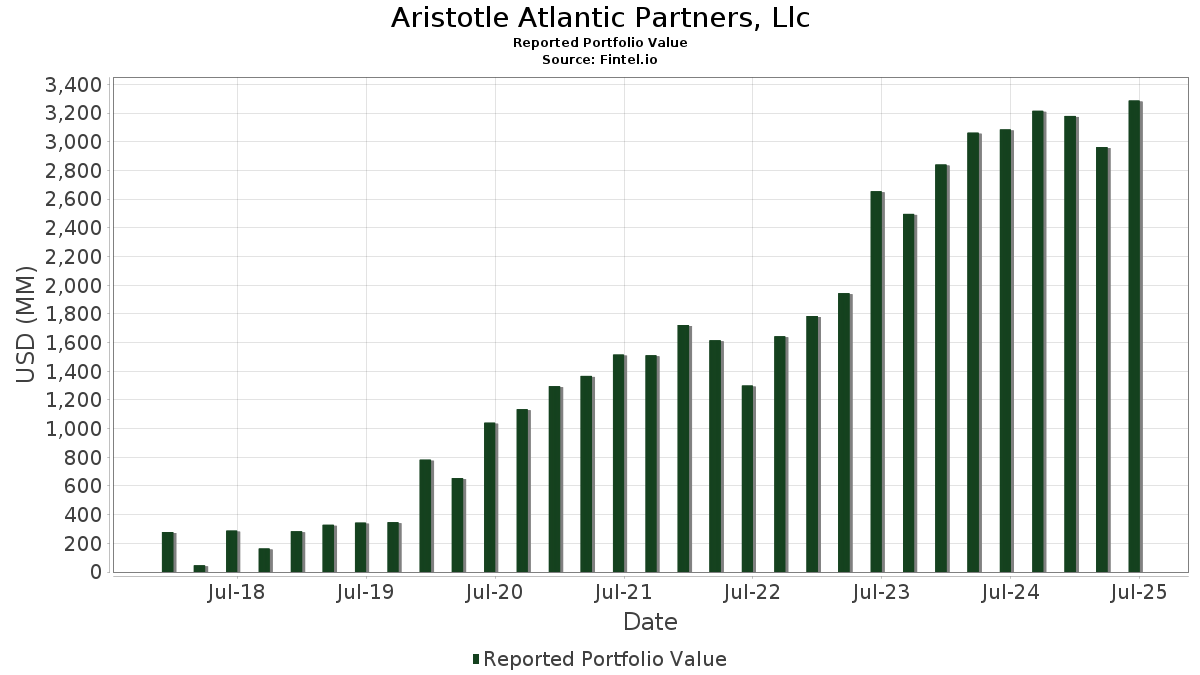
| Portföljvärde | $ 3 287 880 087 |
| Aktuella positioner | 85 |
Senaste innehav, resultat, förvaltat kapital (från 13F, 13D)
Aristotle Atlantic Partners, Llc har redovisat 85 totala innehav i sina senaste SEC-arkiveringar. Det senaste portföljvärdet beräknas vara $ 3 287 880 087 USD. Faktiskt förvaltade tillgångar (AUM) är detta värde plus likvida medel (som inte redovisas). Aristotle Atlantic Partners, Llcs största innehav är NVIDIA Corporation (US:NVDA) , Microsoft Corporation (US:MSFT) , Apple Inc. (US:AAPL) , Alphabet Inc. (US:GOOGL) , and Meta Platforms, Inc. (US:META) . Aristotle Atlantic Partners, Llcs nya positioner inkluderar HubSpot, Inc. (US:HUBS) , .
Största ökningarna detta kvartal
Vi använder förändringen i portföljallokeringen eftersom det är det mest meningsfulla måttet. Förändringar kan bero på transaktioner eller förändringar i aktiekurser.
| Värdepapper | Aktier (MM) |
Värde (MM$) |
Portfölj % av | ΔPortfölj % av |
|---|---|---|---|---|
| 0,02 | 11,54 | 0,3510 | 0,3510 | |
| 0,04 | 1,97 | 0,0343 | 0,0087 |
Största minskningarna detta kvartal
Vi använder förändringen i portföljallokeringen eftersom det är det mest meningsfulla måttet. Förändringar kan bero på transaktioner eller förändringar i aktiepriser.
| Värdepapper | Aktier (MM) |
Värde (MM$) |
Portfölj % av | ΔPortfölj % av |
|---|---|---|---|---|
| 0,95 | 195,20 | 3,4063 | −4,0740 | |
| 0,60 | 299,89 | 5,2330 | −3,0991 | |
| 2,24 | 353,91 | 6,1757 | −2,3798 | |
| 0,34 | 121,23 | 2,1154 | −2,0483 | |
| 0,84 | 148,49 | 2,5912 | −1,9512 | |
| 0,20 | 148,18 | 2,5857 | −1,4172 | |
| 0,45 | 99,57 | 1,7375 | −1,3965 | |
| 0,08 | 79,72 | 1,3912 | −1,2454 | |
| 0,17 | 63,15 | 1,1020 | −1,0085 | |
| 0,29 | 83,05 | 1,4492 | −0,9743 |
13F- och fond arkiveringar
Denna blankett lämnades in den 2025-08-14 för rapporteringsperioden 2025-06-30. Klicka på länksymbolen för att se hela transaktionshistoriken.
Uppgradera för att låsa upp premiumdata och exportera till Excel![]() .
.
| Värdepapper | Typ | Genomsnittligt aktiepris | Aktier (MM) |
ΔAktier (%) |
ΔAktier (%) |
Värde ($MM) |
Portfölj (%) |
ΔPortfölj (%) |
|
|---|---|---|---|---|---|---|---|---|---|
| NVDA / NVIDIA Corporation | 2,24 | −4,24 | 353,91 | 39,59 | 6,1757 | −2,3798 | |||
| MSFT / Microsoft Corporation | 0,60 | −8,34 | 299,89 | 21,45 | 5,2330 | −3,0991 | |||
| AAPL / Apple Inc. | 0,95 | −4,66 | 195,20 | −11,94 | 3,4063 | −4,0740 | |||
| GOOGL / Alphabet Inc. | 0,84 | −3,20 | 148,49 | 10,32 | 2,5912 | −1,9512 | |||
| META / Meta Platforms, Inc. | 0,20 | −2,46 | 148,18 | 24,92 | 2,5857 | −1,4172 | |||
| AVGO / Broadcom Inc. | 0,52 | 2,41 | 144,54 | 68,61 | 2,5222 | −0,3705 | |||
| V / Visa Inc. | 0,34 | −3,02 | 121,23 | −1,75 | 2,1154 | −2,0483 | |||
| AMZN / Amazon.com, Inc. | 0,45 | −7,03 | 99,57 | 7,21 | 1,7375 | −1,3965 | |||
| TT / Trane Technologies plc | 0,22 | −1,85 | 94,07 | 27,43 | 1,6415 | −0,8496 | |||
| NFLX / Netflix, Inc. | 0,07 | −2,53 | 91,36 | 39,98 | 1,5942 | −0,6083 | |||
| JPM / JPMorgan Chase & Co. | 0,29 | −2,16 | 83,05 | 15,64 | 1,4492 | −0,9743 | |||
| COST / Costco Wholesale Corporation | 0,08 | −2,52 | 79,72 | 2,04 | 1,3912 | −1,2454 | |||
| ORCL / Oracle Corporation | 0,32 | 1,88 | 70,54 | 59,32 | 1,2310 | −0,2632 | |||
| HD / The Home Depot, Inc. | 0,17 | 0,93 | 63,15 | 0,98 | 1,1020 | −1,0085 | |||
| TECH / Bio-Techne Corporation | 1,05 | 8,89 | 54,14 | −4,45 | 0,9447 | −0,9672 | |||
| SNPS / Synopsys, Inc. | 0,10 | −2,81 | 51,14 | 16,19 | 0,8923 | −0,5928 | |||
| LLY / Eli Lilly and Company | 0,06 | 44,67 | 48,71 | 36,54 | 0,8500 | −0,3538 | |||
| NSC / Norfolk Southern Corporation | 0,19 | −3,22 | 48,55 | 4,60 | 0,8471 | −0,7190 | |||
| GH / Guardant Health, Inc. | 0,93 | −3,38 | 48,50 | 18,03 | 0,8463 | −0,5402 | |||
| AME / AMETEK, Inc. | 0,24 | −2,82 | 44,27 | 2,16 | 0,7726 | −0,6899 | |||
| SPGI / S&P Global Inc. | 0,08 | −1,39 | 44,11 | 2,34 | 0,7698 | −0,6848 | |||
| DAR / Darling Ingredients Inc. | 1,16 | −3,36 | 44,08 | 17,37 | 0,7693 | −0,4982 | |||
| CRWD / CrowdStrike Holdings, Inc. | 0,08 | −2,70 | 40,45 | 40,56 | 0,7059 | −0,2653 | |||
| MRK / Merck & Co., Inc. | 0,50 | 0,00 | 39,31 | −11,81 | 0,6860 | −0,8182 | |||
| ADI / Analog Devices, Inc. | 0,16 | −3,52 | 38,99 | 13,86 | 0,6803 | −0,4751 | |||
| NOW / ServiceNow, Inc. | 0,04 | −30,42 | 37,95 | −10,15 | 0,6623 | −0,7631 | |||
| CB / Chubb Limited | 0,12 | 26,81 | 34,38 | 21,66 | 0,5999 | −0,3537 | |||
| ICE / Intercontinental Exchange, Inc. | 0,19 | −3,18 | 34,01 | 2,98 | 0,5934 | −0,5210 | |||
| ADPT / Adaptive Biotechnologies Corporation | 2,88 | −2,10 | 33,54 | 53,50 | 0,5853 | −0,1521 | |||
| TMO / Thermo Fisher Scientific Inc. | 0,08 | 15,45 | 30,97 | −5,93 | 0,5404 | −0,5704 | |||
| AMP / Ameriprise Financial, Inc. | 0,06 | −3,17 | 30,75 | 6,75 | 0,5365 | −0,4354 | |||
| ORLY / O'Reilly Automotive, Inc. | 0,34 | 1 324,34 | 30,20 | −10,39 | 0,9186 | −0,2187 | |||
| PLD / Prologis, Inc. | 0,27 | −2,34 | 28,86 | −8,17 | 0,5036 | −0,5569 | |||
| XOM / Exxon Mobil Corporation | 0,25 | 0,00 | 27,11 | −9,36 | 0,4731 | −0,5362 | |||
| KLAC / KLA Corporation | 0,03 | −3,74 | 24,79 | 26,84 | 0,4327 | −0,2270 | |||
| BSX / Boston Scientific Corporation | 0,23 | −3,22 | 24,38 | 3,04 | 0,4254 | −0,3730 | |||
| NEE / NextEra Energy, Inc. | 0,35 | 29,89 | 24,04 | 27,19 | 0,4195 | −0,2183 | |||
| BAC / Bank of America Corporation | 0,49 | −27,94 | 23,12 | −18,29 | 0,4035 | −0,5514 | |||
| MAR / Marriott International, Inc. | 0,08 | −13,53 | 22,89 | −0,82 | 0,3995 | −0,3794 | |||
| UNP / Union Pacific Corporation | 0,09 | −3,60 | 20,93 | −6,12 | 0,3652 | −0,3870 | |||
| VRTX / Vertex Pharmaceuticals Incorporated | 0,05 | −5,44 | 20,20 | −13,17 | 0,3525 | −0,4325 | |||
| PH / Parker-Hannifin Corporation | 0,03 | 0,00 | 19,56 | 14,91 | 0,3413 | −0,2331 | |||
| ROP / Roper Technologies, Inc. | 0,03 | −1,65 | 18,61 | −5,44 | 0,3247 | −0,3394 | |||
| AVY / Avery Dennison Corporation | 0,10 | −3,08 | 17,94 | −4,44 | 0,3131 | −0,3206 | |||
| GTLS / Chart Industries, Inc. | 0,11 | −5,34 | 17,43 | 7,96 | 0,3042 | −0,2407 | |||
| GM / General Motors Company | 0,34 | −3,11 | 16,87 | 1,39 | 0,2944 | −0,2671 | |||
| ADBE / Adobe Inc. | 0,04 | −6,82 | 16,61 | −6,00 | 0,2899 | −0,3065 | |||
| BDX / Becton, Dickinson and Company | 0,09 | −2,99 | 16,33 | −27,05 | 0,2850 | −0,4705 | |||
| LIN / Linde plc | 0,03 | 54,01 | 15,07 | 55,18 | 0,2629 | −0,0647 | |||
| AR / Antero Resources Corporation | 0,36 | 5,06 | 14,46 | 4,65 | 0,2523 | −0,2139 | |||
| CI / The Cigna Group | 0,04 | −3,23 | 14,04 | −2,77 | 0,2450 | −0,2423 | |||
| MUSA / Murphy USA Inc. | 0,03 | −6,79 | 13,97 | −19,29 | 0,2438 | −0,3403 | |||
| UNH / UnitedHealth Group Incorporated | 0,04 | 65,07 | 13,47 | −1,68 | 0,2351 | −0,2273 | |||
| AWK / American Water Works Company, Inc. | 0,10 | 36,71 | 13,38 | 28,92 | 0,2334 | −0,1167 | |||
| UBER / Uber Technologies, Inc. | 0,13 | −5,56 | 12,51 | 20,93 | 0,2184 | −0,1308 | |||
| APH / Amphenol Corporation | 0,12 | −1,63 | 12,15 | 48,10 | 0,2120 | −0,0648 | |||
| HUBS / HubSpot, Inc. | 0,02 | 11,54 | 0,3510 | 0,3510 | |||||
| HON / Honeywell International Inc. | 0,05 | −2,54 | 10,67 | 7,18 | 0,1862 | −0,1498 | |||
| GE / General Electric Company | 0,04 | −2,66 | 10,04 | 25,17 | 0,1752 | −0,0955 | |||
| HAL / Halliburton Company | 0,44 | −2,41 | 9,00 | −21,61 | 0,1571 | −0,2304 | |||
| AMT / American Tower Corporation | 0,04 | 0,00 | 8,84 | 1,56 | 0,1543 | −0,1394 | |||
| AMAT / Applied Materials, Inc. | 0,04 | −1,68 | 7,48 | 24,03 | 0,1305 | −0,0730 | |||
| ARE / Alexandria Real Estate Equities, Inc. | 0,10 | −4,80 | 6,93 | −25,27 | 0,1209 | −0,1920 | |||
| PCH / PotlatchDeltic Corporation | 0,15 | 0,00 | 5,82 | −14,95 | 0,1015 | −0,1294 | |||
| GOOG / Alphabet Inc. | 0,03 | −18,17 | 5,68 | −7,10 | 0,0991 | −0,1072 | |||
| MUR / Murphy Oil Corporation | 0,25 | 0,00 | 5,66 | −20,78 | 0,0987 | −0,1423 | |||
| COO / The Cooper Companies, Inc. | 0,06 | 0,00 | 4,55 | −15,64 | 0,0795 | −0,1027 | |||
| PWR / Quanta Services, Inc. | 0,01 | −18,12 | 4,06 | 21,80 | 0,0708 | −0,0416 | |||
| TEL / TE Connectivity plc | 0,02 | 0,00 | 3,37 | 19,36 | 0,0589 | −0,0365 | |||
| TTWO / Take-Two Interactive Software, Inc. | 0,01 | −17,62 | 3,15 | −3,46 | 0,0550 | −0,0551 | |||
| TSLA / Tesla, Inc. | 0,01 | −18,38 | 2,74 | 0,04 | 0,0832 | −0,0091 | |||
| ABT / Abbott Laboratories | 0,02 | 0,00 | 2,59 | 2,53 | 0,0452 | −0,0401 | |||
| OKLO / Oklo Inc. | 0,04 | 0,00 | 1,97 | 159,16 | 0,0343 | 0,0087 | |||
| PANW / Palo Alto Networks, Inc. | 0,01 | 0,00 | 1,35 | 19,89 | 0,0236 | −0,0144 | |||
| PG / The Procter & Gamble Company | 0,01 | 0,00 | 1,07 | −6,55 | 0,0187 | −0,0200 | |||
| IFF / International Flavors & Fragrances Inc. | 0,01 | −17,65 | 1,00 | −21,93 | 0,0174 | −0,0257 | |||
| KO / The Coca-Cola Company | 0,01 | 0,00 | 0,99 | −1,20 | 0,0173 | −0,0166 | |||
| WEC / WEC Energy Group, Inc. | 0,01 | 0,00 | 0,83 | −4,39 | 0,0144 | −0,0148 | |||
| IBM / International Business Machines Corporation | 0,00 | 0,00 | 0,71 | 18,62 | 0,0123 | −0,0078 | |||
| QCOM / QUALCOMM Incorporated | 0,00 | 0,00 | 0,48 | 3,70 | 0,0083 | −0,0072 | |||
| SPXC / SPX Technologies, Inc. | 0,00 | 0,00 | 0,48 | 30,41 | 0,0083 | −0,0040 | |||
| CRM / Salesforce, Inc. | 0,00 | 0,00 | 0,41 | 1,74 | 0,0071 | −0,0064 | |||
| IDXX / IDEXX Laboratories, Inc. | 0,00 | 0,00 | 0,32 | 27,89 | 0,0056 | −0,0029 | |||
| DOV / Dover Corporation | 0,00 | 0,00 | 0,26 | 4,49 | 0,0045 | −0,0038 | |||
| JNJ / Johnson & Johnson | 0,00 | 0,00 | 0,23 | −7,66 | 0,0040 | −0,0044 | |||
| ERII / Energy Recovery, Inc. | 0,00 | −100,00 | 0,00 | 0,0000 | |||||
| EXPE / Expedia Group, Inc. | 0,00 | −100,00 | 0,00 | 0,0000 | |||||
| ZTS / Zoetis Inc. | 0,00 | −100,00 | 0,00 | 0,0000 | |||||
| BMY / Bristol-Myers Squibb Company | 0,00 | −100,00 | 0,00 | 0,0000 | |||||
| DHR / Danaher Corporation | 0,00 | −100,00 | 0,00 | 0,0000 |