Grundläggande statistik
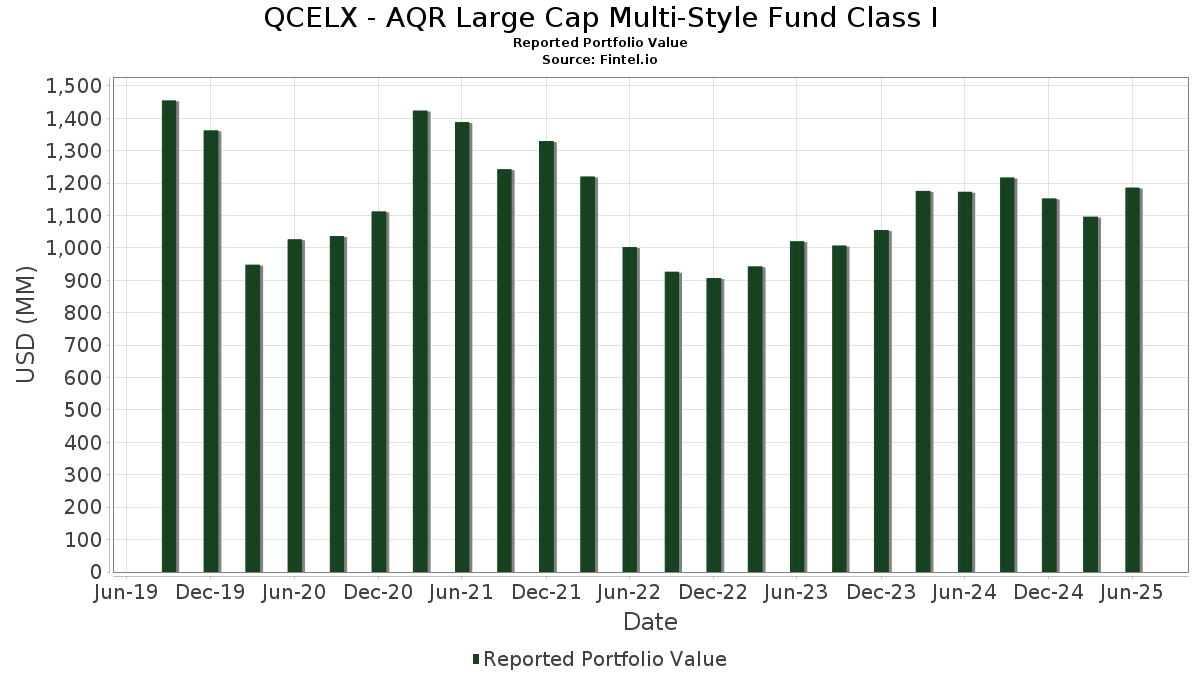
| Portföljvärde | $ 1 185 931 845 |
| Aktuella positioner | 187 |
Senaste innehav, resultat, förvaltat kapital (från 13F, 13D)
QCELX - AQR Large Cap Multi-Style Fund Class I har redovisat 187 totala innehav i sina senaste SEC-arkiveringar. Det senaste portföljvärdet beräknas vara $ 1 185 931 845 USD. Faktiskt förvaltade tillgångar (AUM) är detta värde plus likvida medel (som inte redovisas). QCELX - AQR Large Cap Multi-Style Fund Class Is största innehav är Microsoft Corporation (US:MSFT) , NVIDIA Corporation (US:NVDA) , Limited Purpose Cash Investment Fund (US:US90262Y7296) , Apple Inc. (US:AAPL) , and Meta Platforms, Inc. (US:META) . QCELX - AQR Large Cap Multi-Style Fund Class Is nya positioner inkluderar GRAIL, Inc. (US:GRAL) , National Fuel Gas Company (US:NFG) , Liberty Global Ltd. (US:LBTYA) , Twilio Inc. (US:TWLO) , and Alcoa Corporation (US:AA) .
Största ökningarna detta kvartal
Vi använder förändringen i portföljallokeringen eftersom det är det mest meningsfulla måttet. Förändringar kan bero på transaktioner eller förändringar i aktiekurser.
| Värdepapper | Aktier (MM) |
Värde (MM$) |
Portfölj % av | ΔPortfölj % av |
|---|---|---|---|---|
| 0,06 | 18,18 | 1,5282 | 0,9255 | |
| 0,15 | 76,38 | 6,4216 | 0,8998 | |
| 0,02 | 12,30 | 1,0341 | 0,8452 | |
| 0,08 | 23,36 | 1,9636 | 0,7776 | |
| 0,42 | 67,11 | 5,6420 | 0,6827 | |
| 0,12 | 6,31 | 0,5308 | 0,5308 | |
| 0,06 | 7,89 | 0,6637 | 0,5213 | |
| 0,00 | 6,30 | 0,5296 | 0,4660 | |
| 0,09 | 5,22 | 0,4386 | 0,4386 | |
| 0,15 | 7,97 | 0,6700 | 0,4299 |
Största minskningarna detta kvartal
Vi använder förändringen i portföljallokeringen eftersom det är det mest meningsfulla måttet. Förändringar kan bero på transaktioner eller förändringar i aktiepriser.
| Värdepapper | Aktier (MM) |
Värde (MM$) |
Portfölj % av | ΔPortfölj % av |
|---|---|---|---|---|
| 0,23 | 47,07 | 3,9574 | −1,9218 | |
| 0,00 | 0,32 | 0,0271 | −0,8079 | |
| 0,04 | 1,86 | 0,1564 | −0,7202 | |
| 0,08 | 5,68 | 0,4776 | −0,7069 | |
| 0,02 | 4,44 | 0,3734 | −0,5069 | |
| 0,23 | 13,21 | 1,1105 | −0,4584 | |
| 0,03 | 3,29 | 0,2769 | −0,4479 | |
| 0,00 | 0,00 | −0,3831 | ||
| 0,01 | 1,74 | 0,1462 | −0,3598 | |
| 0,02 | 3,15 | 0,2650 | −0,3545 |
13F- och fond arkiveringar
Denna blankett lämnades in den 2025-08-20 för rapporteringsperioden 2025-06-30. Klicka på länksymbolen för att se hela transaktionshistoriken.
Uppgradera för att låsa upp premiumdata och exportera till Excel![]() .
.
| Värdepapper | Typ | Genomsnittligt aktiepris | Aktier (MM) |
ΔAktier (%) |
ΔAktier (%) |
Värde ($MM) |
Portfölj (%) |
ΔPortfölj (%) |
|
|---|---|---|---|---|---|---|---|---|---|
| MSFT / Microsoft Corporation | 0,15 | −4,96 | 76,38 | 25,93 | 6,4216 | 0,8998 | |||
| NVDA / NVIDIA Corporation | 0,42 | −15,49 | 67,11 | 23,19 | 5,6420 | 0,6827 | |||
| US90262Y7296 / Limited Purpose Cash Investment Fund | 52,21 | 1,18 | 52,19 | 1,18 | 4,3880 | −0,3082 | |||
| AAPL / Apple Inc. | 0,23 | −21,09 | 47,07 | −27,11 | 3,9574 | −1,9218 | |||
| META / Meta Platforms, Inc. | 0,04 | −10,36 | 28,58 | 14,80 | 2,4029 | 0,1363 | |||
| AMZN / Amazon.com, Inc. | 0,12 | −5,35 | 26,28 | 9,14 | 2,2089 | 0,0174 | |||
| AVGO / Broadcom Inc. | 0,08 | 8,89 | 23,36 | 79,28 | 1,9636 | 0,7776 | |||
| BRK.B / Berkshire Hathaway Inc. | 0,04 | 0,00 | 18,41 | −8,79 | 1,5481 | −0,2898 | |||
| TSLA / Tesla, Inc. | 0,06 | 123,99 | 18,18 | 174,55 | 1,5282 | 0,9255 | |||
| T / AT&T Inc. | 0,59 | −10,44 | 17,14 | −8,35 | 1,4407 | −0,2616 | |||
| GOOG / Alphabet Inc. | 0,10 | −7,13 | 16,89 | 5,46 | 1,4203 | −0,0381 | |||
| GE / General Electric Company | 0,06 | −10,84 | 15,04 | 14,66 | 1,2642 | 0,0703 | |||
| RTX / RTX Corporation | 0,10 | 0,00 | 14,78 | 10,23 | 1,2427 | 0,0220 | |||
| SYF / Synchrony Financial | 0,21 | 0,00 | 14,20 | 26,07 | 1,1941 | 0,1684 | |||
| C / Citigroup Inc. | 0,17 | 29,85 | 14,18 | 55,70 | 1,1920 | 0,3630 | |||
| GOOGL / Alphabet Inc. | 0,08 | −20,78 | 13,99 | −9,72 | 1,1764 | −0,2347 | |||
| AXS / AXIS Capital Holdings Limited | 0,13 | −0,52 | 13,56 | 3,03 | 1,1397 | −0,0581 | |||
| SPOT / Spotify Technology S.A. | 0,02 | −25,03 | 13,55 | 4,59 | 1,1390 | −0,0402 | |||
| ALL / The Allstate Corporation | 0,07 | −10,25 | 13,49 | −12,74 | 1,1345 | −0,2734 | |||
| MO / Altria Group, Inc. | 0,23 | −21,54 | 13,21 | −23,35 | 1,1105 | −0,4584 | |||
| JBL / Jabil Inc. | 0,06 | 0,00 | 13,21 | 60,29 | 1,1104 | 0,3603 | |||
| ZM / Zoom Communications Inc. | 0,17 | −12,90 | 13,15 | −7,92 | 1,1058 | −0,1947 | |||
| AYI / Acuity Inc. | 0,04 | 0,00 | 12,42 | 13,30 | 1,0445 | 0,0461 | |||
| UNM / Unum Group | 0,15 | −11,19 | 12,38 | −11,95 | 1,0410 | −0,2392 | |||
| GEV / GE Vernova Inc. | 0,02 | 242,00 | 12,30 | 493,06 | 1,0341 | 0,8452 | |||
| PLTR / Palantir Technologies Inc. | 0,08 | 9,93 | 11,01 | 77,55 | 0,9256 | 0,3611 | |||
| UTHR / United Therapeutics Corporation | 0,04 | −7,85 | 10,73 | −14,10 | 0,9017 | −0,2350 | |||
| PPC / Pilgrim's Pride Corporation | 0,23 | −1,12 | 10,48 | −18,41 | 0,8811 | −0,2882 | |||
| EME / EMCOR Group, Inc. | 0,02 | −19,03 | 10,28 | 17,17 | 0,8646 | 0,0656 | |||
| EG / Everest Group, Ltd. | 0,03 | 0,00 | 10,24 | −6,46 | 0,8607 | −0,1357 | |||
| UI / Ubiquiti Inc. | 0,02 | 31,69 | 10,23 | 74,82 | 0,8602 | 0,3273 | |||
| VZ / Verizon Communications Inc. | 0,24 | 0,00 | 10,21 | −4,61 | 0,8582 | −0,1160 | |||
| TXT / Textron Inc. | 0,12 | 34,25 | 9,66 | 49,17 | 0,8121 | 0,2227 | |||
| NRG / NRG Energy, Inc. | 0,06 | −25,60 | 9,64 | 25,16 | 0,8102 | 0,1092 | |||
| ALSN / Allison Transmission Holdings, Inc. | 0,10 | −16,96 | 9,44 | −17,55 | 0,7940 | −0,2487 | |||
| AN / AutoNation, Inc. | 0,05 | 0,00 | 9,21 | 22,69 | 0,7743 | 0,0909 | |||
| BK / The Bank of New York Mellon Corporation | 0,10 | −27,64 | 9,16 | −21,39 | 0,7697 | −0,2905 | |||
| BKNG / Booking Holdings Inc. | 0,00 | 16,86 | 8,95 | 46,87 | 0,7524 | 0,1976 | |||
| PAG / Penske Automotive Group, Inc. | 0,05 | 0,00 | 8,82 | 19,33 | 0,7418 | 0,0687 | |||
| LMT / Lockheed Martin Corporation | 0,02 | −24,70 | 8,21 | −21,93 | 0,6905 | −0,2672 | |||
| BPOP / Popular, Inc. | 0,07 | 12,86 | 8,02 | 34,68 | 0,6746 | 0,1321 | |||
| CNXC / Concentrix Corporation | 0,15 | 218,04 | 7,97 | 202,20 | 0,6700 | 0,4299 | |||
| MU / Micron Technology, Inc. | 0,06 | 282,79 | 7,89 | 354,99 | 0,6637 | 0,5213 | |||
| HIG / The Hartford Insurance Group, Inc. | 0,06 | 0,00 | 7,77 | 2,53 | 0,6535 | −0,0366 | |||
| ELV / Elevance Health, Inc. | 0,02 | −15,75 | 7,61 | −24,67 | 0,6402 | −0,2800 | |||
| WU / The Western Union Company | 0,90 | 70,44 | 7,56 | 35,65 | 0,6360 | 0,1283 | |||
| MTG / MGIC Investment Corporation | 0,27 | 0,00 | 7,56 | 12,35 | 0,6358 | 0,0230 | |||
| EXPE / Expedia Group, Inc. | 0,04 | 101,84 | 7,51 | 102,56 | 0,6317 | 0,2940 | |||
| HWM / Howmet Aerospace Inc. | 0,04 | 0,00 | 7,46 | 43,47 | 0,6271 | 0,1538 | |||
| APP / AppLovin Corporation | 0,02 | 5,42 | 7,38 | 39,27 | 0,6205 | 0,1381 | |||
| R / Ryder System, Inc. | 0,04 | 0,00 | 7,12 | 10,57 | 0,5983 | 0,0123 | |||
| VIRT / Virtu Financial, Inc. | 0,15 | 0,00 | 6,94 | 17,49 | 0,5833 | 0,0457 | |||
| COF / Capital One Financial Corporation | 0,03 | 0,00 | 6,92 | 18,67 | 0,5820 | 0,0509 | |||
| CI / The Cigna Group | 0,02 | 0,00 | 6,91 | 0,48 | 0,5807 | −0,0451 | |||
| MCK / McKesson Corporation | 0,01 | 0,00 | 6,85 | 8,89 | 0,5758 | 0,0032 | |||
| CFG / Citizens Financial Group, Inc. | 0,15 | 54,47 | 6,69 | 68,74 | 0,5622 | 0,2014 | |||
| HRB / H&R Block, Inc. | 0,12 | −26,09 | 6,49 | −26,12 | 0,5455 | −0,2540 | |||
| STT / State Street Corporation | 0,06 | 0,00 | 6,46 | 18,76 | 0,5433 | 0,0480 | |||
| DXC / DXC Technology Company | 0,42 | 114,94 | 6,38 | 92,78 | 0,5363 | 0,2350 | |||
| ZION / Zions Bancorporation, National Association | 0,12 | 6,31 | 0,5308 | 0,5308 | |||||
| NFLX / Netflix, Inc. | 0,00 | 528,04 | 6,30 | 802,44 | 0,5296 | 0,4660 | |||
| CW / Curtiss-Wright Corporation | 0,01 | 0,00 | 6,21 | 53,98 | 0,5222 | 0,1550 | |||
| FFIV / F5, Inc. | 0,02 | 0,00 | 6,00 | 10,54 | 0,5042 | 0,0103 | |||
| EXEL / Exelixis, Inc. | 0,13 | 78,51 | 5,91 | 113,17 | 0,4968 | 0,2444 | |||
| KR / The Kroger Co. | 0,08 | −58,80 | 5,68 | −56,34 | 0,4776 | −0,7069 | |||
| ORI / Old Republic International Corporation | 0,15 | 0,00 | 5,58 | −1,99 | 0,4689 | −0,0491 | |||
| ANET / Arista Networks Inc | 0,05 | −22,16 | 5,53 | 2,79 | 0,4647 | −0,0249 | |||
| DBX / Dropbox, Inc. | 0,19 | 0,00 | 5,30 | 7,09 | 0,4459 | −0,0050 | |||
| GM / General Motors Company | 0,11 | −2,01 | 5,30 | 2,53 | 0,4457 | −0,0250 | |||
| CNA / CNA Financial Corporation | 0,11 | 0,00 | 5,27 | −8,40 | 0,4431 | −0,0806 | |||
| HPQ / HP Inc. | 0,21 | −4,53 | 5,25 | −15,68 | 0,4413 | −0,1253 | |||
| NEM / Newmont Corporation | 0,09 | 5,22 | 0,4386 | 0,4386 | |||||
| PM / Philip Morris International Inc. | 0,03 | 247,08 | 4,98 | 298,40 | 0,4190 | 0,3051 | |||
| SNA / Snap-on Incorporated | 0,02 | 0,00 | 4,98 | −7,66 | 0,4187 | −0,0723 | |||
| ACI / Albertsons Companies, Inc. | 0,23 | −0,13 | 4,94 | −2,31 | 0,4154 | −0,0450 | |||
| PEGA / Pegasystems Inc. | 0,09 | 244,58 | 4,93 | 168,34 | 0,4147 | 0,2473 | |||
| ARW / Arrow Electronics, Inc. | 0,04 | −25,50 | 4,90 | −8,58 | 0,4121 | −0,0760 | |||
| MUSA / Murphy USA Inc. | 0,01 | −1,13 | 4,86 | −14,38 | 0,4084 | −0,1081 | |||
| GRAL / GRAIL, Inc. | 0,09 | 4,64 | 0,3904 | 0,3904 | |||||
| US21871X1090 / Corebridge Financial, Inc. | 0,13 | −48,29 | 4,60 | −41,85 | 0,3871 | −0,3337 | |||
| HPE / Hewlett Packard Enterprise Company | 0,22 | −2,07 | 4,58 | 29,80 | 0,3852 | 0,0638 | |||
| OZK / Bank OZK | 0,10 | 135,18 | 4,57 | 154,74 | 0,3838 | 0,2206 | |||
| OHI / Omega Healthcare Investors, Inc. | 0,12 | 0,00 | 4,53 | −3,76 | 0,3806 | −0,0476 | |||
| AIZ / Assurant, Inc. | 0,02 | −51,22 | 4,44 | −54,07 | 0,3734 | −0,5069 | |||
| JPM / JPMorgan Chase & Co. | 0,01 | 0,00 | 4,26 | 18,20 | 0,3583 | 0,0300 | |||
| RNR / RenaissanceRe Holdings Ltd. | 0,02 | −27,15 | 4,24 | −26,27 | 0,3564 | −0,1670 | |||
| KD / Kyndryl Holdings, Inc. | 0,10 | 395,29 | 4,20 | 562,62 | 0,3532 | 0,2954 | |||
| QCOM / QUALCOMM Incorporated | 0,03 | 35,22 | 4,10 | 40,18 | 0,3450 | 0,0785 | |||
| ADT / ADT Inc. | 0,47 | 85,92 | 4,01 | 93,44 | 0,3372 | 0,1484 | |||
| SNX / TD SYNNEX Corporation | 0,03 | 0,00 | 3,98 | 30,55 | 0,3349 | 0,0571 | |||
| G / Genpact Limited | 0,09 | 85,15 | 3,94 | 61,78 | 0,3313 | 0,1095 | |||
| HII / Huntington Ingalls Industries, Inc. | 0,02 | 0,00 | 3,89 | 18,37 | 0,3272 | 0,0278 | |||
| AMKR / Amkor Technology, Inc. | 0,18 | 101,00 | 3,80 | 133,68 | 0,3191 | 0,1712 | |||
| CSCO / Cisco Systems, Inc. | 0,05 | 0,00 | 3,76 | 12,43 | 0,3164 | 0,0117 | |||
| RNG / RingCentral, Inc. | 0,13 | 108,83 | 3,69 | 139,17 | 0,3101 | 0,1697 | |||
| GAP / The Gap, Inc. | 0,17 | −33,29 | 3,69 | −29,41 | 0,3099 | −0,1654 | |||
| AVT / Avnet, Inc. | 0,07 | 103,00 | 3,68 | 124,12 | 0,3095 | 0,1599 | |||
| JHG / Janus Henderson Group plc | 0,09 | −29,16 | 3,64 | −23,89 | 0,3057 | −0,1292 | |||
| UGI / UGI Corporation | 0,09 | 80,64 | 3,41 | 99,01 | 0,2870 | 0,1308 | |||
| LDOS / Leidos Holdings, Inc. | 0,02 | 0,00 | 3,39 | 16,93 | 0,2852 | 0,0210 | |||
| TAP / Molson Coors Beverage Company | 0,07 | 59,95 | 3,39 | 26,37 | 0,2849 | 0,0408 | |||
| GTES / Gates Industrial Corporation plc | 0,15 | −2,88 | 3,34 | 21,48 | 0,2810 | 0,0305 | |||
| AMAT / Applied Materials, Inc. | 0,02 | 0,00 | 3,33 | 26,18 | 0,2800 | 0,0397 | |||
| WMT / Walmart Inc. | 0,03 | −62,86 | 3,29 | −58,64 | 0,2769 | −0,4479 | |||
| OSK / Oshkosh Corporation | 0,03 | 0,00 | 3,28 | 20,67 | 0,2759 | 0,0284 | |||
| LOPE / Grand Canyon Education, Inc. | 0,02 | 69,06 | 3,27 | 84,66 | 0,2753 | 0,1139 | |||
| WSM / Williams-Sonoma, Inc. | 0,02 | −55,17 | 3,15 | −53,68 | 0,2650 | −0,3545 | |||
| NFG / National Fuel Gas Company | 0,03 | 2,93 | 0,2466 | 0,2466 | |||||
| ARMK / Aramark | 0,07 | 0,00 | 2,90 | 21,28 | 0,2434 | 0,0261 | |||
| RGA / Reinsurance Group of America, Incorporated | 0,01 | 0,00 | 2,75 | 0,77 | 0,2310 | −0,0173 | |||
| OC / Owens Corning | 0,02 | 0,00 | 2,70 | −3,71 | 0,2270 | −0,0283 | |||
| THC / Tenet Healthcare Corporation | 0,01 | −32,01 | 2,59 | −11,03 | 0,2176 | −0,0472 | |||
| SWKS / Skyworks Solutions, Inc. | 0,03 | 67,52 | 2,58 | 26,40 | 0,2166 | 0,0494 | |||
| BAH / Booz Allen Hamilton Holding Corporation | 0,02 | 0,00 | 2,56 | −0,43 | 0,2153 | −0,0188 | |||
| MMM / 3M Company | 0,02 | 3,90 | 2,52 | 7,70 | 0,2117 | −0,0011 | |||
| LBTYA / Liberty Global Ltd. | 0,25 | 2,47 | 0,2079 | 0,2079 | |||||
| MTZ / MasTec, Inc. | 0,01 | −36,08 | 2,41 | −6,66 | 0,2026 | −0,0324 | |||
| MDU / MDU Resources Group, Inc. | 0,14 | 0,00 | 2,32 | −1,40 | 0,1947 | −0,0192 | |||
| WFC / Wells Fargo & Company | 0,03 | 0,00 | 2,29 | 11,58 | 0,1929 | 0,0057 | |||
| BLDR / Builders FirstSource, Inc. | 0,02 | −18,44 | 2,24 | −23,82 | 0,1885 | −0,0795 | |||
| CMCSA / Comcast Corporation | 0,06 | −62,07 | 2,22 | −63,93 | 0,1866 | −0,3462 | |||
| DOCU / DocuSign, Inc. | 0,03 | 0,00 | 2,16 | −4,31 | 0,1813 | −0,0239 | |||
| TWLO / Twilio Inc. | 0,02 | 2,05 | 0,1720 | 0,1720 | |||||
| ADBE / Adobe Inc. | 0,01 | 0,00 | 2,02 | 0,85 | 0,1699 | −0,0125 | |||
| MAN / ManpowerGroup Inc. | 0,05 | −24,60 | 1,96 | −58,59 | 0,1645 | −0,2229 | |||
| BBY / Best Buy Co., Inc. | 0,03 | −35,93 | 1,95 | −41,56 | 0,1640 | −0,1399 | |||
| NTRS / Northern Trust Corporation | 0,01 | 0,00 | 1,90 | 28,55 | 0,1598 | 0,0252 | |||
| EXC / Exelon Corporation | 0,04 | −79,50 | 1,86 | −80,68 | 0,1564 | −0,7202 | |||
| MTB / M&T Bank Corporation | 0,01 | 0,00 | 1,82 | 8,53 | 0,1529 | 0,0003 | |||
| AA / Alcoa Corporation | 0,06 | 1,82 | 0,1528 | 0,1528 | |||||
| TDC / Teradata Corporation | 0,08 | 305,87 | 1,78 | 303,41 | 0,1493 | 0,1091 | |||
| CRUS / Cirrus Logic, Inc. | 0,02 | 17,78 | 1,76 | 23,20 | 0,1478 | 0,0179 | |||
| ATI / ATI Inc. | 0,02 | 1,76 | 0,1476 | 0,1476 | |||||
| CMI / Cummins Inc. | 0,01 | −70,05 | 1,74 | −68,71 | 0,1462 | −0,3598 | |||
| IVZ / Invesco Ltd. | 0,11 | 1,74 | 0,1460 | 0,1460 | |||||
| ST / Sensata Technologies Holding plc | 0,06 | 1,70 | 0,1429 | 0,1429 | |||||
| S&P 500 E-Mini Index / DE (N/A) | 1,69 | 0,1423 | 0,1423 | ||||||
| USB / U.S. Bancorp | 0,03 | 1,55 | 0,1304 | 0,1304 | |||||
| DUOL / Duolingo, Inc. | 0,00 | 1,39 | 0,1170 | 0,1170 | |||||
| FNB / F.N.B. Corporation | 0,09 | 288,18 | 1,35 | 321,88 | 0,1135 | 0,0843 | |||
| GILD / Gilead Sciences, Inc. | 0,01 | −29,24 | 1,35 | 7,06 | 0,1135 | 0,0066 | |||
| SOLV / Solventum Corporation | 0,02 | −35,64 | 1,34 | −35,85 | 0,1123 | −0,0771 | |||
| GDDY / GoDaddy Inc. | 0,01 | −58,53 | 1,30 | −58,57 | 0,1090 | −0,1757 | |||
| CVS / CVS Health Corporation | 0,02 | −69,55 | 1,23 | −66,59 | 0,1033 | −0,1984 | |||
| LNC / Lincoln National Corporation | 0,03 | 119,41 | 1,19 | 73,03 | 0,0998 | 0,0262 | |||
| BILL / BILL Holdings, Inc. | 0,03 | 1,19 | 0,0997 | 0,0997 | |||||
| GPN / Global Payments Inc. | 0,01 | 0,00 | 1,17 | −18,29 | 0,0981 | −0,0319 | |||
| RBLX / Roblox Corporation | 0,01 | 1,16 | 0,0977 | 0,0977 | |||||
| BOKF / BOK Financial Corporation | 0,01 | 83,91 | 1,15 | 91,04 | 0,0969 | 0,0474 | |||
| PLTK / Playtika Holding Corp. | 0,24 | 3,19 | 1,15 | −5,61 | 0,0963 | −0,0142 | |||
| WWD / Woodward, Inc. | 0,00 | 0,00 | 1,04 | 34,37 | 0,0874 | 0,0169 | |||
| JAZZ / Jazz Pharmaceuticals plc | 0,01 | 26,64 | 0,99 | 8,32 | 0,0832 | −0,0000 | |||
| UHS / Universal Health Services, Inc. | 0,01 | 0,00 | 0,96 | −3,63 | 0,0805 | −0,0099 | |||
| AGO / Assured Guaranty Ltd. | 0,01 | −52,66 | 0,96 | −53,23 | 0,0804 | −0,1055 | |||
| PNC / The PNC Financial Services Group, Inc. | 0,01 | 0,00 | 0,95 | 6,02 | 0,0800 | −0,0017 | |||
| TSN / Tyson Foods, Inc. | 0,02 | −39,52 | 0,95 | −46,97 | 0,0795 | −0,0829 | |||
| FTNT / Fortinet, Inc. | 0,01 | 0,00 | 0,84 | 9,86 | 0,0703 | 0,0010 | |||
| VRSN / VeriSign, Inc. | 0,00 | 0,80 | 0,0676 | 0,0676 | |||||
| TNL / Travel + Leisure Co. | 0,02 | 159,38 | 0,79 | 190,11 | 0,0666 | 0,0417 | |||
| RF / Regions Financial Corporation | 0,03 | 0,79 | 0,0661 | 0,0661 | |||||
| QRVO / Qorvo, Inc. | 0,01 | 0,78 | 0,0658 | 0,0658 | |||||
| MET / MetLife, Inc. | 0,01 | 0,00 | 0,78 | 0,13 | 0,0652 | −0,0053 | |||
| TT / Trane Technologies plc | 0,00 | 0,00 | 0,77 | 29,75 | 0,0650 | 0,0108 | |||
| PCAR / PACCAR Inc | 0,01 | 0,00 | 0,75 | −2,36 | 0,0627 | −0,0068 | |||
| CTSH / Cognizant Technology Solutions Corporation | 0,01 | 0,00 | 0,74 | 2,07 | 0,0621 | −0,0038 | |||
| EQH / Equitable Holdings, Inc. | 0,01 | 52,42 | 0,73 | 109,54 | 0,0610 | 0,0315 | |||
| PYPL / PayPal Holdings, Inc. | 0,01 | −46,86 | 0,70 | −31,94 | 0,0588 | −0,0286 | |||
| TRV / The Travelers Companies, Inc. | 0,00 | 0,00 | 0,67 | 1,20 | 0,0566 | −0,0040 | |||
| ABBV / AbbVie Inc. | 0,00 | 0,00 | 0,66 | −11,47 | 0,0559 | −0,0124 | |||
| VMI / Valmont Industries, Inc. | 0,00 | 0,66 | 0,0557 | 0,0557 | |||||
| TEAM / Atlassian Corporation | 0,00 | 0,64 | 0,0535 | 0,0535 | |||||
| M / Macy's, Inc. | 0,05 | −72,08 | 0,63 | −79,28 | 0,0532 | −0,1970 | |||
| LHX / L3Harris Technologies, Inc. | 0,00 | 0,00 | 0,63 | 19,92 | 0,0526 | 0,0051 | |||
| ESAB / ESAB Corporation | 0,00 | −24,46 | 0,60 | −21,78 | 0,0501 | −0,0193 | |||
| ECG / Everus Construction Group, Inc. | 0,01 | −75,17 | 0,54 | −57,47 | 0,0458 | −0,0708 | |||
| CRH / CRH plc | 0,01 | −54,36 | 0,52 | −52,39 | 0,0437 | −0,0556 | |||
| INTU / Intuit Inc. | 0,00 | 0,00 | 0,47 | 28,26 | 0,0397 | 0,0062 | |||
| THG / The Hanover Insurance Group, Inc. | 0,00 | 0,00 | 0,47 | −2,29 | 0,0395 | −0,0043 | |||
| SF / Stifel Financial Corp. | 0,00 | 0,00 | 0,43 | 10,26 | 0,0362 | 0,0006 | |||
| FHB / First Hawaiian, Inc. | 0,02 | 41,80 | 0,42 | 26,95 | 0,0356 | 0,0082 | |||
| WCC / WESCO International, Inc. | 0,00 | −70,23 | 0,39 | −69,55 | 0,0329 | −0,0783 | |||
| IBM / International Business Machines Corporation | 0,00 | 0,00 | 0,38 | 18,52 | 0,0323 | 0,0028 | |||
| ACGL / Arch Capital Group Ltd. | 0,00 | 0,00 | 0,35 | −5,46 | 0,0292 | −0,0042 | |||
| NOC / Northrop Grumman Corporation | 0,00 | −62,42 | 0,33 | −63,33 | 0,0280 | −0,0547 | |||
| UAL / United Airlines Holdings, Inc. | 0,00 | −96,95 | 0,32 | −96,49 | 0,0271 | −0,8079 | |||
| BHF / Brighthouse Financial, Inc. | 0,01 | 69,06 | 0,30 | 92,95 | 0,0253 | 0,0100 | |||
| UHAL / U-Haul Holding Company | 0,00 | 0,00 | 0,10 | −7,77 | 0,0081 | −0,0014 | |||
| BJ / BJ's Wholesale Club Holdings, Inc. | 0,00 | −100,00 | 0,00 | −100,00 | −0,1086 | ||||
| ALK / Alaska Air Group, Inc. | 0,00 | −100,00 | 0,00 | −100,00 | −0,1547 | ||||
| MSI / Motorola Solutions, Inc. | 0,00 | −100,00 | 0,00 | −100,00 | −0,3831 | ||||
| CBOE / Cboe Global Markets, Inc. | 0,00 | −100,00 | 0,00 | −100,00 | −0,0672 |