Grundläggande statistik
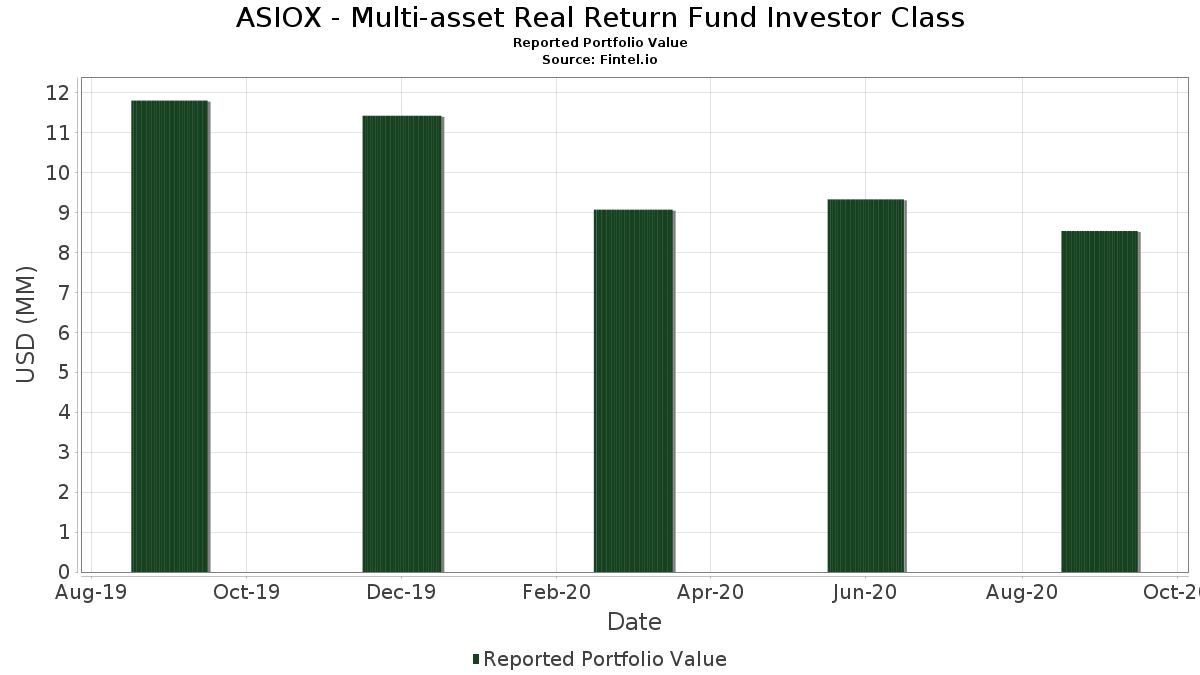
| Portföljvärde | $ 8 533 677 |
| Aktuella positioner | 157 |
Senaste innehav, resultat, förvaltat kapital (från 13F, 13D)
ASIOX - Multi-asset Real Return Fund Investor Class har redovisat 157 totala innehav i sina senaste SEC-arkiveringar. Det senaste portföljvärdet beräknas vara $ 8 533 677 USD. Faktiskt förvaltade tillgångar (AUM) är detta värde plus likvida medel (som inte redovisas). ASIOX - Multi-asset Real Return Fund Investor Classs största innehav är United States Treasury Inflation Indexed Bonds (US:US912828ZJ22) , United States Treasury Inflation Indexed Bonds (US:US912828X398) , State Street Institutional Investment Trust - State Street Institutional US Govt Money Market Fnd Premier Cls (US:GVMXX) , United States Treasury Inflation Indexed Bonds (US:US912828Z377) , and United States Treasury Inflation Indexed Bonds (US:US9128287D64) . ASIOX - Multi-asset Real Return Fund Investor Classs nya positioner inkluderar United States Treasury Inflation Indexed Bonds (US:US912828ZJ22) , United States Treasury Inflation Indexed Bonds (US:US912828X398) , United States Treasury Inflation Indexed Bonds (US:US912828Z377) , United States Treasury Inflation Indexed Bonds (US:US9128287D64) , and United States Treasury Inflation Indexed Bonds (US:US912828V491) .
Största ökningarna detta kvartal
Vi använder förändringen i portföljallokeringen eftersom det är det mest meningsfulla måttet. Förändringar kan bero på transaktioner eller förändringar i aktiekurser.
| Värdepapper | Aktier (MM) |
Värde (MM$) |
Portfölj % av | ΔPortfölj % av |
|---|---|---|---|---|
| 1,60 | 18,5817 | 18,5817 | ||
| 0,87 | 10,0628 | 10,0628 | ||
| 0,87 | 0,87 | 10,0431 | 10,0428 | |
| 0,72 | 8,3938 | 1,0001 | ||
| 0,62 | 7,2317 | 0,8610 | ||
| 0,35 | 4,1088 | 0,4831 | ||
| 0,26 | 3,0338 | 0,4308 | ||
| 0,29 | 3,4198 | 0,4137 | ||
| 0,11 | 0,11 | 1,3289 | 0,4120 | |
| 0,00 | 0,03 | 0,3029 | 0,3029 |
Största minskningarna detta kvartal
Vi använder förändringen i portföljallokeringen eftersom det är det mest meningsfulla måttet. Förändringar kan bero på transaktioner eller förändringar i aktiepriser.
| Värdepapper | Aktier (MM) |
Värde (MM$) |
Portfölj % av | ΔPortfölj % av |
|---|---|---|---|---|
| 0,08 | 0,08 | 0,9169 | −9,1263 | |
| 0,00 | 0,00 | −0,4206 | ||
| 0,00 | 0,00 | −0,4177 | ||
| 0,00 | 0,00 | −0,4058 | ||
| 0,00 | 0,00 | −0,4013 | ||
| 0,00 | 0,00 | −0,3951 | ||
| 0,00 | 0,00 | −0,3823 | ||
| 0,00 | 0,00 | −0,3799 | ||
| 0,00 | 0,00 | −0,3794 | ||
| 0,00 | 0,00 | −0,3782 |
13F- och fond arkiveringar
Denna blankett lämnades in den 2020-11-24 för rapporteringsperioden 2020-09-30. Klicka på länksymbolen för att se hela transaktionshistoriken.
Uppgradera för att låsa upp premiumdata och exportera till Excel![]() .
.
| Värdepapper | Typ | Genomsnittligt aktiepris | Aktier (MM) |
ΔAktier (%) |
ΔAktier (%) |
Värde ($MM) |
Portfölj (%) |
ΔPortfölj (%) |
|
|---|---|---|---|---|---|---|---|---|---|
| US912828ZJ22 / United States Treasury Inflation Indexed Bonds | 1,60 | 18,5817 | 18,5817 | ||||||
| US912828X398 / United States Treasury Inflation Indexed Bonds | 0,87 | 10,0628 | 10,0628 | ||||||
| GVMXX / State Street Institutional Investment Trust - State Street Institutional US Govt Money Market Fnd Premier Cls | 0,87 | 3 206 266,67 | 0,87 | 994,94 | 10,0431 | 10,0428 | |||
| US912828Z377 / United States Treasury Inflation Indexed Bonds | 0,72 | 3,29 | 8,3938 | 1,0001 | |||||
| US9128287D64 / United States Treasury Inflation Indexed Bonds | 0,62 | 3,32 | 7,2317 | 0,8610 | |||||
| US912828V491 / United States Treasury Inflation Indexed Bonds | 0,35 | 3,21 | 4,1088 | 0,4831 | |||||
| US9128283R96 / United States Treasury Inflation Indexed Bonds | 0,29 | 3,52 | 3,4198 | 0,4137 | |||||
| US912810SM18 / US TII .25 02/15/2050 (TIPS) | 0,26 | 6,10 | 3,0338 | 0,4308 | |||||
| US9128286N55 / United States Treasury Inflation Indexed Bonds | 0,22 | 2,35 | 2,5312 | 0,2735 | |||||
| US912810FS25 / United States Treasury Inflation Indexed Bonds | 0,19 | 2,67 | 2,2306 | 0,2478 | |||||
| US912828Z948 / United States Treasury Note/Bond | 0,16 | −0,62 | 1,8772 | 0,1659 | |||||
| GVMXX / State Street Institutional Investment Trust - State Street Institutional US Govt Money Market Fnd Premier Cls | 0,11 | 44,94 | 0,11 | 44,30 | 1,3289 | 0,4120 | |||
| US912828YB05 / Us Treasury N/b 1.625000% 08/15/2029 Bond | 0,11 | −0,92 | 1,2629 | 0,1114 | |||||
| US912810FR42 / United States Treasury Inflation Indexed Bonds | 0,10 | 1,06 | 1,1109 | 0,1181 | |||||
| GVMXX / State Street Institutional Investment Trust - State Street Institutional US Govt Money Market Fnd Premier Cls | 0,08 | −90,87 | 0,08 | −90,87 | 0,9169 | −9,1263 | |||
| PLD / Prologis, Inc. | 0,00 | −18,48 | 0,05 | −12,50 | 0,5766 | −0,0202 | |||
| EQIX / Equinix, Inc. | 0,00 | −22,97 | 0,04 | −15,69 | 0,5026 | −0,0458 | |||
| STE / STERIS plc | 0,00 | −26,00 | 0,03 | −15,79 | 0,3781 | −0,0267 | |||
| LH / Labcorp Holdings Inc. | 0,00 | −6,52 | 0,03 | 6,67 | 0,3757 | 0,0531 | |||
| DHR / Danaher Corporation | 0,00 | −31,82 | 0,03 | −15,79 | 0,3747 | −0,0358 | |||
| TMO / Thermo Fisher Scientific Inc. | 0,00 | −32,41 | 0,03 | −17,95 | 0,3739 | −0,0390 | |||
| A / Agilent Technologies, Inc. | 0,00 | −14,25 | 0,03 | 0,00 | 0,3735 | 0,0266 | |||
| QCOM / QUALCOMM Incorporated | 0,00 | −23,74 | 0,03 | 0,00 | 0,3727 | 0,0281 | |||
| JNJ / Johnson & Johnson | 0,00 | −2,29 | 0,03 | 3,33 | 0,3679 | 0,0444 | |||
| AME / AMETEK, Inc. | 0,00 | −9,40 | 0,03 | 0,00 | 0,3667 | 0,0357 | |||
| ETN / Eaton Corporation plc | 0,00 | −19,00 | 0,03 | −6,06 | 0,3634 | 0,0135 | |||
| BRK.B / Berkshire Hathaway Inc. | 0,00 | −18,78 | 0,03 | −3,12 | 0,3631 | 0,0222 | |||
| PG / The Procter & Gamble Company | 0,00 | −15,41 | 0,03 | 0,00 | 0,3628 | 0,0272 | |||
| NEE / NextEra Energy, Inc. | 0,00 | −14,62 | 0,03 | −3,23 | 0,3574 | 0,0279 | |||
| TGT / Target Corporation | 0,00 | −27,07 | 0,03 | −3,23 | 0,3543 | 0,0176 | |||
| BAH / Booz Allen Hamilton Holding Corporation | 0,00 | −16,17 | 0,03 | −11,76 | 0,3543 | −0,0061 | |||
| WM / Waste Management, Inc. | 0,00 | 0,00 | 0,03 | 7,14 | 0,3505 | 0,0521 | |||
| APH / Amphenol Corporation | 0,00 | 0,00 | 0,03 | 11,54 | 0,3442 | 0,0671 | |||
| PEP / PepsiCo, Inc. | 0,00 | 0,95 | 0,03 | 7,41 | 0,3425 | 0,0480 | |||
| CHD / Church & Dwight Co., Inc. | 0,00 | −26,00 | 0,03 | −9,37 | 0,3403 | −0,0048 | |||
| WMT / Walmart Inc. | 0,00 | −33,76 | 0,03 | −21,62 | 0,3376 | −0,0593 | |||
| KO / The Coca-Cola Company | 0,00 | −30,75 | 0,03 | −24,32 | 0,3328 | −0,0628 | |||
| LMT / Lockheed Martin Corporation | 0,00 | 0,00 | 0,03 | 3,85 | 0,3246 | 0,0435 | |||
| INVH / Invitation Homes Inc. | 0,00 | −14,15 | 0,03 | −13,33 | 0,3114 | −0,0131 | |||
| MS / Morgan Stanley | 0,00 | 0,03 | 0,3029 | 0,3029 | |||||
| DBB / Invesco DB Multi-Sector Commodity Trust - Invesco DB Base Metals Fund | 0,00 | −43,36 | 0,03 | −36,59 | 0,3028 | −0,1344 | |||
| MSFT / Microsoft Corporation | 0,00 | −38,61 | 0,03 | −36,59 | 0,3026 | −0,1312 | |||
| TSCO / Tractor Supply Company | 0,00 | −34,89 | 0,03 | −30,56 | 0,3010 | −0,0856 | |||
| AMZN / Amazon.com, Inc. | 0,00 | −46,67 | 0,03 | −39,02 | 0,2922 | −0,1445 | |||
| FTV / Fortive Corporation | 0,00 | 0,02 | 0,2864 | 0,2864 | |||||
| WELL / Welltower Inc. | 0,00 | 16,97 | 0,02 | 26,32 | 0,2863 | 0,0772 | |||
| LOW / Lowe's Companies, Inc. | 0,00 | −48,25 | 0,02 | −36,84 | 0,2848 | −0,1230 | |||
| HD / The Home Depot, Inc. | 0,00 | −34,59 | 0,02 | −27,27 | 0,2803 | −0,0713 | |||
| DPZ / Domino's Pizza, Inc. | 0,00 | 0,02 | 0,2763 | 0,2763 | |||||
| SWKS / Skyworks Solutions, Inc. | 0,00 | 0,02 | 0,2734 | 0,2734 | |||||
| MDLZ / Mondelez International, Inc. | 0,00 | −31,25 | 0,02 | −20,69 | 0,2713 | −0,0484 | |||
| AKAM / Akamai Technologies, Inc. | 0,00 | −29,39 | 0,02 | −25,81 | 0,2680 | −0,0665 | |||
| APD / Air Products and Chemicals, Inc. | 0,00 | 0,00 | 0,02 | 22,22 | 0,2661 | 0,0699 | |||
| DOV / Dover Corporation | 0,00 | −29,49 | 0,02 | −8,33 | 0,2614 | −0,0055 | |||
| WY / Weyerhaeuser Company | 0,00 | −16,27 | 0,02 | 10,00 | 0,2571 | 0,0371 | |||
| IDXX / IDEXX Laboratories, Inc. | 0,00 | −47,66 | 0,02 | −37,14 | 0,2554 | −0,1174 | |||
| SUI / Sun Communities, Inc. | 0,00 | −3,14 | 0,02 | 0,00 | 0,2512 | 0,0236 | |||
| GMG / Goodman Group - Debt/Equity Composite Units | 0,00 | −13,79 | 0,02 | 5,26 | 0,2426 | 0,0379 | |||
| HUM / Humana Inc. | 0,00 | −33,78 | 0,02 | −28,57 | 0,2353 | −0,0675 | |||
| UNH / UnitedHealth Group Incorporated | 0,00 | −28,57 | 0,02 | −23,08 | 0,2351 | −0,0481 | |||
| TDY / Teledyne Technologies Incorporated | 0,00 | −33,68 | 0,02 | −34,48 | 0,2267 | −0,0850 | |||
| UNP / Union Pacific Corporation | 0,00 | −52,40 | 0,02 | −45,71 | 0,2261 | −0,1450 | |||
| KSU / Kansas City Southern | 0,00 | −52,23 | 0,02 | −42,42 | 0,2245 | −0,1284 | |||
| QRVO / Qorvo, Inc. | 0,00 | −56,30 | 0,02 | −48,65 | 0,2230 | −0,1747 | |||
| GOOGL / Alphabet Inc. | 0,00 | 0,00 | 0,02 | 5,56 | 0,2210 | 0,0265 | |||
| HCC / Warrior Met Coal, Inc. | 0,00 | −2,48 | 0,02 | 0,00 | 0,2112 | 0,0164 | |||
| FMC / FMC Corporation | 0,00 | 0,00 | 0,02 | 5,88 | 0,2101 | 0,0303 | |||
| VTR / Ventas, Inc. | 0,00 | 0,02 | 0,2093 | 0,2093 | |||||
| GDS / GDS Holdings Limited - Depositary Receipt (Common Stock) | 0,00 | −24,01 | 0,02 | −22,73 | 0,2013 | −0,0333 | |||
| CHC / Charter Hall Group - Debt/Equity Composite Units | 0,00 | −13,79 | 0,02 | 21,43 | 0,1990 | 0,0407 | |||
| CCK / Crown Holdings, Inc. | 0,00 | 0,00 | 0,02 | 14,29 | 0,1917 | 0,0439 | |||
| VICI / VICI Properties Inc. | 0,00 | 21,78 | 0,02 | 45,45 | 0,1895 | 0,0672 | |||
| REXR / Rexford Industrial Realty, Inc. | 0,00 | −16,47 | 0,02 | −5,88 | 0,1885 | 0,0026 | |||
| RPM / RPM International Inc. | 0,00 | 0,00 | 0,01 | 7,69 | 0,1682 | 0,0296 | |||
| 3288 / Open House Group Co., Ltd. | 0,00 | 0,01 | 0,1676 | 0,1676 | |||||
| SGRO / SEGRO Plc | 0,00 | −24,75 | 0,01 | −18,75 | 0,1590 | −0,0181 | |||
| SBAC / SBA Communications Corporation | 0,00 | 104,76 | 0,01 | 116,67 | 0,1589 | 0,0929 | |||
| AMH / American Homes 4 Rent | 0,00 | −2,54 | 0,01 | 8,33 | 0,1520 | 0,0180 | |||
| AVY / Avery Dennison Corporation | 0,00 | 0,00 | 0,01 | 9,09 | 0,1498 | 0,0282 | |||
| BLL / Ball Corp. | 0,00 | 0,00 | 0,01 | 20,00 | 0,1495 | 0,0358 | |||
| NSC / Norfolk Southern Corporation | 0,00 | −43,93 | 0,01 | −33,33 | 0,1489 | −0,0493 | |||
| UDR / UDR, Inc. | 0,00 | 243,24 | 0,01 | 200,00 | 0,1441 | 0,1003 | |||
| 8954 / ORIX JREIT Inc. | 0,00 | −27,27 | 0,01 | −14,29 | 0,1432 | −0,0092 | |||
| ARE / Alexandria Real Estate Equities, Inc. | 0,00 | −15,38 | 0,01 | −14,29 | 0,1429 | −0,0129 | |||
| STOR / Store Capital Corp | 0,00 | 50,51 | 0,01 | 71,43 | 0,1422 | 0,0676 | |||
| CLNX / Cellnex Telecom, S.A. | 0,00 | 7,03 | 0,01 | 9,09 | 0,1396 | 0,0208 | |||
| RIO / Rio Tinto Group - Depositary Receipt (Common Stock) | 0,00 | 0,00 | 0,01 | 10,00 | 0,1366 | 0,0210 | |||
| ME8U / Mapletree Industrial Trust | 0,00 | −14,29 | 0,01 | 0,00 | 0,1315 | 0,0087 | |||
| PEAK / Healthpeak Properties, Inc. | 0,00 | −27,19 | 0,01 | −26,67 | 0,1282 | −0,0344 | |||
| EXR / Extra Space Storage Inc. | 0,00 | 6,25 | 0,01 | 11,11 | 0,1266 | 0,0275 | |||
| BRX / Brixmor Property Group Inc. | 0,00 | −27,49 | 0,01 | −37,50 | 0,1263 | −0,0474 | |||
| 3298 / Invesco Office J-Reit Inc | 0,00 | −3,70 | 0,01 | 0,00 | 0,1258 | 0,0143 | |||
| 8963 / Invincible Investment Corporation | 0,00 | 34,62 | 0,01 | 66,67 | 0,1209 | 0,0501 | |||
| SHW / The Sherwin-Williams Company | 0,00 | −39,13 | 0,01 | −30,77 | 0,1132 | −0,0041 | |||
| 3471 / Mitsui Fudosan Logistics Park Inc. | 0,00 | −33,33 | 0,01 | −30,77 | 0,1109 | −0,0301 | |||
| QTS / Qts Realty Trust Inc - Class A | 0,00 | −57,22 | 0,01 | −59,09 | 0,1104 | −0,1283 | |||
| 2979 / SOSiLA Logistics REIT, Inc. | 0,00 | 16,67 | 0,01 | 28,57 | 0,1076 | 0,0313 | |||
| VMC / Vulcan Materials Company | 0,00 | −48,09 | 0,01 | −50,00 | 0,1069 | −0,0579 | |||
| ADC / Agree Realty Corporation | 0,00 | −25,91 | 0,01 | −25,00 | 0,1056 | −0,0283 | |||
| STKAF / Stockland - Debt/Equity Composite Units | 0,00 | −13,85 | 0,01 | 12,50 | 0,1051 | 0,0113 | |||
| MGP / MGM Growth Properties LLC - Class A | 0,00 | −32,76 | 0,01 | −33,33 | 0,1013 | −0,0320 | |||
| AMCR / Amcor plc | 0,00 | 0,00 | 0,01 | 14,29 | 0,0981 | 0,0156 | |||
| TWODY / Taylor Wimpey plc - Depositary Receipt (Common Stock) | 0,01 | 24,58 | 0,01 | 0,00 | 0,0963 | 0,0072 | |||
| 1821 / ESR Group Limited | 0,00 | 18,18 | 0,01 | 60,00 | 0,0941 | 0,0390 | |||
| SLG / SL Green Realty Corp. | 0,00 | 0,01 | 0,0898 | 0,0898 | |||||
| OHI / Omega Healthcare Investors, Inc. | 0,00 | −35,16 | 0,01 | −36,36 | 0,0865 | −0,0340 | |||
| VGP / VGP NV | 0,00 | −14,04 | 0,01 | −14,29 | 0,0786 | 0,0019 | |||
| PMT / PennyMac Mortgage Investment Trust | 0,00 | −47,11 | 0,01 | −25,00 | 0,0785 | −0,0127 | |||
| CUZ / Cousins Properties Incorporated | 0,00 | 21,99 | 0,01 | 20,00 | 0,0773 | 0,0172 | |||
| CSH.UN / Chartwell Retirement Residences | 0,00 | −13,25 | 0,01 | 0,00 | 0,0772 | 0,0035 | |||
| 823 / Link Real Estate Investment Trust | 0,00 | −20,00 | 0,01 | −25,00 | 0,0759 | −0,0102 | |||
| 3281 / GLP J-REIT | 0,00 | 0,00 | 0,01 | 20,00 | 0,0716 | 0,0103 | |||
| UE / Urban Edge Properties | 0,00 | 155,02 | 0,01 | 150,00 | 0,0659 | 0,0372 | |||
| M44U / Mapletree Logistics Trust | 0,00 | 0,01 | 0,0627 | 0,0627 | |||||
| RYN / Rayonier Inc. | 0,00 | 0,01 | 0,0613 | 0,0613 | |||||
| TCN / Tricon Residential Inc. | 0,00 | 0,01 | 0,0602 | 0,0602 | |||||
| AGNC / AGNC Investment Corp. | 0,00 | −24,18 | 0,01 | −16,67 | 0,0597 | −0,0067 | |||
| 3319 / A-Living Smart City Services Co., Ltd. | 0,00 | −42,86 | 0,01 | −37,50 | 0,0591 | −0,0341 | |||
| SAFE / Safestore Holdings Plc | 0,00 | −11,93 | 0,00 | 0,00 | 0,0542 | 0,0041 | |||
| JBGS / JBG SMITH Properties | 0,00 | −11,96 | 0,00 | −20,00 | 0,0503 | −0,0072 | |||
| SHUR / Shurgard Self Storage Ltd | 0,00 | −19,13 | 0,00 | 0,00 | 0,0471 | 0,0015 | |||
| 1995 / Ever Sunshine Services Group Limited | 0,00 | −50,00 | 0,00 | −50,00 | 0,0460 | −0,0193 | |||
| EMBASSY / Embassy Office Parks REIT | 0,00 | 0,00 | 0,00 | 0,00 | 0,0454 | 0,0073 | |||
| WH / Wyndham Hotels & Resorts, Inc. | 0,00 | −64,52 | 0,00 | −66,67 | 0,0451 | −0,0525 | |||
| JSI / Samhällsbyggnadsbolaget i Norden AB (publ) | 0,00 | −14,19 | 0,00 | 0,00 | 0,0434 | 0,0047 | |||
| NTST / NETSTREIT Corp. | 0,00 | 0,00 | 0,0432 | 0,0432 | |||||
| DRH / DiamondRock Hospitality Company | 0,00 | −31,81 | 0,00 | −40,00 | 0,0431 | −0,0196 | |||
| AT11 / Citigroup Global Markets Funding Luxembourg S.C.A. - Corporate Bond/Note | 0,00 | −40,07 | 0,00 | −50,00 | 0,0415 | −0,0302 | |||
| US 10yr Ultra Fut Dec20 / DIR (N/A) | 0,00 | 0,0173 | 0,0173 | ||||||
| US 10YR NOTE (CBT)Dec20 / DIR (N/A) | 0,00 | 0,0068 | 0,0068 | ||||||
| BOUGHT CAD/SOLD USD / DFE (N/A) | 0,00 | 0,0055 | 0,0055 | ||||||
| US56168P1049 / Mana Capital Acquisition Corp. | 0,00 | 0,0031 | 0,0031 | ||||||
| US56168P1049 / Mana Capital Acquisition Corp. | 0,00 | 0,0030 | 0,0030 | ||||||
| BOUGHT NOK/SOLD USD / DFE (N/A) | 0,00 | 0,0019 | 0,0019 | ||||||
| XS1450864779 / China Government Bond - JPMorgan Chase | 0,00 | 0,0018 | 0,0018 | ||||||
| US56168P1049 / Mana Capital Acquisition Corp. | 0,00 | 0,0011 | 0,0011 | ||||||
| US56168P1049 / Mana Capital Acquisition Corp. | 0,00 | 0,0006 | 0,0006 | ||||||
| BOUGHT CAD/SOLD USD / DFE (N/A) | 0,00 | 0,0006 | 0,0006 | ||||||
| SOLD SEK/BOUGHT USD / DFE (N/A) | 0,00 | 0,0002 | 0,0002 | ||||||
| US56168P1049 / Mana Capital Acquisition Corp. | 0,00 | 0,0002 | 0,0002 | ||||||
| BOUGHT EUR/SOLD USD / DFE (N/A) | 0,00 | 0,0001 | 0,0001 | ||||||
| US56168P1049 / Mana Capital Acquisition Corp. | 0,00 | 0,0000 | 0,0000 | ||||||
| BOUGHT EUR/SOLD USD / DFE (N/A) | 0,00 | 0,0000 | 0,0000 | ||||||
| BOUGHT CAD/SOLD USD / DFE (N/A) | 0,00 | 0,0000 | 0,0000 | ||||||
| US56168P1049 / Mana Capital Acquisition Corp. | 0,00 | 0,0000 | 0,0000 | ||||||
| VRTX / Vertex Pharmaceuticals Incorporated | 0,00 | −100,00 | 0,00 | −100,00 | −0,4013 | ||||
| US56168P1049 / Mana Capital Acquisition Corp. | 0,00 | −0,0000 | −0,0000 | ||||||
| US56168P1049 / Mana Capital Acquisition Corp. | 0,00 | 0,0000 | 0,0000 | ||||||
| US56168P1049 / Mana Capital Acquisition Corp. | 0,00 | 0,0000 | 0,0000 | ||||||
| BOUGHT EUR/SOLD USD / DFE (N/A) | 0,00 | −0,0000 | −0,0000 | ||||||
| TFC / Truist Financial Corporation | 0,00 | −100,00 | 0,00 | −100,00 | −0,2948 | ||||
| FTNT / Fortinet, Inc. | 0,00 | −100,00 | 0,00 | −100,00 | −0,2970 | ||||
| ADBE / Adobe Inc. | 0,00 | −100,00 | 0,00 | −100,00 | −0,3951 | ||||
| LDOS / Leidos Holdings, Inc. | 0,00 | −100,00 | 0,00 | −100,00 | −0,3301 | ||||
| PSX / Phillips 66 | 0,00 | −100,00 | 0,00 | −100,00 | −0,0660 | ||||
| EW / Edwards Lifesciences Corporation | 0,00 | −100,00 | 0,00 | −100,00 | −0,3697 | ||||
| GD / General Dynamics Corporation | 0,00 | −100,00 | 0,00 | −100,00 | −0,2634 | ||||
| NKE / NIKE, Inc. | 0,00 | −100,00 | 0,00 | −100,00 | −0,2845 | ||||
| LLY / Eli Lilly and Company | 0,00 | −100,00 | 0,00 | −100,00 | −0,3794 | ||||
| ILMN / Illumina, Inc. | 0,00 | −100,00 | 0,00 | −100,00 | −0,1993 | ||||
| CVX / Chevron Corporation | 0,00 | −100,00 | 0,00 | −100,00 | −0,1149 | ||||
| KMB / Kimberly-Clark Corporation | 0,00 | −100,00 | 0,00 | −100,00 | −0,3475 | ||||
| BXP / Boston Properties, Inc. | 0,00 | −100,00 | 0,00 | −100,00 | −0,1459 | ||||
| VRSN / VeriSign, Inc. | 0,00 | −100,00 | 0,00 | −100,00 | −0,3732 | ||||
| META / Meta Platforms, Inc. | 0,00 | −100,00 | 0,00 | −100,00 | −0,2372 | ||||
| INFO / Harbor ETF Trust - Harbor PanAgora Dynamic Large Cap Core ETF | 0,00 | −100,00 | 0,00 | −100,00 | −0,1984 | ||||
| VMW / Vmware Inc. - Class A | 0,00 | −100,00 | 0,00 | −100,00 | −0,3007 | ||||
| ICE / Intercontinental Exchange, Inc. | 0,00 | −100,00 | 0,00 | −100,00 | −0,3248 | ||||
| ANTM / Anthem Inc | 0,00 | −100,00 | 0,00 | −100,00 | −0,2636 | ||||
| LHX / L3Harris Technologies, Inc. | 0,00 | −100,00 | 0,00 | −100,00 | −0,2614 | ||||
| GIS / General Mills, Inc. | 0,00 | −100,00 | 0,00 | −100,00 | −0,3799 | ||||
| NEM / Newmont Corporation | 0,00 | −100,00 | 0,00 | −100,00 | −0,0834 | ||||
| REGN / Regeneron Pharmaceuticals, Inc. | 0,00 | −100,00 | 0,00 | −100,00 | −0,3027 | ||||
| CTVA / Corteva, Inc. | 0,00 | −100,00 | 0,00 | −100,00 | −0,0738 | ||||
| SPGI / S&P Global Inc. | 0,00 | −100,00 | 0,00 | −100,00 | −0,3512 | ||||
| AZO / AutoZone, Inc. | 0,00 | −100,00 | 0,00 | −100,00 | −0,2857 | ||||
| COST / Costco Wholesale Corporation | 0,00 | −100,00 | 0,00 | −100,00 | −0,3104 | ||||
| O / Realty Income Corporation | 0,00 | −100,00 | 0,00 | −100,00 | −0,1752 | ||||
| NOW / ServiceNow, Inc. | 0,00 | −100,00 | 0,00 | −100,00 | −0,2949 | ||||
| KMI / Kinder Morgan, Inc. | 0,00 | −100,00 | 0,00 | −100,00 | −0,0693 | ||||
| JPM / JPMorgan Chase & Co. | 0,00 | −100,00 | 0,00 | −100,00 | −0,2462 | ||||
| PEG / Public Service Enterprise Group Incorporated | 0,00 | −100,00 | 0,00 | −100,00 | −0,3201 | ||||
| TECH / Bio-Techne Corporation | 0,00 | −100,00 | 0,00 | −100,00 | −0,1951 | ||||
| LIN / Linedata Services S.A. | 0,00 | −100,00 | 0,00 | −100,00 | −0,2037 | ||||
| WFC / Wells Fargo & Company | 0,00 | −100,00 | 0,00 | −100,00 | −0,2758 | ||||
| AMAT / Applied Materials, Inc. | 0,00 | −100,00 | 0,00 | −100,00 | −0,3483 | ||||
| VLO / Valero Energy Corporation | 0,00 | −100,00 | 0,00 | −100,00 | −0,0888 | ||||
| CSCO / Cisco Systems, Inc. | 0,00 | −100,00 | 0,00 | −100,00 | −0,3199 | ||||
| ABBV / AbbVie Inc. | 0,00 | −100,00 | 0,00 | −100,00 | −0,3782 | ||||
| CRWD / CrowdStrike Holdings, Inc. | 0,00 | −100,00 | 0,00 | −100,00 | −0,1810 | ||||
| CRL / Charles River Laboratories International, Inc. | 0,00 | −100,00 | 0,00 | −100,00 | −0,3293 | ||||
| CPB / The Campbell's Company | 0,00 | −100,00 | 0,00 | −100,00 | −0,2938 | ||||
| TRMB / Trimble Inc. | 0,00 | −100,00 | 0,00 | −100,00 | −0,2899 | ||||
| PYPL / PayPal Holdings, Inc. | 0,00 | −100,00 | 0,00 | −100,00 | −0,3622 | ||||
| BMY / Bristol-Myers Squibb Company | 0,00 | −100,00 | 0,00 | −100,00 | −0,4058 | ||||
| SNPS / Synopsys, Inc. | 0,00 | −100,00 | 0,00 | −100,00 | −0,4177 | ||||
| ATVI / Activision Blizzard Inc | 0,00 | −100,00 | 0,00 | −100,00 | −0,3652 | ||||
| GILD / Gilead Sciences, Inc. | 0,00 | −100,00 | 0,00 | −100,00 | −0,3459 | ||||
| ODFL / Old Dominion Freight Line, Inc. | 0,00 | −100,00 | 0,00 | −100,00 | −0,4206 | ||||
| EMN / Eastman Chemical Company | 0,00 | −100,00 | 0,00 | −100,00 | −0,0816 | ||||
| LRCX / Lam Research Corporation | 0,00 | −100,00 | 0,00 | −100,00 | −0,3823 | ||||
| MNST / Monster Beverage Corporation | 0,00 | −100,00 | 0,00 | −100,00 | −0,3584 | ||||
| NDSN / Nordson Corporation | 0,00 | −100,00 | 0,00 | −100,00 | −0,3643 | ||||
| TTE / TotalEnergies SE - Depositary Receipt (Common Stock) | 0,00 | −100,00 | 0,00 | −100,00 | −0,0635 | ||||
| BAC / Bank of America Corporation | 0,00 | −100,00 | 0,00 | −100,00 | −0,2454 | ||||
| ZION / Zions Bancorporation, National Association | 0,00 | −100,00 | 0,00 | −100,00 | −0,1995 | ||||
| TJX / The TJX Companies, Inc. | 0,00 | −100,00 | 0,00 | −100,00 | −0,3591 | ||||
| ABT / Abbott Laboratories | 0,00 | −100,00 | 0,00 | −100,00 | −0,3637 | ||||
| NBIX / Neurocrine Biosciences, Inc. | 0,00 | −100,00 | 0,00 | −100,00 | −0,3296 | ||||
| US56168P1049 / Mana Capital Acquisition Corp. | −0,00 | −0,0000 | −0,0000 | ||||||
| US56168P1049 / Mana Capital Acquisition Corp. | −0,00 | −0,0000 | −0,0000 | ||||||
| US56168P1049 / Mana Capital Acquisition Corp. | −0,00 | −0,0000 | −0,0000 | ||||||
| XS1450864779 / China Government Bond - JPMorgan Chase | −0,00 | −0,0000 | −0,0000 | ||||||
| SOLD CAD/BOUGHT USD / DFE (N/A) | −0,00 | −0,0001 | −0,0001 | ||||||
| SOLD CAD/BOUGHT USD / DFE (N/A) | −0,00 | −0,0001 | −0,0001 | ||||||
| US56168P1049 / Mana Capital Acquisition Corp. | −0,00 | −0,0001 | −0,0001 | ||||||
| SOLD NOK/BOUGHT USD / DFE (N/A) | −0,00 | −0,0002 | −0,0002 | ||||||
| SOLD EUR/BOUGHT USD / DFE (N/A) | −0,00 | −0,0003 | −0,0003 | ||||||
| SOLD CAD/BOUGHT USD / DFE (N/A) | −0,00 | −0,0013 | −0,0013 | ||||||
| XS1450864779 / China Government Bond - JPMorgan Chase | −0,00 | −0,0019 | −0,0019 | ||||||
| XS1450864779 / China Government Bond - JPMorgan Chase | −0,00 | −0,0037 | −0,0037 |