Grundläggande statistik
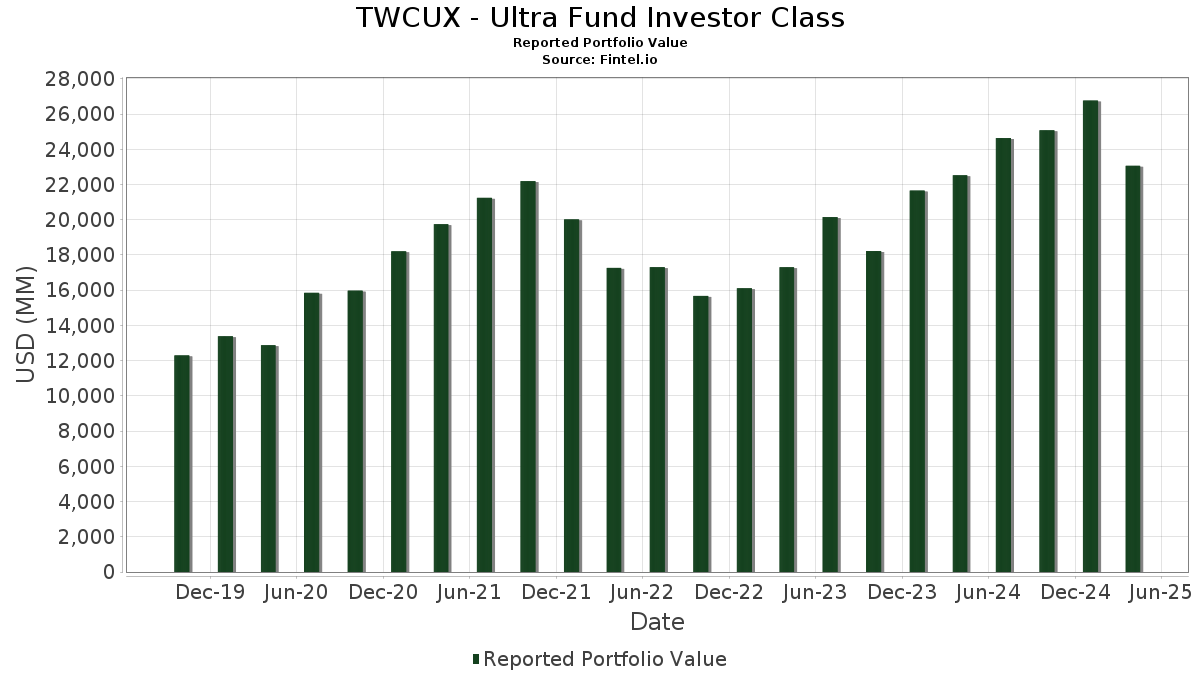
| Portföljvärde | $ 23 060 645 214 |
| Aktuella positioner | 68 |
Senaste innehav, resultat, förvaltat kapital (från 13F, 13D)
TWCUX - Ultra Fund Investor Class har redovisat 68 totala innehav i sina senaste SEC-arkiveringar. Det senaste portföljvärdet beräknas vara $ 23 060 645 214 USD. Faktiskt förvaltade tillgångar (AUM) är detta värde plus likvida medel (som inte redovisas). TWCUX - Ultra Fund Investor Classs största innehav är NVIDIA Corporation (US:NVDA) , Apple Inc. (US:AAPL) , Amazon.com, Inc. (US:AMZN) , Microsoft Corporation (US:MSFT) , and Mastercard Incorporated (US:MA) . TWCUX - Ultra Fund Investor Classs nya positioner inkluderar Cloudflare, Inc. (US:NET) , .
Största ökningarna detta kvartal
Vi använder förändringen i portföljallokeringen eftersom det är det mest meningsfulla måttet. Förändringar kan bero på transaktioner eller förändringar i aktiekurser.
| Värdepapper | Aktier (MM) |
Värde (MM$) |
Portfölj % av | ΔPortfölj % av |
|---|---|---|---|---|
| 0,76 | 861,24 | 3,7369 | 0,9570 | |
| 0,94 | 160,68 | 0,6972 | 0,5825 | |
| 1,93 | 1 056,02 | 4,5821 | 0,5795 | |
| 0,91 | 109,31 | 0,4743 | 0,4743 | |
| 0,62 | 618,58 | 2,6840 | 0,4046 | |
| 3,91 | 1 545,07 | 6,7041 | 0,3545 | |
| 1,51 | 340,84 | 1,4789 | 0,3371 | |
| 24,18 | 2 634,01 | 11,4290 | 0,3009 | |
| 0,55 | 137,50 | 0,5966 | 0,2603 | |
| 0,21 | 419,82 | 1,8216 | 0,2590 |
Största minskningarna detta kvartal
Vi använder förändringen i portföljallokeringen eftersom det är det mest meningsfulla måttet. Förändringar kan bero på transaktioner eller förändringar i aktiepriser.
| Värdepapper | Aktier (MM) |
Värde (MM$) |
Portfölj % av | ΔPortfölj % av |
|---|---|---|---|---|
| 2,79 | 787,79 | 3,4182 | −0,8066 | |
| 8,53 | 1 573,84 | 6,8289 | −0,7571 | |
| 0,41 | 364,97 | 1,5836 | −0,7096 | |
| 1,54 | 846,56 | 3,6732 | −0,5771 | |
| 5,77 | 915,57 | 3,9727 | −0,4266 | |
| 5,87 | 943,94 | 4,0958 | −0,4156 | |
| 1,63 | 95,07 | 0,4125 | −0,3296 | |
| 1,49 | 400,92 | 1,7396 | −0,3166 | |
| 0,75 | 202,81 | 0,8800 | −0,2803 | |
| 1,60 | 163,35 | 0,7088 | −0,1446 |
13F- och fond arkiveringar
Denna blankett lämnades in den 2025-06-27 för rapporteringsperioden 2025-04-30. Klicka på länksymbolen för att se hela transaktionshistoriken.
Uppgradera för att låsa upp premiumdata och exportera till Excel![]() .
.
| Värdepapper | Typ | Genomsnittligt aktiepris | Aktier (MM) |
ΔAktier (%) |
ΔAktier (%) |
Värde ($MM) |
Portfölj (%) |
ΔPortfölj (%) |
|
|---|---|---|---|---|---|---|---|---|---|
| NVDA / NVIDIA Corporation | 24,18 | −2,41 | 2 634,01 | −11,48 | 11,4290 | 0,3009 | |||
| AAPL / Apple Inc. | 11,73 | −5,12 | 2 492,09 | −14,57 | 10,8132 | −0,0965 | |||
| AMZN / Amazon.com, Inc. | 8,53 | 0,00 | 1 573,84 | −22,41 | 6,8289 | −0,7571 | |||
| MSFT / Microsoft Corporation | 3,91 | −4,43 | 1 545,07 | −8,99 | 6,7041 | 0,3545 | |||
| MA / Mastercard Incorporated | 1,93 | 0,00 | 1 056,02 | −1,33 | 4,5821 | 0,5795 | |||
| GOOG / Alphabet Inc. | 5,87 | 0,00 | 943,94 | −21,75 | 4,0958 | −0,4156 | |||
| GOOGL / Alphabet Inc. | 5,77 | 0,00 | 915,57 | −22,16 | 3,9727 | −0,4266 | |||
| NFLX / Netflix, Inc. | 0,76 | 0,00 | 861,24 | 15,86 | 3,7369 | 0,9570 | |||
| META / Meta Platforms, Inc. | 1,54 | −6,49 | 846,56 | −25,51 | 3,6732 | −0,5771 | |||
| TSLA / Tesla, Inc. | 2,79 | 0,00 | 787,79 | −30,26 | 3,4182 | −0,8066 | |||
| COST / Costco Wholesale Corporation | 0,62 | 0,00 | 618,58 | 1,49 | 2,6840 | 0,4046 | |||
| CMG / Chipotle Mexican Grill, Inc. | 9,45 | 0,00 | 477,41 | −13,42 | 2,0715 | 0,0093 | |||
| ISRG / Intuitive Surgical, Inc. | 0,87 | 9,32 | 449,42 | −1,40 | 1,9500 | 0,2454 | |||
| FICO / Fair Isaac Corporation | 0,21 | −5,38 | 419,82 | 0,48 | 1,8216 | 0,2590 | |||
| CRM / Salesforce, Inc. | 1,49 | −7,27 | 400,92 | −27,08 | 1,7396 | −0,3166 | |||
| AMAT / Applied Materials, Inc. | 2,45 | 0,00 | 369,84 | −16,43 | 1,6048 | −0,0505 | |||
| LLY / Eli Lilly and Company | 0,41 | −46,30 | 364,97 | −40,48 | 1,5836 | −0,7096 | |||
| ZS / Zscaler, Inc. | 1,51 | 0,00 | 340,84 | 11,64 | 1,4789 | 0,3371 | |||
| V / Visa Inc. | 0,78 | −17,44 | 269,84 | −16,55 | 1,1708 | −0,0385 | |||
| MSCI / MSCI Inc. | 0,45 | 0,00 | 245,84 | −8,66 | 1,0667 | 0,0601 | |||
| ADI / Analog Devices, Inc. | 1,25 | 0,00 | 242,87 | −8,01 | 1,0538 | 0,0664 | |||
| DOCU / DocuSign, Inc. | 2,81 | 0,00 | 229,80 | −15,49 | 0,9971 | −0,0198 | |||
| UNH / UnitedHealth Group Incorporated | 0,55 | 0,00 | 224,65 | −24,16 | 0,9747 | −0,1330 | |||
| ECL / Ecolab Inc. | 0,86 | 0,00 | 215,73 | 0,50 | 0,9360 | 0,1332 | |||
| REGN / Regeneron Pharmaceuticals, Inc. | 0,35 | 0,00 | 207,17 | −11,03 | 0,8989 | 0,0281 | |||
| ASML / ASML Holding N.V. | 0,31 | 0,00 | 204,85 | −9,51 | 0,8888 | 0,0422 | |||
| LULU / lululemon athletica inc. | 0,75 | 0,00 | 202,81 | −34,63 | 0,8800 | −0,2803 | |||
| WING / Wingstop Inc. | 0,76 | 7,76 | 201,61 | −4,55 | 0,8748 | 0,0849 | |||
| ALNY / Alnylam Pharmaceuticals, Inc. | 0,75 | 21,46 | 196,64 | 17,85 | 0,8532 | 0,2292 | |||
| AVGO / Broadcom Inc. | 1,00 | −3,86 | 191,70 | −16,37 | 0,8318 | −0,0255 | |||
| DT / Dynatrace, Inc. | 4,03 | 0,00 | 189,15 | −18,67 | 0,8207 | −0,0490 | |||
| SNPS / Synopsys, Inc. | 0,39 | 0,00 | 177,18 | −12,65 | 0,7688 | 0,0102 | |||
| TW / Tradeweb Markets Inc. | 1,24 | 0,00 | 171,35 | 8,98 | 0,7435 | 0,1555 | |||
| OKTA / Okta, Inc. | 1,47 | −10,23 | 164,31 | 6,86 | 0,7130 | 0,1379 | |||
| DDOG / Datadog, Inc. | 1,60 | 0,00 | 163,35 | −28,41 | 0,7088 | −0,1446 | |||
| WDAY / Workday, Inc. | 0,66 | 16,78 | 161,94 | 9,18 | 0,7027 | 0,1479 | |||
| IBKR / Interactive Brokers Group, Inc. | 0,94 | 563,12 | 160,68 | 424,08 | 0,6972 | 0,5825 | |||
| EOG / EOG Resources, Inc. | 1,33 | 0,00 | 146,85 | −12,29 | 0,6372 | 0,0110 | |||
| PODD / Insulet Corporation | 0,55 | 68,73 | 137,50 | 52,92 | 0,5966 | 0,2603 | |||
| WAB / Westinghouse Air Brake Technologies Corporation | 0,70 | 0,00 | 130,24 | −11,15 | 0,5651 | 0,0169 | |||
| AYI / Acuity Inc. | 0,53 | 0,00 | 129,11 | −26,71 | 0,5602 | −0,0986 | |||
| FTV / Fortive Corporation | 1,79 | 0,00 | 124,81 | −14,31 | 0,5416 | −0,0032 | |||
| IDXX / IDEXX Laboratories, Inc. | 0,28 | 0,00 | 120,28 | 2,51 | 0,5219 | 0,0831 | |||
| KYCCF / Keyence Corporation | 0,27 | −18,18 | 112,88 | −20,58 | 0,4898 | −0,0418 | |||
| NET / Cloudflare, Inc. | 0,91 | 109,31 | 0,4743 | 0,4743 | |||||
| STZ / Constellation Brands, Inc. | 0,56 | −11,34 | 105,59 | −8,03 | 0,4581 | 0,0288 | |||
| WMS / Advanced Drainage Systems, Inc. | 0,90 | 0,00 | 102,25 | −6,14 | 0,4437 | 0,0363 | |||
| IT / Gartner, Inc. | 0,23 | 0,00 | 96,43 | −22,43 | 0,4184 | −0,0465 | |||
| XYZ / Block, Inc. | 1,63 | −25,58 | 95,07 | −52,09 | 0,4125 | −0,3296 | |||
| CPRT / Copart, Inc. | 1,56 | 0,00 | 95,02 | 5,35 | 0,4123 | 0,0750 | |||
| WAT / Waters Corporation | 0,23 | 0,00 | 79,28 | −16,31 | 0,3440 | −0,0103 | |||
| SLB / Schlumberger Limited | 2,18 | −23,32 | 72,48 | −36,70 | 0,3145 | −0,1138 | |||
| JCI / Johnson Controls International plc | 0,83 | 21,11 | 69,30 | 30,27 | 0,3007 | 0,1017 | |||
| CTAS / Cintas Corporation | 0,30 | 0,00 | 63,50 | 5,54 | 0,2755 | 0,0505 | |||
| DCI / Donaldson Company, Inc. | 0,89 | 0,00 | 58,43 | −7,67 | 0,2535 | 0,0169 | |||
| VRT / Vertiv Holdings Co | 0,68 | 9,19 | 57,80 | −20,33 | 0,2508 | −0,0205 | |||
| DXCM / DexCom, Inc. | 0,79 | −17,54 | 56,03 | −32,21 | 0,2431 | −0,0660 | |||
| EW / Edwards Lifesciences Corporation | 0,72 | 0,00 | 54,73 | 4,20 | 0,2375 | 0,0410 | |||
| NDSN / Nordson Corporation | 0,23 | 0,00 | 43,22 | −13,92 | 0,1875 | −0,0002 | |||
| Fixed Income Clearing Corp 4.36 05/01/2025 / RA (RPEN2JAO5) | 42,72 | 0,1853 | 0,1853 | ||||||
| POOL / Pool Corporation | 0,11 | 0,00 | 32,54 | −14,85 | 0,1412 | −0,0017 | |||
| JETD / MAX Airlines -3X Inverse Leveraged ETNs due May 28, 2043 - Structured Product | 5,34 | 0,0232 | 0,0232 | ||||||
| US003CVR0169 / CONTRA ABIOMED INC | 0,28 | 0,00 | 0,29 | 0,00 | 0,0012 | 0,0002 | |||
| GVMXX / State Street Institutional Investment Trust - State Street Institutional US Govt Money Market Fnd Premier Cls | 0,09 | 116,74 | 0,09 | 118,60 | 0,0004 | 0,0002 | |||
| BOUGHT JPY/SOLD USD / DFE (N/A) | 0,09 | 0,0004 | 0,0004 | ||||||
| BOUGHT JPY/SOLD USD / DFE (N/A) | 0,05 | 0,0002 | 0,0002 | ||||||
| SOLD JPY/BOUGHT USD / DFE (N/A) | −0,01 | −0,0001 | −0,0001 | ||||||
| SOLD JPY/BOUGHT USD / DFE (N/A) | −0,01 | −0,0001 | −0,0001 |