Grundläggande statistik
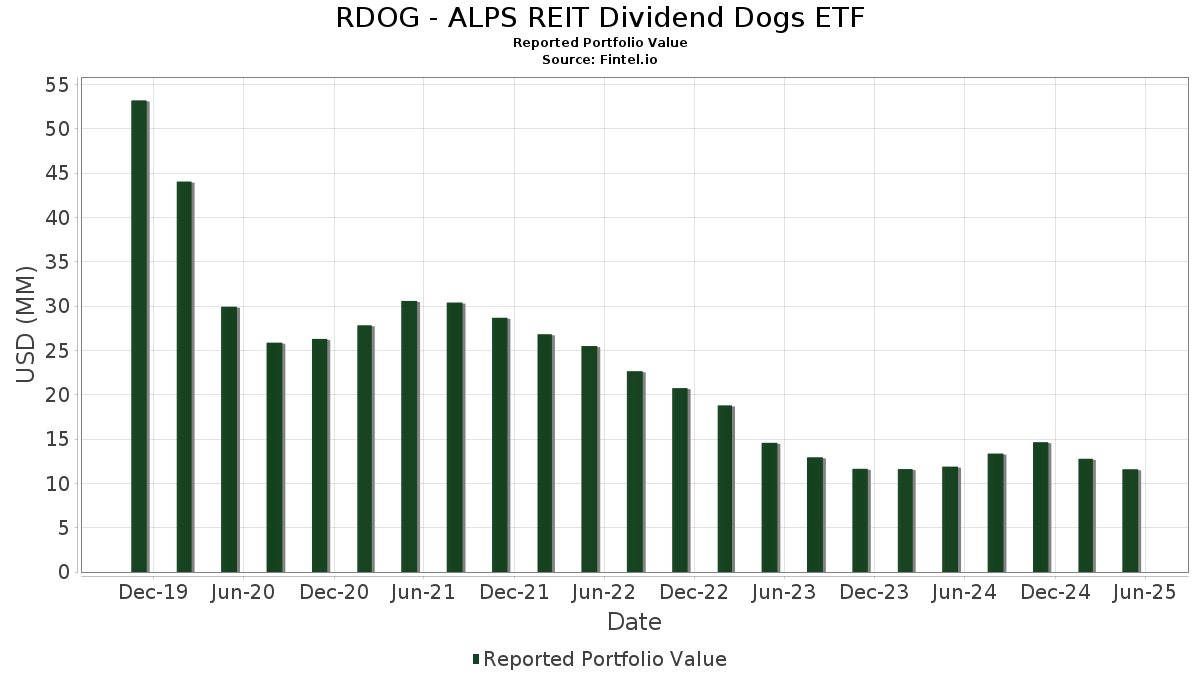
| Portföljvärde | $ 11 574 081 |
| Aktuella positioner | 46 |
Senaste innehav, resultat, förvaltat kapital (från 13F, 13D)
RDOG - ALPS REIT Dividend Dogs ETF har redovisat 46 totala innehav i sina senaste SEC-arkiveringar. Det senaste portföljvärdet beräknas vara $ 11 574 081 USD. Faktiskt förvaltade tillgångar (AUM) är detta värde plus likvida medel (som inte redovisas). RDOG - ALPS REIT Dividend Dogs ETFs största innehav är Digital Realty Trust, Inc. (US:DLR) , EPR Properties (US:EPR) , SBA Communications Corporation (US:SBAC) , Equinix, Inc. (US:EQIX) , and NETSTREIT Corp. (US:NTST) . RDOG - ALPS REIT Dividend Dogs ETFs nya positioner inkluderar Easterly Government Properties, Inc. (US:DEA) , .
Största ökningarna detta kvartal
Vi använder förändringen i portföljallokeringen eftersom det är det mest meningsfulla måttet. Förändringar kan bero på transaktioner eller förändringar i aktiekurser.
| Värdepapper | Aktier (MM) |
Värde (MM$) |
Portfölj % av | ΔPortfölj % av |
|---|---|---|---|---|
| 0,01 | 0,22 | 1,9367 | 1,9367 | |
| 0,00 | 0,32 | 2,7277 | 0,8065 | |
| 0,02 | 0,28 | 2,4500 | 0,4676 | |
| 0,00 | 0,27 | 2,3710 | 0,3895 | |
| 0,00 | 0,29 | 2,5017 | 0,3658 | |
| 0,00 | 0,22 | 1,8727 | 0,3156 | |
| 0,04 | 0,25 | 2,1613 | 0,2524 | |
| 0,05 | 0,26 | 2,2707 | 0,2326 | |
| 0,02 | 0,29 | 2,4930 | 0,2281 | |
| 0,00 | 0,28 | 2,3876 | 0,2230 |
Största minskningarna detta kvartal
Vi använder förändringen i portföljallokeringen eftersom det är det mest meningsfulla måttet. Förändringar kan bero på transaktioner eller förändringar i aktiepriser.
| Värdepapper | Aktier (MM) |
Värde (MM$) |
Portfölj % av | ΔPortfölj % av |
|---|---|---|---|---|
| 0,05 | 0,21 | 1,8376 | −1,5209 | |
| 0,03 | 0,20 | 1,7042 | −0,6578 | |
| 0,11 | 0,22 | 1,8787 | −0,4661 | |
| 0,05 | 0,21 | 1,8240 | −0,3680 | |
| 0,01 | 0,24 | 2,0999 | −0,2524 | |
| 0,02 | 0,25 | 2,1951 | −0,2217 | |
| 0,01 | 0,24 | 2,0805 | −0,2158 | |
| 0,02 | 0,24 | 2,0543 | −0,2043 | |
| 0,01 | 0,29 | 2,5411 | −0,1289 | |
| 0,02 | 0,24 | 2,1003 | −0,0831 |
13F- och fond arkiveringar
Denna blankett lämnades in den 2025-07-30 för rapporteringsperioden 2025-05-31. Klicka på länksymbolen för att se hela transaktionshistoriken.
Uppgradera för att låsa upp premiumdata och exportera till Excel![]() .
.
| Värdepapper | Typ | Genomsnittligt aktiepris | Aktier (MM) |
ΔAktier (%) |
ΔAktier (%) |
Värde ($MM) |
Portfölj (%) |
ΔPortfölj (%) |
|
|---|---|---|---|---|---|---|---|---|---|
| DLR / Digital Realty Trust, Inc. | 0,00 | 17,18 | 0,32 | 28,57 | 2,7277 | 0,8065 | |||
| EPR / EPR Properties | 0,01 | −17,87 | 0,29 | −13,78 | 2,5411 | −0,1289 | |||
| SBAC / SBA Communications Corporation | 0,00 | −7,37 | 0,29 | −1,36 | 2,5166 | 0,2048 | |||
| EQIX / Equinix, Inc. | 0,00 | 7,95 | 0,29 | 5,86 | 2,5017 | 0,3658 | |||
| NTST / NETSTREIT Corp. | 0,02 | −7,38 | 0,29 | −0,35 | 2,4930 | 0,2281 | |||
| HST / Host Hotels & Resorts, Inc. | 0,02 | 16,54 | 0,28 | 11,86 | 2,4500 | 0,4676 | |||
| AMT / American Tower Corporation | 0,00 | −12,20 | 0,28 | −8,58 | 2,3999 | 0,0287 | |||
| CSR / Centerspace | 0,00 | 3,71 | 0,28 | 0,00 | 2,3876 | 0,2230 | |||
| OUT / OUTFRONT Media Inc. | 0,02 | 10,65 | 0,28 | −1,79 | 2,3778 | 0,1869 | |||
| RHP / Ryman Hospitality Properties, Inc. | 0,00 | 10,34 | 0,27 | 8,30 | 2,3710 | 0,3895 | |||
| STAG / STAG Industrial, Inc. | 0,01 | −4,52 | 0,27 | −5,52 | 2,3681 | 0,0969 | |||
| O / Realty Income Corporation | 0,00 | −8,10 | 0,27 | −9,03 | 2,3567 | 0,0176 | |||
| CTO / CTO Realty Growth, Inc. | 0,01 | 1,87 | 0,27 | −1,46 | 2,3367 | 0,1897 | |||
| NNN / NNN REIT, Inc. | 0,01 | −5,21 | 0,27 | −6,92 | 2,3291 | 0,0673 | |||
| VICI / VICI Properties Inc. | 0,01 | −9,11 | 0,27 | −11,55 | 2,3221 | −0,0483 | |||
| CCI / Crown Castle Inc. | 0,00 | −11,53 | 0,27 | −5,69 | 2,2942 | 0,0923 | |||
| PSTL / Postal Realty Trust, Inc. | 0,02 | −8,75 | 0,27 | −9,25 | 2,2933 | 0,0027 | |||
| GOOD / Gladstone Commercial Corporation | 0,02 | 6,41 | 0,26 | −5,73 | 2,2722 | 0,0853 | |||
| CIO / City Office REIT, Inc. | 0,05 | 8,75 | 0,26 | 1,15 | 2,2707 | 0,2326 | |||
| UHT / Universal Health Realty Income Trust | 0,01 | −9,11 | 0,26 | −9,69 | 2,2583 | −0,0035 | |||
| PLYM / Plymouth Industrial REIT, Inc. | 0,02 | 4,95 | 0,26 | −2,26 | 2,2523 | 0,1722 | |||
| GTY / Getty Realty Corp. | 0,01 | −1,60 | 0,26 | −8,45 | 2,2521 | 0,0280 | |||
| PINE / Alpine Income Property Trust, Inc. | 0,02 | −0,53 | 0,26 | −8,19 | 2,2344 | 0,0330 | |||
| LXP / LXP Industrial Trust | 0,03 | −6,18 | 0,26 | −10,10 | 2,2331 | −0,0177 | |||
| GLPI / Gaming and Leisure Properties, Inc. | 0,01 | −5,01 | 0,26 | −11,72 | 2,2163 | −0,0526 | |||
| NSA / National Storage Affiliates Trust | 0,01 | 6,42 | 0,26 | −5,19 | 2,2138 | 0,0990 | |||
| BDN / Brandywine Realty Trust | 0,06 | 18,95 | 0,26 | 0,00 | 2,2020 | 0,2007 | |||
| BFS / Saul Centers, Inc. | 0,01 | 5,21 | 0,26 | −5,20 | 2,2018 | 0,0946 | |||
| BNL / Broadstone Net Lease, Inc. | 0,02 | −6,87 | 0,25 | −12,11 | 2,1987 | −0,0654 | |||
| ELME / Elme Communities | 0,02 | −10,94 | 0,25 | −17,80 | 2,1951 | −0,2217 | |||
| UMH / UMH Properties, Inc. | 0,02 | 0,87 | 0,25 | −10,60 | 2,1924 | −0,0267 | |||
| AHH / Armada Hoffler Properties, Inc. | 0,04 | 35,23 | 0,25 | 2,46 | 2,1613 | 0,2524 | |||
| BRT / BRT Apartments Corp. | 0,02 | −0,29 | 0,24 | −12,90 | 2,1003 | −0,0831 | |||
| CHCT / Community Healthcare Trust Incorporated | 0,01 | −7,29 | 0,24 | −19,00 | 2,0999 | −0,2524 | |||
| REXR / Rexford Industrial Realty, Inc. | 0,01 | −3,80 | 0,24 | −18,09 | 2,0805 | −0,2158 | |||
| NXRT / NexPoint Residential Trust, Inc. | 0,01 | 9,27 | 0,24 | −12,73 | 2,0765 | −0,0771 | |||
| HR / Healthcare Realty Trust Incorporated | 0,02 | −2,70 | 0,24 | −17,71 | 2,0543 | −0,2043 | |||
| APLE / Apple Hospitality REIT, Inc. | 0,02 | 11,15 | 0,23 | −13,06 | 2,0192 | −0,0828 | |||
| RLJ / RLJ Lodging Trust | 0,03 | 11,51 | 0,23 | −11,97 | 1,9694 | −0,0593 | |||
| DEA / Easterly Government Properties, Inc. | 0,01 | 0,22 | 1,9367 | 1,9367 | |||||
| ONL / Orion Properties Inc. | 0,11 | 56,50 | 0,22 | −27,42 | 1,8787 | −0,4661 | |||
| IIPR / Innovative Industrial Properties, Inc. | 0,00 | 41,91 | 0,22 | 8,54 | 1,8727 | 0,3156 | |||
| MPW / Medical Properties Trust, Inc. | 0,05 | −36,03 | 0,21 | −50,58 | 1,8376 | −1,5209 | |||
| INN / Summit Hotel Properties, Inc. | 0,05 | 11,31 | 0,21 | −24,64 | 1,8240 | −0,3680 | |||
| GMRE / Global Medical REIT Inc. | 0,03 | −9,60 | 0,20 | −34,77 | 1,7042 | −0,6578 | |||
| US8574928623 / State Street Institutional Treasury Plus Money Market Fund | 0,01 | 165,47 | 0,01 | 200,00 | 0,0519 | 0,0342 | |||
| State Street Navigator Securities Lending Government Money Market Portfolio / STIV (N/A) | 0,00 | 0,00 | 0,0000 | 0,0000 |