Grundläggande statistik
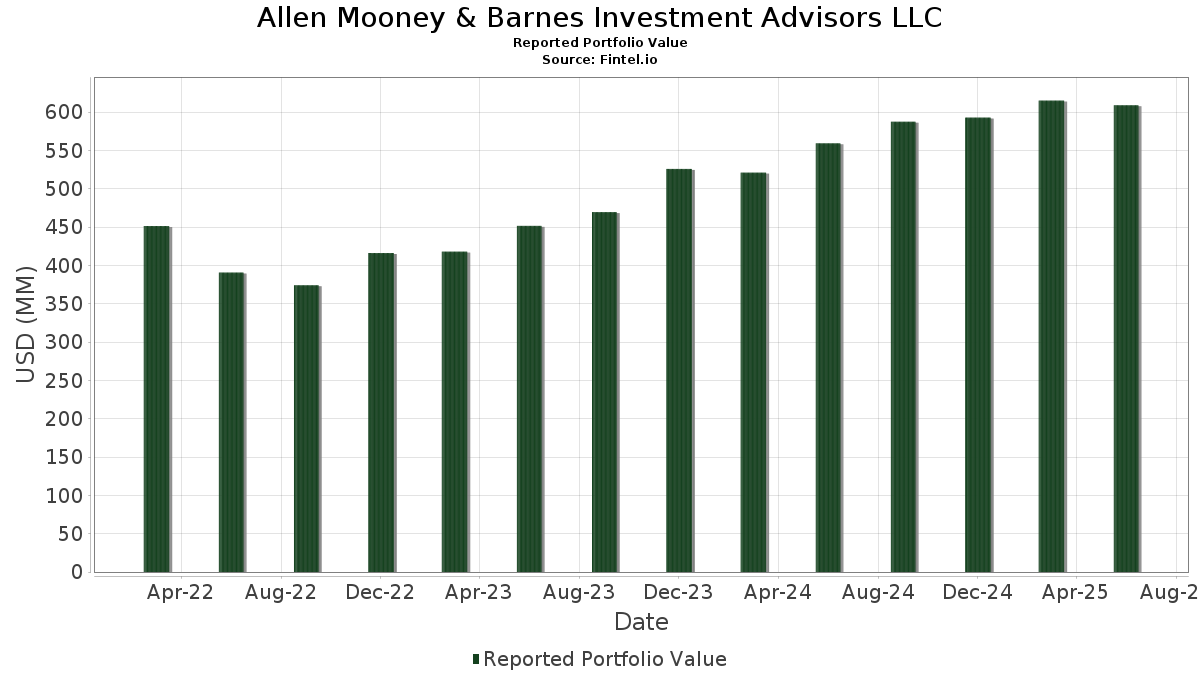
| Portföljvärde | $ 608 880 833 |
| Aktuella positioner | 153 |
Senaste innehav, resultat, förvaltat kapital (från 13F, 13D)
Allen Mooney & Barnes Investment Advisors LLC har redovisat 153 totala innehav i sina senaste SEC-arkiveringar. Det senaste portföljvärdet beräknas vara $ 608 880 833 USD. Faktiskt förvaltade tillgångar (AUM) är detta värde plus likvida medel (som inte redovisas). Allen Mooney & Barnes Investment Advisors LLCs största innehav är Meta Platforms, Inc. (US:META) , Apple Inc. (US:AAPL) , Alphabet Inc. (US:GOOGL) , Microsoft Corporation (US:MSFT) , and JPMorgan Chase & Co. (US:JPM) . Allen Mooney & Barnes Investment Advisors LLCs nya positioner inkluderar EOG Resources, Inc. (US:EOG) , Capital One Financial Corporation (US:COF) , Renasant Corporation (US:RNST) , Netflix, Inc. (US:NFLX) , and .
Största ökningarna detta kvartal
Vi använder förändringen i portföljallokeringen eftersom det är det mest meningsfulla måttet. Förändringar kan bero på transaktioner eller förändringar i aktiekurser.
| Värdepapper | Aktier (MM) |
Värde (MM$) |
Portfölj % av | ΔPortfölj % av |
|---|---|---|---|---|
| 0,04 | 28,50 | 4,6812 | 2,7661 | |
| 0,06 | 7,40 | 1,2155 | 1,2155 | |
| 0,05 | 23,50 | 3,8601 | 1,0041 | |
| 0,25 | 14,46 | 2,3743 | 0,6833 | |
| 0,08 | 23,03 | 3,7830 | 0,6429 | |
| 0,07 | 21,24 | 3,4883 | 0,5548 | |
| 0,14 | 25,00 | 4,1056 | 0,5484 | |
| 0,31 | 16,16 | 2,6544 | 0,4828 | |
| 0,07 | 15,80 | 2,5949 | 0,4066 | |
| 0,18 | 16,60 | 2,7265 | 0,3908 |
Största minskningarna detta kvartal
Vi använder förändringen i portföljallokeringen eftersom det är det mest meningsfulla måttet. Förändringar kan bero på transaktioner eller förändringar i aktiepriser.
| Värdepapper | Aktier (MM) |
Värde (MM$) |
Portfölj % av | ΔPortfölj % av |
|---|---|---|---|---|
| 0,00 | 0,96 | 0,1582 | −2,4643 | |
| 0,00 | 0,84 | 0,1373 | −2,2677 | |
| 0,00 | 0,37 | 0,0610 | −1,9175 | |
| 0,01 | 0,52 | 0,0846 | −1,8341 | |
| 0,01 | 0,54 | 0,0885 | −1,2669 | |
| 0,09 | 15,87 | 2,6063 | −0,2755 | |
| 0,14 | 28,30 | 4,6476 | −0,2731 | |
| 0,57 | 11,88 | 1,9513 | −0,2499 | |
| 0,00 | 0,38 | 0,0622 | −0,2340 | |
| 0,16 | 17,61 | 2,8915 | −0,2266 |
13F- och fond arkiveringar
Denna blankett lämnades in den 2025-07-08 för rapporteringsperioden 2025-06-30. Klicka på länksymbolen för att se hela transaktionshistoriken.
Uppgradera för att låsa upp premiumdata och exportera till Excel![]() .
.
| Värdepapper | Typ | Genomsnittligt aktiepris | Aktier (MM) |
ΔAktier (%) |
ΔAktier (%) |
Värde ($MM) |
Portfölj (%) |
ΔPortfölj (%) |
|
|---|---|---|---|---|---|---|---|---|---|
| META / Meta Platforms, Inc. | 0,04 | 88,99 | 28,50 | 142,03 | 4,6812 | 2,7661 | |||
| AAPL / Apple Inc. | 0,14 | 1,25 | 28,30 | −6,48 | 4,6476 | −0,2731 | |||
| GOOGL / Alphabet Inc. | 0,14 | 0,28 | 25,00 | 14,28 | 4,1056 | 0,5484 | |||
| MSFT / Microsoft Corporation | 0,05 | 0,99 | 23,50 | 33,82 | 3,8601 | 1,0041 | |||
| JPM / JPMorgan Chase & Co. | 0,08 | 0,93 | 23,03 | 19,28 | 3,7830 | 0,6429 | |||
| AXP / American Express Company | 0,07 | −0,69 | 21,24 | 17,74 | 3,4883 | 0,5548 | |||
| XOM / Exxon Mobil Corporation | 0,16 | 1,30 | 17,61 | −8,19 | 2,8915 | −0,2266 | |||
| SCHW / The Charles Schwab Corporation | 0,18 | −0,84 | 16,60 | 15,58 | 2,7265 | 0,3908 | |||
| CG / The Carlyle Group Inc. | 0,31 | 2,64 | 16,16 | 21,02 | 2,6544 | 0,4828 | |||
| ABBV / AbbVie Inc. | 0,09 | 1,08 | 15,87 | −10,45 | 2,6063 | −0,2755 | |||
| AMZN / Amazon.com, Inc. | 0,07 | 1,82 | 15,80 | 17,41 | 2,5949 | 0,4066 | |||
| AEP / American Electric Power Company, Inc. | 0,15 | 0,43 | 15,45 | −4,64 | 2,5372 | −0,0970 | |||
| LYB / LyondellBasell Industries N.V. | 0,25 | 69,15 | 14,46 | 39,03 | 2,3743 | 0,6833 | |||
| LOW / Lowe's Companies, Inc. | 0,06 | 1,62 | 14,40 | −3,33 | 2,3653 | −0,0572 | |||
| CSCO / Cisco Systems, Inc. | 0,20 | 0,54 | 13,94 | 13,04 | 2,2892 | 0,2841 | |||
| HON / Honeywell International Inc. | 0,06 | 0,48 | 13,76 | 10,51 | 2,2606 | 0,2351 | |||
| SPY / SPDR S&P 500 ETF | 0,02 | 5,36 | 13,34 | 16,37 | 2,1903 | 0,3267 | |||
| UNH / UnitedHealth Group Incorporated | 0,04 | 79,22 | 12,81 | 6,76 | 2,1039 | 0,1526 | |||
| CMI / Cummins Inc. | 0,04 | 1,66 | 12,58 | 6,22 | 2,0663 | 0,1403 | |||
| CNC / Centene Corporation | 0,22 | 0,82 | 12,17 | −9,86 | 1,9984 | −0,1965 | |||
| LHX / L3Harris Technologies, Inc. | 0,05 | 0,61 | 11,92 | 20,58 | 1,9575 | 0,3501 | |||
| IBM / International Business Machines Corporation | 0,04 | −0,19 | 11,91 | 18,34 | 1,9566 | 0,3194 | |||
| KVUE / Kenvue Inc. | 0,57 | 0,56 | 11,88 | −12,23 | 1,9513 | −0,2499 | |||
| MDT / Medtronic plc | 0,14 | 1,12 | 11,84 | −1,91 | 1,9443 | −0,0182 | |||
| MO / Altria Group, Inc. | 0,19 | −0,57 | 11,10 | −2,87 | 1,8225 | −0,0354 | |||
| PRU / Prudential Financial, Inc. | 0,10 | 0,04 | 10,62 | −3,76 | 1,7444 | −0,0502 | |||
| EPD / Enterprise Products Partners L.P. - Limited Partnership | 0,34 | −1,05 | 10,59 | −10,12 | 1,7399 | −0,1768 | |||
| EFX / Equifax Inc. | 0,03 | 0,00 | 7,45 | 6,49 | 1,2228 | 0,0859 | |||
| EOG / EOG Resources, Inc. | 0,06 | 7,40 | 1,2155 | 1,2155 | |||||
| C / Citigroup Inc. | 0,09 | 0,36 | 7,24 | 20,35 | 1,1891 | 0,2107 | |||
| AFL / Aflac Incorporated | 0,07 | 0,63 | 6,96 | −4,56 | 1,1424 | −0,0427 | |||
| T / AT&T Inc. | 0,24 | 0,10 | 6,94 | 2,44 | 1,1391 | 0,0381 | |||
| V / Visa Inc. | 0,02 | 0,02 | 6,68 | 1,32 | 1,0969 | 0,0251 | |||
| PEP / PepsiCo, Inc. | 0,05 | 3,84 | 6,62 | −8,55 | 1,0876 | −0,0900 | |||
| EFA / iShares Trust - iShares MSCI EAFE ETF | 0,07 | 0,07 | 6,43 | 9,45 | 1,0557 | 0,1007 | |||
| DIS / The Walt Disney Company | 0,05 | −0,19 | 6,28 | 25,40 | 1,0316 | 0,2171 | |||
| AMAT / Applied Materials, Inc. | 0,03 | −0,04 | 5,26 | 26,10 | 0,8635 | 0,1855 | |||
| WMT / Walmart Inc. | 0,05 | 0,25 | 4,53 | 11,66 | 0,7439 | 0,0843 | |||
| VOO / Vanguard Index Funds - Vanguard S&P 500 ETF | 0,01 | −4,98 | 4,19 | 5,02 | 0,6876 | 0,0394 | |||
| LLY / Eli Lilly and Company | 0,01 | −1,09 | 4,11 | −6,65 | 0,6757 | −0,0410 | |||
| VB / Vanguard Index Funds - Vanguard Small-Cap ETF | 0,02 | −3,43 | 4,01 | 3,19 | 0,6580 | 0,0267 | |||
| VO / Vanguard Index Funds - Vanguard Mid-Cap ETF | 0,01 | 0,00 | 3,68 | 8,19 | 0,6051 | 0,0514 | |||
| FLO / Flowers Foods, Inc. | 0,19 | −0,38 | 3,10 | −16,27 | 0,5090 | −0,0928 | |||
| KO / The Coca-Cola Company | 0,04 | 1,09 | 2,95 | −0,14 | 0,4839 | 0,0041 | |||
| EEM / iShares, Inc. - iShares MSCI Emerging Markets ETF | 0,06 | 0,00 | 2,84 | 10,39 | 0,4661 | 0,0480 | |||
| BRK.B / Berkshire Hathaway Inc. | 0,01 | 0,71 | 2,68 | −8,15 | 0,4408 | −0,0343 | |||
| CVX / Chevron Corporation | 0,02 | −8,10 | 2,56 | −21,35 | 0,4207 | −0,1089 | |||
| SO / The Southern Company | 0,03 | −0,04 | 2,35 | −0,17 | 0,3867 | 0,0032 | |||
| ADBE / Adobe Inc. | 0,01 | 485,14 | 2,13 | 490,58 | 0,3502 | 0,2915 | |||
| USB / U.S. Bancorp | 0,04 | 0,19 | 1,95 | 7,39 | 0,3200 | 0,0249 | |||
| MRK / Merck & Co., Inc. | 0,02 | 4,23 | 1,92 | −8,09 | 0,3156 | −0,0243 | |||
| QQQ / Invesco QQQ Trust, Series 1 | 0,00 | −1,14 | 1,91 | 16,28 | 0,3133 | 0,0466 | |||
| GILD / Gilead Sciences, Inc. | 0,02 | 0,02 | 1,84 | −1,02 | 0,3027 | −0,0001 | |||
| DHR / Danaher Corporation | 0,01 | 0,02 | 1,75 | −3,63 | 0,2878 | −0,0079 | |||
| GS / The Goldman Sachs Group, Inc. | 0,00 | 1,44 | 1,74 | 31,35 | 0,2864 | 0,0706 | |||
| PLTR / Palantir Technologies Inc. | 0,01 | −9,68 | 1,73 | 45,94 | 0,2834 | 0,0911 | |||
| NVDA / NVIDIA Corporation | 0,01 | −4,07 | 1,72 | 39,87 | 0,2824 | 0,0824 | |||
| BMY / Bristol-Myers Squibb Company | 0,03 | 1,73 | 1,56 | −22,78 | 0,2568 | −0,0725 | |||
| TFC / Truist Financial Corporation | 0,03 | 11,86 | 1,40 | 16,90 | 0,2307 | 0,0352 | |||
| MCD / McDonald's Corporation | 0,00 | 0,19 | 1,38 | −6,25 | 0,2267 | −0,0128 | |||
| PG / The Procter & Gamble Company | 0,01 | −4,04 | 1,38 | −10,27 | 0,2267 | −0,0235 | |||
| ICE / Intercontinental Exchange, Inc. | 0,01 | 0,56 | 1,34 | 6,95 | 0,2199 | 0,0163 | |||
| JNJ / Johnson & Johnson | 0,01 | −0,08 | 1,29 | −7,98 | 0,2123 | −0,0161 | |||
| PM / Philip Morris International Inc. | 0,01 | 0,18 | 1,24 | 14,94 | 0,2036 | 0,0282 | |||
| ADM / Archer-Daniels-Midland Company | 0,02 | 0,16 | 1,22 | 10,10 | 0,2006 | 0,0202 | |||
| CAH / Cardinal Health, Inc. | 0,01 | −2,13 | 1,11 | 19,35 | 0,1824 | 0,0311 | |||
| SWK / Stanley Black & Decker, Inc. | 0,02 | −35,70 | 1,08 | −43,35 | 0,1778 | −0,1329 | |||
| DE / Deere & Company | 0,00 | −94,49 | 0,96 | −94,03 | 0,1582 | −2,4643 | |||
| BNDX / Vanguard Charlotte Funds - Vanguard Total International Bond ETF | 0,02 | 0,00 | 0,95 | 1,39 | 0,1553 | 0,0037 | |||
| DUK / Duke Energy Corporation | 0,01 | −0,71 | 0,94 | −3,98 | 0,1545 | −0,0048 | |||
| TSLA / Tesla, Inc. | 0,00 | 11,09 | 0,94 | 36,10 | 0,1536 | 0,0419 | |||
| ORCL / Oracle Corporation | 0,00 | −16,94 | 0,91 | 30,00 | 0,1495 | 0,0355 | |||
| VMI / Valmont Industries, Inc. | 0,00 | −4,18 | 0,89 | 9,62 | 0,1461 | 0,0142 | |||
| BLK / BlackRock, Inc. | 0,00 | −94,90 | 0,84 | −94,35 | 0,1373 | −2,2677 | |||
| CAT / Caterpillar Inc. | 0,00 | −1,71 | 0,82 | 15,73 | 0,1354 | 0,0196 | |||
| PML / PIMCO Municipal Income Fund II | 0,11 | 2,12 | 0,82 | −6,05 | 0,1352 | −0,0073 | |||
| COF / Capital One Financial Corporation | 0,00 | 0,79 | 0,1302 | 0,1302 | |||||
| BAC / Bank of America Corporation | 0,02 | 4,63 | 0,78 | 18,65 | 0,1276 | 0,0211 | |||
| HOLX / Hologic, Inc. | 0,01 | −4,16 | 0,77 | 1,06 | 0,1258 | 0,0026 | |||
| NEE / NextEra Energy, Inc. | 0,01 | 0,04 | 0,75 | −1,97 | 0,1225 | −0,0013 | |||
| FI / Fiserv, Inc. | 0,00 | 0,00 | 0,67 | −21,90 | 0,1107 | −0,0297 | |||
| SYK / Stryker Corporation | 0,00 | −1,46 | 0,67 | 4,70 | 0,1098 | 0,0060 | |||
| RTX / RTX Corporation | 0,00 | 2,82 | 0,67 | 13,29 | 0,1093 | 0,0138 | |||
| FTNT / Fortinet, Inc. | 0,01 | 0,00 | 0,66 | 9,82 | 0,1085 | 0,0107 | |||
| GPN / Global Payments Inc. | 0,01 | 1,37 | 0,66 | −17,21 | 0,1083 | −0,0211 | |||
| GLD / SPDR Gold Trust | 0,00 | 0,00 | 0,66 | 5,79 | 0,1081 | 0,0069 | |||
| PSX / Phillips 66 | 0,01 | 0,09 | 0,65 | −3,26 | 0,1072 | −0,0025 | |||
| VZ / Verizon Communications Inc. | 0,01 | −51,67 | 0,64 | −53,88 | 0,1045 | −0,1199 | |||
| PFE / Pfizer Inc. | 0,03 | −0,48 | 0,63 | −4,81 | 0,1040 | −0,0042 | |||
| COST / Costco Wholesale Corporation | 0,00 | −1,58 | 0,62 | 3,01 | 0,1015 | 0,0039 | |||
| AVGO / Broadcom Inc. | 0,00 | −5,86 | 0,62 | 54,91 | 0,1011 | 0,0365 | |||
| GOOG / Alphabet Inc. | 0,00 | 6,62 | 0,61 | 20,99 | 0,1005 | 0,0183 | |||
| IVV / iShares Trust - iShares Core S&P 500 ETF | 0,00 | −0,94 | 0,59 | 9,50 | 0,0966 | 0,0092 | |||
| IWR / iShares Trust - iShares Russell Mid-Cap ETF | 0,01 | 0,00 | 0,58 | 8,18 | 0,0957 | 0,0081 | |||
| MDY / SPDR S&P MidCap 400 ETF Trust | 0,00 | 0,10 | 0,57 | 6,30 | 0,0944 | 0,0065 | |||
| IWF / iShares Trust - iShares Russell 1000 Growth ETF | 0,00 | 0,07 | 0,57 | 17,62 | 0,0943 | 0,0150 | |||
| WM / Waste Management, Inc. | 0,00 | 0,08 | 0,56 | −1,06 | 0,0918 | −0,0001 | |||
| IWB / iShares Trust - iShares Russell 1000 ETF | 0,00 | 0,25 | 0,55 | 11,02 | 0,0910 | 0,0098 | |||
| ABCB / Ameris Bancorp | 0,01 | 0,00 | 0,55 | 12,27 | 0,0903 | 0,0107 | |||
| COP / ConocoPhillips | 0,01 | −92,44 | 0,54 | −93,54 | 0,0885 | −1,2669 | |||
| CLX / The Clorox Company | 0,00 | −0,89 | 0,54 | −19,13 | 0,0883 | −0,0199 | |||
| DXCM / DexCom, Inc. | 0,01 | 1,94 | 0,53 | 30,37 | 0,0868 | 0,0208 | |||
| OZK / Bank OZK | 0,01 | 0,00 | 0,52 | 8,32 | 0,0857 | 0,0074 | |||
| MET / MetLife, Inc. | 0,01 | −95,64 | 0,52 | −95,64 | 0,0846 | −1,8341 | |||
| HD / The Home Depot, Inc. | 0,00 | 2,29 | 0,51 | 2,42 | 0,0835 | 0,0027 | |||
| MKL / Markel Group Inc. | 0,00 | 11,26 | 0,49 | 18,80 | 0,0810 | 0,0135 | |||
| VUG / Vanguard Index Funds - Vanguard Growth ETF | 0,00 | −1,17 | 0,48 | 16,83 | 0,0788 | 0,0120 | |||
| PFF / iShares Trust - iShares Preferred and Income Securities ETF | 0,02 | 8,92 | 0,48 | 8,90 | 0,0784 | 0,0070 | |||
| BIV / Vanguard Bond Index Funds - Vanguard Intermediate-Term Bond ETF | 0,01 | −2,94 | 0,47 | −1,86 | 0,0779 | −0,0008 | |||
| UNP / Union Pacific Corporation | 0,00 | −8,86 | 0,47 | −11,20 | 0,0769 | −0,0089 | |||
| MPC / Marathon Petroleum Corporation | 0,00 | 0,23 | 0,43 | 14,29 | 0,0711 | 0,0095 | |||
| SBUX / Starbucks Corporation | 0,00 | −77,74 | 0,38 | −79,24 | 0,0622 | −0,2340 | |||
| QCOM / QUALCOMM Incorporated | 0,00 | 24,95 | 0,38 | 29,55 | 0,0620 | 0,0146 | |||
| DG / Dollar General Corporation | 0,00 | −97,65 | 0,37 | −96,95 | 0,0610 | −1,9175 | |||
| BKNG / Booking Holdings Inc. | 0,00 | −3,03 | 0,37 | 21,71 | 0,0609 | 0,0114 | |||
| BP / BP p.l.c. - Depositary Receipt (Common Stock) | 0,01 | 0,06 | 0,36 | −11,46 | 0,0597 | −0,0070 | |||
| RNST / Renasant Corporation | 0,01 | 0,36 | 0,0596 | 0,0596 | |||||
| PMX / PIMCO Municipal Income Fund III | 0,05 | 0,19 | 0,36 | −4,02 | 0,0589 | −0,0019 | |||
| MMM / 3M Company | 0,00 | −0,30 | 0,36 | 3,18 | 0,0588 | 0,0025 | |||
| VGT / Vanguard World Fund - Vanguard Information Technology ETF | 0,00 | −3,27 | 0,35 | 18,46 | 0,0581 | 0,0095 | |||
| KKR / KKR & Co. Inc. | 0,00 | 0,00 | 0,35 | 14,80 | 0,0575 | 0,0080 | |||
| EIM / Eaton Vance Municipal Bond Fund | 0,04 | 14,23 | 0,35 | 10,90 | 0,0568 | 0,0060 | |||
| CL / Colgate-Palmolive Company | 0,00 | 0,00 | 0,34 | −3,14 | 0,0558 | −0,0012 | |||
| D / Dominion Energy, Inc. | 0,01 | 0,00 | 0,34 | 0,60 | 0,0555 | 0,0010 | |||
| VONV / Vanguard Scottsdale Funds - Vanguard Russell 1000 Value ETF | 0,00 | 0,49 | 0,33 | 3,77 | 0,0543 | 0,0025 | |||
| WFC / Wells Fargo & Company | 0,00 | −0,29 | 0,33 | 11,26 | 0,0537 | 0,0059 | |||
| IWM / iShares Trust - iShares Russell 2000 ETF | 0,00 | 0,14 | 0,32 | 8,56 | 0,0521 | 0,0045 | |||
| MS / Morgan Stanley | 0,00 | −10,09 | 0,31 | 8,42 | 0,0509 | 0,0045 | |||
| CMCSA / Comcast Corporation | 0,01 | −13,22 | 0,31 | −16,21 | 0,0502 | −0,0090 | |||
| GPC / Genuine Parts Company | 0,00 | 0,12 | 0,31 | 2,01 | 0,0501 | 0,0014 | |||
| EMR / Emerson Electric Co. | 0,00 | 0,18 | 0,30 | 21,90 | 0,0485 | 0,0091 | |||
| TJX / The TJX Companies, Inc. | 0,00 | 0,17 | 0,29 | 1,41 | 0,0472 | 0,0012 | |||
| ALL / The Allstate Corporation | 0,00 | −19,82 | 0,28 | −21,94 | 0,0462 | −0,0125 | |||
| IRM / Iron Mountain Incorporated | 0,00 | 0,07 | 0,28 | 18,97 | 0,0455 | 0,0077 | |||
| TSCO / Tractor Supply Company | 0,01 | −10,05 | 0,27 | −13,97 | 0,0446 | −0,0067 | |||
| GNRC / Generac Holdings Inc. | 0,00 | 1,93 | 0,24 | 15,24 | 0,0398 | 0,0056 | |||
| SNA / Snap-on Incorporated | 0,00 | 0,39 | 0,24 | −7,39 | 0,0391 | −0,0027 | |||
| GM / General Motors Company | 0,00 | 0,00 | 0,24 | 4,85 | 0,0391 | 0,0021 | |||
| NOC / Northrop Grumman Corporation | 0,00 | −0,42 | 0,24 | −2,47 | 0,0390 | −0,0007 | |||
| GIS / General Mills, Inc. | 0,00 | 0,56 | 0,23 | −13,06 | 0,0384 | −0,0052 | |||
| XLF / The Select Sector SPDR Trust - The Financial Select Sector SPDR Fund | 0,00 | 0,16 | 0,23 | 5,50 | 0,0378 | 0,0023 | |||
| FDX / FedEx Corporation | 0,00 | 9,29 | 0,23 | 2,22 | 0,0378 | 0,0011 | |||
| OKE / ONEOK, Inc. | 0,00 | 0,00 | 0,23 | −17,69 | 0,0375 | −0,0076 | |||
| VHT / Vanguard World Fund - Vanguard Health Care ETF | 0,00 | 0,00 | 0,23 | −6,25 | 0,0371 | −0,0021 | |||
| AJG / Arthur J. Gallagher & Co. | 0,00 | −6,54 | 0,22 | −13,18 | 0,0368 | −0,0053 | |||
| BK / The Bank of New York Mellon Corporation | 0,00 | 0,50 | 0,22 | 9,50 | 0,0360 | 0,0034 | |||
| VXUS / Vanguard STAR Funds - Vanguard Total International Stock ETF | 0,00 | 0,21 | 0,0342 | 0,0342 | |||||
| ABT / Abbott Laboratories | 0,00 | 0,13 | 0,21 | 2,48 | 0,0341 | 0,0012 | |||
| NFLX / Netflix, Inc. | 0,00 | 0,20 | 0,0336 | 0,0336 | |||||
| IEI / iShares Trust - iShares 3-7 Year Treasury Bond ETF | 0,00 | 0,12 | 0,20 | 0,99 | 0,0335 | 0,0006 | |||
| F / Ford Motor Company | 0,01 | 0,13 | 0,0212 | 0,0212 | |||||
| BDJ / BlackRock Enhanced Equity Dividend Trust | 0,01 | 0,55 | 0,12 | 4,39 | 0,0196 | 0,0009 | |||
| JQC / Nuveen Credit Strategies Income Fund | 0,01 | 0,00 | 0,08 | 0,00 | 0,0129 | 0,0002 | |||
| IWV / iShares Trust - iShares Russell 3000 ETF | 0,00 | −100,00 | 0,00 | 0,0000 | |||||
| BDX / Becton, Dickinson and Company | 0,00 | −100,00 | 0,00 | 0,0000 | |||||
| DFS / Discover Financial Services | 0,00 | −100,00 | 0,00 | 0,0000 | |||||
| FBMS / The First Bancshares, Inc. | 0,00 | −100,00 | 0,00 | 0,0000 | |||||
| TGT / Target Corporation | 0,00 | −100,00 | 0,00 | 0,0000 | |||||
| INTC / Intel Corporation | 0,00 | −100,00 | 0,00 | 0,0000 | |||||
| WELL / Welltower Inc. | 0,00 | −100,00 | 0,00 | 0,0000 |