Grundläggande statistik
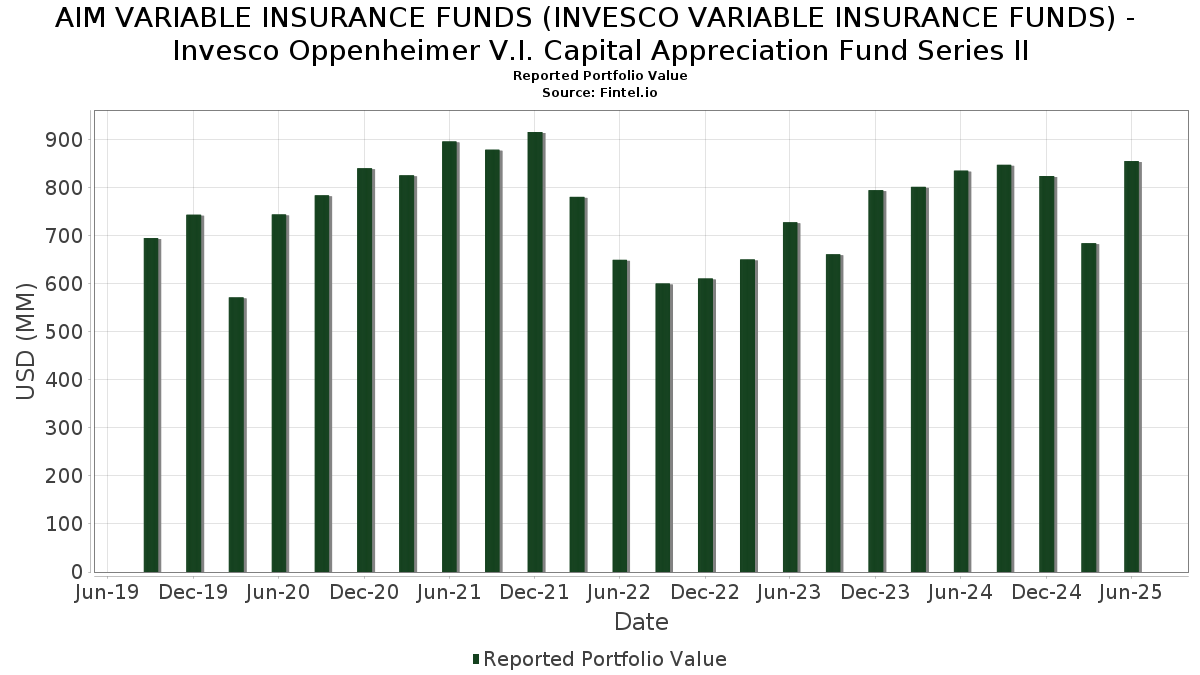
| Portföljvärde | $ 854 611 737 |
| Aktuella positioner | 62 |
Senaste innehav, resultat, förvaltat kapital (från 13F, 13D)
AIM VARIABLE INSURANCE FUNDS (INVESCO VARIABLE INSURANCE FUNDS) - Invesco Oppenheimer V.I. Capital Appreciation Fund Series II har redovisat 62 totala innehav i sina senaste SEC-arkiveringar. Det senaste portföljvärdet beräknas vara $ 854 611 737 USD. Faktiskt förvaltade tillgångar (AUM) är detta värde plus likvida medel (som inte redovisas). AIM VARIABLE INSURANCE FUNDS (INVESCO VARIABLE INSURANCE FUNDS) - Invesco Oppenheimer V.I. Capital Appreciation Fund Series IIs största innehav är NVIDIA Corporation (US:NVDA) , Microsoft Corporation (US:MSFT) , Amazon.com, Inc. (US:AMZN) , Meta Platforms, Inc. (US:META) , and Broadcom Inc. (US:AVGO) . AIM VARIABLE INSURANCE FUNDS (INVESCO VARIABLE INSURANCE FUNDS) - Invesco Oppenheimer V.I. Capital Appreciation Fund Series IIs nya positioner inkluderar Thomson Reuters Corporation (US:TRI) , Cameco Corporation (US:CCJ) , Vistra Corp. (US:VST) , Tradeweb Markets Inc. (US:TW) , and Palantir Technologies Inc. (US:PLTR) .
Största ökningarna detta kvartal
Vi använder förändringen i portföljallokeringen eftersom det är det mest meningsfulla måttet. Förändringar kan bero på transaktioner eller förändringar i aktiekurser.
| Värdepapper | Aktier (MM) |
Värde (MM$) |
Portfölj % av | ΔPortfölj % av |
|---|---|---|---|---|
| 30,39 | 30,39 | 3,7328 | 3,7328 | |
| 0,15 | 72,26 | 8,8753 | 2,4177 | |
| 0,57 | 90,14 | 11,0702 | 2,1617 | |
| 11,74 | 11,74 | 1,4418 | 1,4418 | |
| 0,05 | 9,26 | 1,1369 | 1,1369 | |
| 0,12 | 32,31 | 3,9677 | 0,8434 | |
| 0,03 | 5,58 | 0,6859 | 0,6859 | |
| 0,00 | 5,28 | 0,6484 | 0,6484 | |
| 0,02 | 5,27 | 0,6470 | 0,6470 | |
| 0,02 | 31,71 | 3,8948 | 0,6175 |
Största minskningarna detta kvartal
Vi använder förändringen i portföljallokeringen eftersom det är det mest meningsfulla måttet. Förändringar kan bero på transaktioner eller förändringar i aktiepriser.
| Värdepapper | Aktier (MM) |
Värde (MM$) |
Portfölj % av | ΔPortfölj % av |
|---|---|---|---|---|
| 0,13 | 27,20 | 3,3403 | −2,1097 | |
| 0,06 | 7,39 | 0,9071 | −1,1338 | |
| 0,25 | 54,81 | 6,7320 | −1,0552 | |
| 0,03 | 4,30 | 0,5283 | −0,6637 | |
| 0,05 | 6,13 | 0,7524 | −0,6478 | |
| 6,13 | 6,13 | 0,7533 | −0,5675 | |
| 0,01 | 6,18 | 0,7588 | −0,5331 | |
| 0,18 | 19,80 | 2,4312 | −0,5152 | |
| 0,01 | 4,30 | 0,5279 | −0,4568 | |
| 0,02 | 4,05 | 0,4979 | −0,4214 |
13F- och fond arkiveringar
Denna blankett lämnades in den 2025-08-27 för rapporteringsperioden 2025-06-30. Klicka på länksymbolen för att se hela transaktionshistoriken.
Uppgradera för att låsa upp premiumdata och exportera till Excel![]() .
.
| Värdepapper | Typ | Genomsnittligt aktiepris | Aktier (MM) |
ΔAktier (%) |
ΔAktier (%) |
Värde ($MM) |
Portfölj (%) |
ΔPortfölj (%) |
|
|---|---|---|---|---|---|---|---|---|---|
| NVDA / NVIDIA Corporation | 0,57 | 3,01 | 90,14 | 50,15 | 11,0702 | 2,1617 | |||
| MSFT / Microsoft Corporation | 0,15 | 25,34 | 72,26 | 66,08 | 8,8753 | 2,4177 | |||
| AMZN / Amazon.com, Inc. | 0,25 | −9,41 | 54,81 | 4,46 | 6,7320 | −1,0552 | |||
| META / Meta Platforms, Inc. | 0,07 | 0,00 | 51,00 | 28,06 | 6,2636 | 0,3534 | |||
| AVGO / Broadcom Inc. | 0,12 | −6,79 | 32,31 | 53,46 | 3,9677 | 0,8434 | |||
| NFLX / Netflix, Inc. | 0,02 | 0,00 | 31,71 | 43,60 | 3,8948 | 0,6175 | |||
| Invesco Private Prime Fund / STIV (N/A) | 30,39 | 30,39 | 3,7328 | 3,7328 | |||||
| AAPL / Apple Inc. | 0,13 | −19,82 | 27,20 | −25,94 | 3,3403 | −2,1097 | |||
| GOOG / Alphabet Inc. | 0,13 | −5,64 | 23,86 | 7,15 | 2,9298 | −0,3744 | |||
| BSX / Boston Scientific Corporation | 0,18 | −6,36 | 19,80 | −0,29 | 2,4312 | −0,5152 | |||
| MA / Mastercard Incorporated | 0,03 | 0,00 | 15,54 | 2,53 | 1,9082 | −0,3409 | |||
| NOW / ServiceNow, Inc. | 0,01 | 0,00 | 15,13 | 29,14 | 1,8576 | 0,1194 | |||
| TSLA / Tesla, Inc. | 0,04 | 0,00 | 14,01 | 22,58 | 1,7205 | 0,0244 | |||
| SPOT / Spotify Technology S.A. | 0,02 | 0,00 | 13,10 | 39,51 | 1,6093 | 0,2154 | |||
| PWR / Quanta Services, Inc. | 0,03 | 0,00 | 12,61 | 48,75 | 1,5485 | 0,2906 | |||
| GEV / GE Vernova Inc. | 0,02 | 0,00 | 12,18 | 73,34 | 1,4956 | 0,4530 | |||
| COST / Costco Wholesale Corporation | 0,01 | 41,18 | 12,16 | 47,77 | 1,4935 | 0,2722 | |||
| GE / General Electric Company | 0,05 | 33,24 | 11,78 | 71,35 | 1,4469 | 0,4265 | |||
| Invesco Private Government Fund / STIV (N/A) | 11,74 | 11,74 | 1,4418 | 1,4418 | |||||
| DASH / DoorDash, Inc. | 0,05 | −14,49 | 11,64 | 15,35 | 1,4290 | −0,0681 | |||
| PGR / The Progressive Corporation | 0,04 | 3,36 | 11,57 | −2,54 | 1,4204 | −0,3407 | |||
| APP / AppLovin Corporation | 0,03 | 0,00 | 11,51 | 32,11 | 1,4134 | 0,1207 | |||
| V / Visa Inc. | 0,03 | 34,31 | 11,49 | 36,07 | 1,4109 | 0,1580 | |||
| AXON / Axon Enterprise, Inc. | 0,01 | 0,00 | 11,42 | 57,43 | 1,4029 | 0,3260 | |||
| COR / Cencora, Inc. | 0,04 | 89,83 | 11,00 | 104,69 | 1,3505 | 0,5532 | |||
| SNOW / Snowflake Inc. | 0,05 | −8,64 | 10,60 | 39,88 | 1,3019 | 0,1772 | |||
| HWM / Howmet Aerospace Inc. | 0,06 | 0,00 | 10,34 | 43,49 | 1,2699 | 0,2004 | |||
| ANET / Arista Networks Inc | 0,09 | −10,21 | 9,65 | 18,57 | 1,1850 | −0,0227 | |||
| NET / Cloudflare, Inc. | 0,05 | 9,26 | 1,1369 | 1,1369 | |||||
| GS / The Goldman Sachs Group, Inc. | 0,01 | −5,22 | 8,80 | 22,80 | 1,0812 | 0,0172 | |||
| TSM / Taiwan Semiconductor Manufacturing Company Limited - Depositary Receipt (Common Stock) | 0,04 | −6,84 | 8,71 | 27,12 | 1,0701 | 0,0528 | |||
| MCHP / Microchip Technology Incorporated | 0,11 | 47,30 | 8,01 | 13,29 | 0,9841 | 0,1063 | |||
| VRT / Vertiv Holdings Co | 0,06 | 1,03 | 7,98 | 79,69 | 0,9801 | 0,3210 | |||
| MPWR / Monolithic Power Systems, Inc. | 0,01 | −16,51 | 7,89 | 5,29 | 0,9687 | −0,1431 | |||
| MELI / MercadoLibre, Inc. | 0,00 | 17,54 | 7,79 | 57,47 | 0,9572 | 0,2227 | |||
| TTWO / Take-Two Interactive Software, Inc. | 0,03 | 91,90 | 7,69 | 124,89 | 0,9444 | 0,4369 | |||
| AXP / American Express Company | 0,02 | 22,53 | 7,58 | 45,28 | 0,9309 | 0,1566 | |||
| WELL / Welltower Inc. | 0,05 | 17,60 | 7,45 | 17,99 | 0,9145 | −0,0220 | |||
| AZO / AutoZone, Inc. | 0,00 | 116,94 | 7,42 | 111,25 | 0,9109 | 0,3898 | |||
| KKR / KKR & Co. Inc. | 0,06 | −53,33 | 7,39 | −46,29 | 0,9071 | −1,1338 | |||
| RCL / Royal Caribbean Cruises Ltd. | 0,02 | −3,06 | 6,97 | 47,76 | 0,8557 | 0,1559 | |||
| CHKP / Check Point Software Technologies Ltd. | 0,03 | 22,32 | 6,22 | 18,73 | 0,7645 | −0,0135 | |||
| ISRG / Intuitive Surgical, Inc. | 0,01 | −35,31 | 6,18 | −29,03 | 0,7588 | −0,5331 | |||
| US8252524066 / Invesco Treasury Portfolio, Institutional Class | 6,13 | −31,08 | 6,13 | −31,09 | 0,7533 | −0,5675 | |||
| TJX / The TJX Companies, Inc. | 0,05 | −35,95 | 6,13 | −35,06 | 0,7524 | −0,6478 | |||
| RSG / Republic Services, Inc. | 0,02 | 53,86 | 6,02 | 56,70 | 0,7393 | 0,1692 | |||
| LLY / Eli Lilly and Company | 0,01 | −17,19 | 5,99 | −21,84 | 0,7353 | −0,4014 | |||
| TRI / Thomson Reuters Corporation | 0,03 | 5,58 | 0,6859 | 0,6859 | |||||
| BLK / BlackRock, Inc. | 0,01 | −26,87 | 5,29 | −18,93 | 0,6496 | −0,3186 | |||
| BKNG / Booking Holdings Inc. | 0,00 | 5,28 | 0,6484 | 0,6484 | |||||
| CVNA / Carvana Co. | 0,02 | 5,27 | 0,6470 | 0,6470 | |||||
| CCJ / Cameco Corporation | 0,06 | 4,73 | 0,5808 | 0,5808 | |||||
| VST / Vistra Corp. | 0,02 | 4,56 | 0,5596 | 0,5596 | |||||
| CBRE / CBRE Group, Inc. | 0,03 | −50,02 | 4,30 | −46,45 | 0,5283 | −0,6637 | |||
| CRWD / CrowdStrike Holdings, Inc. | 0,01 | −75,42 | 4,30 | −24,02 | 0,5279 | −0,4568 | |||
| IOT / Samsara Inc. | 0,10 | −8,09 | 4,08 | −4,61 | 0,5010 | −0,1336 | |||
| ARES / Ares Management Corporation | 0,02 | −44,60 | 4,05 | −34,55 | 0,4979 | −0,4214 | |||
| RACE / Ferrari N.V. | 0,01 | 0,00 | 3,69 | 14,69 | 0,4536 | −0,0243 | |||
| ABBV / AbbVie Inc. | 0,02 | 8,40 | 3,35 | −3,95 | 0,4117 | −0,1063 | |||
| US8252528851 / Invesco Government & Agency Portfolio, Institutional Class | 3,30 | −31,08 | 3,30 | −31,09 | 0,4056 | −0,3056 | |||
| TW / Tradeweb Markets Inc. | 0,02 | 3,20 | 0,3925 | 0,3925 | |||||
| PLTR / Palantir Technologies Inc. | 0,02 | 3,11 | 0,3815 | 0,3815 |