Grundläggande statistik
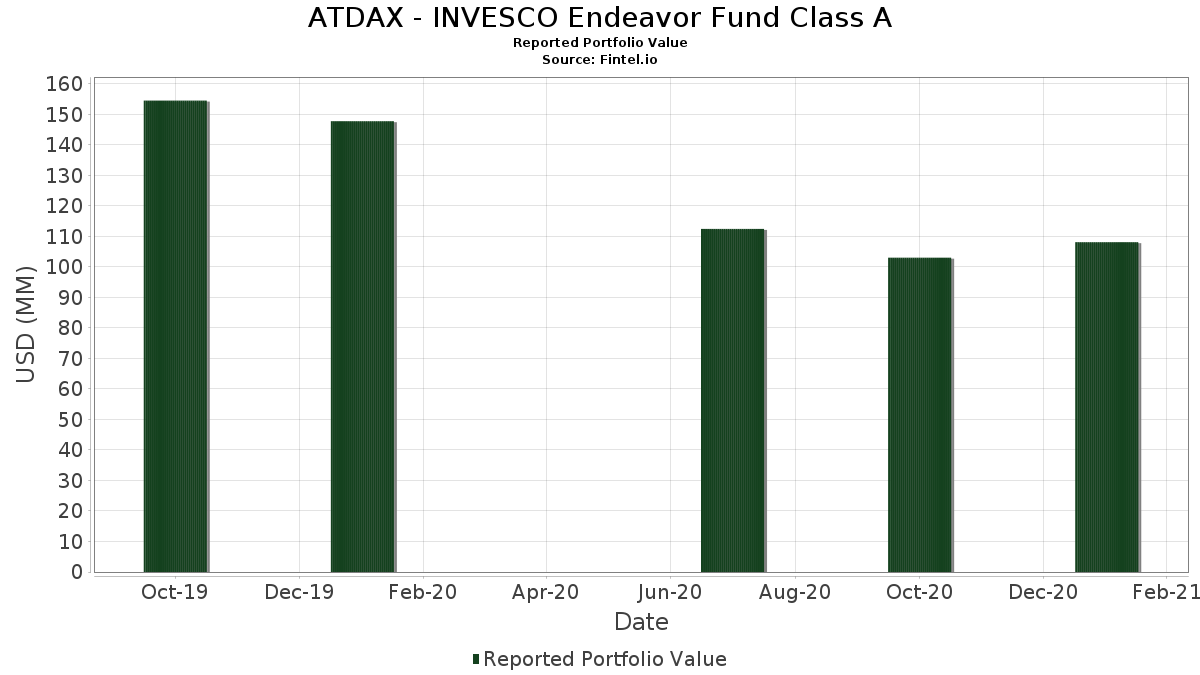
| Portföljvärde | $ 108 104 926 |
| Aktuella positioner | 82 |
Senaste innehav, resultat, förvaltat kapital (från 13F, 13D)
ATDAX - INVESCO Endeavor Fund Class A har redovisat 82 totala innehav i sina senaste SEC-arkiveringar. Det senaste portföljvärdet beräknas vara $ 108 104 926 USD. Faktiskt förvaltade tillgångar (AUM) är detta värde plus likvida medel (som inte redovisas). ATDAX - INVESCO Endeavor Fund Class As största innehav är Keysight Technologies, Inc. (US:KEYS) , Fiserv, Inc. (US:FISV) , Synopsys, Inc. (US:SNPS) , CACI International Inc (US:CACI) , and Stanley Black & Decker, Inc. (US:SWK) . ATDAX - INVESCO Endeavor Fund Class As nya positioner inkluderar Eastman Chemical Company (US:EMN) , O'Reilly Automotive, Inc. (US:ORLY) , Rockwell Automation, Inc. (US:ROK) , KBR, Inc. (US:KBR) , and Raymond James Financial, Inc. (US:RJF) .
Största ökningarna detta kvartal
Vi använder förändringen i portföljallokeringen eftersom det är det mest meningsfulla måttet. Förändringar kan bero på transaktioner eller förändringar i aktiekurser.
| Värdepapper | Aktier (MM) |
Värde (MM$) |
Portfölj % av | ΔPortfölj % av |
|---|---|---|---|---|
| 0,02 | 1,68 | 1,5449 | 1,5449 | |
| 0,00 | 1,68 | 1,5445 | 1,5445 | |
| 0,01 | 1,47 | 1,3494 | 1,3494 | |
| 0,05 | 1,42 | 1,3053 | 1,3053 | |
| 0,01 | 1,35 | 1,2377 | 1,2377 | |
| 0,03 | 1,33 | 1,2251 | 1,2251 | |
| 0,02 | 1,26 | 1,1632 | 1,1632 | |
| 0,00 | 1,15 | 1,0552 | 1,0552 | |
| 0,01 | 0,98 | 0,9013 | 0,9013 | |
| 0,04 | 0,95 | 0,8785 | 0,8785 |
Största minskningarna detta kvartal
Vi använder förändringen i portföljallokeringen eftersom det är det mest meningsfulla måttet. Förändringar kan bero på transaktioner eller förändringar i aktiepriser.
| Värdepapper | Aktier (MM) |
Värde (MM$) |
Portfölj % av | ΔPortfölj % av |
|---|---|---|---|---|
| 0,00 | 0,00 | −3,1065 | ||
| 0,00 | 0,00 | −2,3513 | ||
| 0,00 | 0,00 | −2,2252 | ||
| 0,00 | 0,00 | −1,8156 | ||
| 0,00 | 0,00 | −1,4635 | ||
| 0,00 | 0,00 | −1,4487 | ||
| 0,00 | 0,00 | −0,9666 | ||
| 0,01 | 1,04 | 0,9527 | −0,8145 | |
| 0,00 | 0,86 | 0,7912 | −0,6659 | |
| 0,02 | 1,85 | 1,7016 | −0,6089 |
13F- och fond arkiveringar
Denna blankett lämnades in den 2021-04-01 för rapporteringsperioden 2021-01-31. Klicka på länksymbolen för att se hela transaktionshistoriken.
Uppgradera för att låsa upp premiumdata och exportera till Excel![]() .
.
| Värdepapper | Typ | Genomsnittligt aktiepris | Aktier (MM) |
ΔAktier (%) |
ΔAktier (%) |
Värde ($MM) |
Portfölj (%) |
ΔPortfölj (%) |
|
|---|---|---|---|---|---|---|---|---|---|
| KEYS / Keysight Technologies, Inc. | 0,02 | −3,72 | 3,00 | 29,99 | 2,7637 | 0,5081 | |||
| FISV / Fiserv, Inc. | 0,03 | 4,93 | 2,63 | 12,85 | 2,4165 | 0,1451 | |||
| SNPS / Synopsys, Inc. | 0,01 | 4,33 | 2,43 | 24,62 | 2,2360 | 0,3325 | |||
| CACI / CACI International Inc | 0,01 | 7,09 | 2,42 | 23,87 | 2,2252 | 0,3195 | |||
| SWK / Stanley Black & Decker, Inc. | 0,01 | 38,87 | 2,35 | 44,95 | 2,1660 | 0,5808 | |||
| ARE / Alexandria Real Estate Equities, Inc. | 0,01 | 5,80 | 2,26 | 16,68 | 2,0792 | 0,1887 | |||
| LAMR / Lamar Advertising Company | 0,03 | 6,83 | 2,20 | 39,30 | 2,0254 | 0,4827 | |||
| LBRDK / Liberty Broadband Corporation | 0,01 | −1,92 | 2,09 | 1,07 | 1,9192 | −0,0951 | |||
| PNC / The PNC Financial Services Group, Inc. | 0,01 | 7,42 | 2,03 | 37,80 | 1,8715 | 0,4306 | |||
| TT / Trane Technologies plc | 0,01 | 4,73 | 2,02 | 13,10 | 1,8588 | 0,1151 | |||
| CTLT / Catalent, Inc. | 0,02 | 5,08 | 1,99 | 37,82 | 1,8272 | 0,4199 | |||
| KLAC / KLA Corporation | 0,01 | −9,45 | 1,87 | 28,62 | 1,7162 | 0,3006 | |||
| RSG / Republic Services, Inc. | 0,02 | −23,90 | 1,85 | −21,88 | 1,7016 | −0,6089 | |||
| LHCG / LHC Group Inc | 0,01 | 18,59 | 1,85 | 9,15 | 1,7011 | 0,0469 | |||
| STZ / Constellation Brands, Inc. | 0,01 | 4,85 | 1,84 | 33,82 | 1,6899 | 0,3505 | |||
| TFX / Teleflex Incorporated | 0,00 | 5,68 | 1,82 | 25,36 | 1,6741 | 0,2578 | |||
| AJG / Arthur J. Gallagher & Co. | 0,02 | 4,42 | 1,78 | 16,21 | 1,6357 | 0,1423 | |||
| VMC / Vulcan Materials Company | 0,01 | 4,88 | 1,77 | 8,01 | 1,6261 | 0,0286 | |||
| MKSI / MKS Inc. | 0,01 | −7,21 | 1,72 | 35,35 | 1,5856 | 0,3425 | |||
| ADI / Analog Devices, Inc. | 0,01 | 4,91 | 1,71 | 30,43 | 1,5697 | 0,2926 | |||
| KMX / CarMax, Inc. | 0,01 | −27,13 | 1,70 | −0,76 | 1,5629 | −0,1071 | |||
| MANH / Manhattan Associates, Inc. | 0,01 | 5,17 | 1,68 | 39,22 | 1,5455 | 0,3683 | |||
| EMN / Eastman Chemical Company | 0,02 | 1,68 | 1,5449 | 1,5449 | |||||
| ORLY / O'Reilly Automotive, Inc. | 0,00 | 1,68 | 1,5445 | 1,5445 | |||||
| MMP / Magellan Midstream Partners L.P. | 0,04 | 6,75 | 1,65 | 33,52 | 1,5141 | 0,3113 | |||
| ZNGA / Zynga Inc - Class A | 0,16 | 1,85 | 1,62 | 12,27 | 1,4906 | 0,0820 | |||
| HCA / HCA Healthcare, Inc. | 0,01 | −21,43 | 1,52 | 2,99 | 1,3948 | −0,0418 | |||
| HRC / Hill-Rom Holdings Inc | 0,02 | 4,95 | 1,49 | 10,67 | 1,3744 | 0,0569 | |||
| ITT / ITT Inc. | 0,02 | 9,35 | 1,48 | 35,07 | 1,3569 | 0,2907 | |||
| ROK / Rockwell Automation, Inc. | 0,01 | 1,47 | 1,3494 | 1,3494 | |||||
| BJ / BJ's Wholesale Club Holdings, Inc. | 0,03 | −13,73 | 1,46 | −5,21 | 1,3399 | −0,1598 | |||
| VC / Visteon Corporation | 0,01 | −34,13 | 1,43 | −6,34 | 1,3195 | −0,1751 | |||
| CMS / CMS Energy Corporation | 0,03 | 23,44 | 1,43 | 10,87 | 1,3144 | 0,0566 | |||
| ICE / Intercontinental Exchange, Inc. | 0,01 | −6,90 | 1,42 | 8,87 | 1,3104 | 0,0331 | |||
| KBR / KBR, Inc. | 0,05 | 1,42 | 1,3053 | 1,3053 | |||||
| ROST / Ross Stores, Inc. | 0,01 | −28,29 | 1,40 | −6,30 | 1,2854 | −0,1700 | |||
| RJF / Raymond James Financial, Inc. | 0,01 | 1,35 | 1,2377 | 1,2377 | |||||
| DRE / Duke Realty Corporation - Preferred Security | 0,03 | 1,33 | 1,2251 | 1,2251 | |||||
| SIVB / SVB Financial Group | 0,00 | −46,71 | 1,29 | −19,73 | 1,1832 | −0,3809 | |||
| XS2181577268 / Silgan Holdings Inc | 0,03 | 6,07 | 1,27 | 12,20 | 1,1681 | 0,0633 | |||
| PEG / Public Service Enterprise Group Incorporated | 0,02 | −8,01 | 1,27 | −10,77 | 1,1661 | −0,2198 | |||
| VLO / Valero Energy Corporation | 0,02 | −9,10 | 1,27 | 32,81 | 1,1661 | 0,2349 | |||
| EWBC / East West Bancorp, Inc. | 0,02 | 1,26 | 1,1632 | 1,1632 | |||||
| AQUA / Evoqua Water Technologies Corp | 0,05 | 5,18 | 1,26 | 25,02 | 1,1586 | 0,1752 | |||
| TW / Tradeweb Markets Inc. | 0,02 | 6,99 | 1,26 | 19,41 | 1,1546 | 0,1285 | |||
| US02666AAA60 / American Homes 4 Rent 2015-SFR1 | 0,04 | 5,75 | 1,25 | 13,15 | 1,1482 | 0,0710 | |||
| HUBB / Hubbell Incorporated | 0,01 | 16,84 | 1,22 | 25,00 | 1,1181 | 0,1687 | |||
| BSX / Boston Scientific Corporation | 0,03 | 3,29 | 1,21 | 6,83 | 1,1091 | 0,0075 | |||
| ATO / Atmos Energy Corporation | 0,01 | 40,50 | 1,18 | 36,38 | 1,0833 | 0,2408 | |||
| HUM / Humana Inc. | 0,00 | 1,15 | 1,0552 | 1,0552 | |||||
| SGEN / Seagen Inc | 0,01 | 3,15 | 1,11 | 1,65 | 1,0230 | −0,0453 | |||
| DHI / D.R. Horton, Inc. | 0,01 | 4,20 | 1,08 | 19,78 | 0,9973 | 0,1140 | |||
| FAST / Fastenal Company | 0,02 | −12,37 | 1,08 | −7,56 | 0,9900 | −0,1465 | |||
| NTRS / Northern Trust Corporation | 0,01 | −49,81 | 1,04 | −42,82 | 0,9527 | −0,8145 | |||
| TSCO / Tractor Supply Company | 0,01 | 2,85 | 1,01 | 9,51 | 0,9319 | 0,0285 | |||
| KFY / Korn Ferry | 0,02 | −9,14 | 1,00 | 37,19 | 0,9167 | 0,2080 | |||
| DOX / Amdocs Limited | 0,01 | 0,98 | 0,9013 | 0,9013 | |||||
| SNAP / Snap Inc. | 0,02 | −9,97 | 0,97 | 21,05 | 0,8949 | 0,1103 | |||
| SWX / Southwest Gas Holdings, Inc. | 0,02 | 7,55 | 0,97 | −1,93 | 0,8912 | −0,0724 | |||
| CAG / Conagra Brands, Inc. | 0,03 | −23,73 | 0,96 | −24,77 | 0,8863 | −0,3639 | |||
| DG / Dollar General Corporation | 0,00 | 0,00 | 0,96 | −6,71 | 0,8824 | −0,1216 | |||
| SLB / Schlumberger Limited | 0,04 | 0,95 | 0,8785 | 0,8785 | |||||
| SHLX / Shell Midstream Partners L.P. - Unit | 0,08 | 0,94 | 0,8623 | 0,8623 | |||||
| ES / Eversource Energy | 0,01 | −2,67 | 0,93 | −2,42 | 0,8551 | −0,0745 | |||
| ASGN / ASGN Incorporated | 0,01 | 0,89 | 0,8150 | 0,8150 | |||||
| WBA / Walgreens Boots Alliance, Inc. | 0,02 | 0,88 | 0,8114 | 0,8114 | |||||
| MSI / Motorola Solutions, Inc. | 0,01 | −31,19 | 0,88 | −27,05 | 0,8090 | −0,3676 | |||
| STE / STERIS plc | 0,00 | 4,78 | 0,86 | 10,63 | 0,7954 | 0,0328 | |||
| CP / Canadian Pacific Kansas City Limited | 0,00 | −48,75 | 0,86 | −42,36 | 0,7912 | −0,6659 | |||
| PCTY / Paylocity Holding Corporation | 0,00 | 0,82 | 0,7520 | 0,7520 | |||||
| RKT / Rocket Companies, Inc. | 0,04 | 5,41 | 0,77 | 23,63 | 0,7076 | 0,0998 | |||
| ABNB / Airbnb, Inc. | 0,00 | 0,76 | 0,6978 | 0,6978 | |||||
| QTWO / Q2 Holdings, Inc. | 0,01 | 0,72 | 0,6630 | 0,6630 | |||||
| WEN / The Wendy's Company | 0,03 | −20,24 | 0,69 | −25,57 | 0,6353 | −0,2697 | |||
| EQIX / Equinix, Inc. | 0,00 | 0,64 | 0,5922 | 0,5922 | |||||
| GH / Guardant Health, Inc. | 0,00 | 0,56 | 0,5123 | 0,5123 | |||||
| FNV / Franco-Nevada Corporation | 0,00 | 18,00 | 0,55 | 3,21 | 0,5036 | −0,0145 | |||
| CRI / Carter's, Inc. | 0,00 | 0,33 | 0,2995 | 0,2995 | |||||
| US8252524066 / Invesco Treasury Portfolio, Institutional Class | 0,08 | −87,28 | 0,08 | −87,38 | 0,0724 | −0,5313 | |||
| US8252528851 / Invesco Government & Agency Portfolio, Institutional Class | 0,07 | −87,28 | 0,07 | −87,43 | 0,0633 | −0,4648 | |||
| US8252527291 / Invesco Liquid Assets Portfolio, Institutional Class | 0,05 | −87,28 | 0,05 | −87,31 | 0,0452 | −0,3320 | |||
| SAFM / Sanderson Farms, Inc. | 0,00 | 0,04 | 0,0401 | 0,0401 | |||||
| DE / Deere & Company | 0,00 | −100,00 | 0,00 | −100,00 | −1,4635 | ||||
| CTSH / Cognizant Technology Solutions Corporation | 0,00 | −100,00 | 0,00 | −100,00 | −3,1065 | ||||
| ZBH / Zimmer Biomet Holdings, Inc. | 0,00 | −100,00 | 0,00 | −100,00 | −1,4487 | ||||
| AMG / Affiliated Managers Group, Inc. | 0,00 | −100,00 | 0,00 | −100,00 | −1,8156 | ||||
| LHX / L3Harris Technologies, Inc. | 0,00 | −100,00 | 0,00 | −100,00 | −2,2252 | ||||
| AZO / AutoZone, Inc. | 0,00 | −100,00 | 0,00 | −100,00 | −2,3513 | ||||
| PLD / Prologis, Inc. | 0,00 | −100,00 | 0,00 | −100,00 | −0,9666 |