Grundläggande statistik
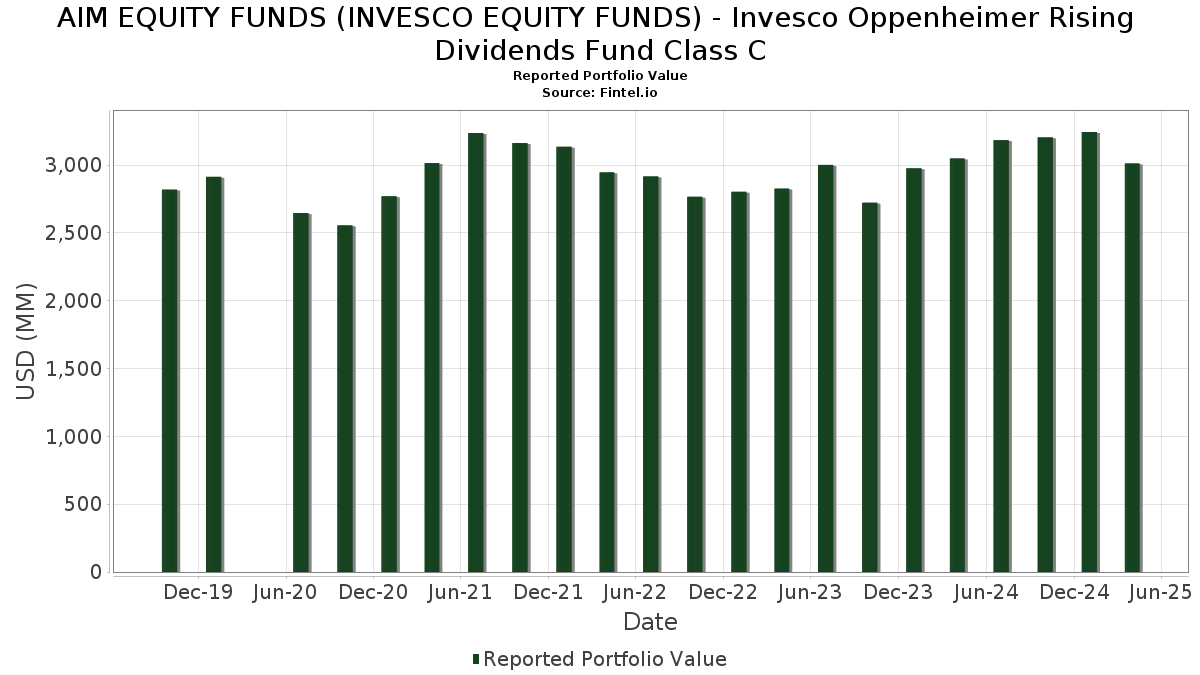
| Portföljvärde | $ 3 012 084 467 |
| Aktuella positioner | 76 |
Senaste innehav, resultat, förvaltat kapital (från 13F, 13D)
AIM EQUITY FUNDS (INVESCO EQUITY FUNDS) - Invesco Oppenheimer Rising Dividends Fund Class C har redovisat 76 totala innehav i sina senaste SEC-arkiveringar. Det senaste portföljvärdet beräknas vara $ 3 012 084 467 USD. Faktiskt förvaltade tillgångar (AUM) är detta värde plus likvida medel (som inte redovisas). AIM EQUITY FUNDS (INVESCO EQUITY FUNDS) - Invesco Oppenheimer Rising Dividends Fund Class Cs största innehav är Microsoft Corporation (US:MSFT) , Apple Inc. (US:AAPL) , NVIDIA Corporation (US:NVDA) , JPMorgan Chase & Co. (US:JPM) , and Walmart Inc. (US:WMT) . AIM EQUITY FUNDS (INVESCO EQUITY FUNDS) - Invesco Oppenheimer Rising Dividends Fund Class Cs nya positioner inkluderar Cboe Global Markets, Inc. (US:CBOE) , Bristol-Myers Squibb Company (US:BMY) , Constellation Energy Corporation (US:CEG) , CVS Health Corporation (US:CVS) , and Keurig Dr Pepper Inc. (US:KDP) .
Största ökningarna detta kvartal
Vi använder förändringen i portföljallokeringen eftersom det är det mest meningsfulla måttet. Förändringar kan bero på transaktioner eller förändringar i aktiekurser.
| Värdepapper | Aktier (MM) |
Värde (MM$) |
Portfölj % av | ΔPortfölj % av |
|---|---|---|---|---|
| 0,13 | 29,25 | 0,9775 | 0,9775 | |
| 0,49 | 24,75 | 0,8270 | 0,8270 | |
| 0,36 | 61,78 | 2,0644 | 0,6192 | |
| 0,08 | 18,48 | 0,6175 | 0,6175 | |
| 17,27 | 17,27 | 0,5771 | 0,5771 | |
| 0,26 | 17,15 | 0,5732 | 0,5732 | |
| 0,40 | 65,76 | 2,1975 | 0,5065 | |
| 0,42 | 14,48 | 0,4840 | 0,4840 | |
| 0,41 | 29,24 | 0,9769 | 0,4683 | |
| 0,60 | 34,36 | 1,1482 | 0,4107 |
Största minskningarna detta kvartal
Vi använder förändringen i portföljallokeringen eftersom det är det mest meningsfulla måttet. Förändringar kan bero på transaktioner eller förändringar i aktiepriser.
| Värdepapper | Aktier (MM) |
Värde (MM$) |
Portfölj % av | ΔPortfölj % av |
|---|---|---|---|---|
| 0,00 | 0,00 | −0,9749 | ||
| 0,15 | 41,38 | 1,3828 | −0,6779 | |
| 0,11 | 61,66 | 2,0603 | −0,6425 | |
| 0,03 | 18,90 | 0,6314 | −0,4983 | |
| 0,00 | 0,00 | −0,4981 | ||
| 0,12 | 51,17 | 1,7099 | −0,3673 | |
| 0,31 | 32,32 | 1,0800 | −0,3672 | |
| 0,36 | 57,31 | 1,9150 | −0,3518 | |
| 0,06 | 23,49 | 0,7848 | −0,2700 | |
| 1,04 | 113,05 | 3,7777 | −0,2571 |
13F- och fond arkiveringar
Denna blankett lämnades in den 2025-06-30 för rapporteringsperioden 2025-04-30. Klicka på länksymbolen för att se hela transaktionshistoriken.
Uppgradera för att låsa upp premiumdata och exportera till Excel![]() .
.
| Värdepapper | Typ | Genomsnittligt aktiepris | Aktier (MM) |
ΔAktier (%) |
ΔAktier (%) |
Värde ($MM) |
Portfölj (%) |
ΔPortfölj (%) |
|
|---|---|---|---|---|---|---|---|---|---|
| MSFT / Microsoft Corporation | 0,53 | −2,82 | 209,51 | −7,46 | 7,0008 | 0,0306 | |||
| AAPL / Apple Inc. | 0,68 | 0,00 | 143,87 | −9,96 | 4,8075 | −0,1118 | |||
| NVDA / NVIDIA Corporation | 1,04 | −4,90 | 113,05 | −13,73 | 3,7777 | −0,2571 | |||
| JPM / JPMorgan Chase & Co. | 0,34 | 0,00 | 84,15 | −8,48 | 2,8118 | −0,0191 | |||
| WMT / Walmart Inc. | 0,74 | −7,96 | 71,78 | −8,81 | 2,3985 | −0,0250 | |||
| AVGO / Broadcom Inc. | 0,36 | 0,00 | 69,84 | −13,02 | 2,3336 | −0,1382 | |||
| V / Visa Inc. | 0,20 | 0,00 | 67,60 | 1,08 | 2,2587 | 0,1999 | |||
| PG / The Procter & Gamble Company | 0,40 | 22,26 | 65,76 | 19,74 | 2,1975 | 0,5065 | |||
| PM / Philip Morris International Inc. | 0,36 | 0,00 | 61,78 | 31,61 | 2,0644 | 0,6192 | |||
| META / Meta Platforms, Inc. | 0,11 | −11,83 | 61,66 | −29,76 | 2,0603 | −0,6425 | |||
| GOOGL / Alphabet Inc. | 0,36 | 0,00 | 57,31 | −22,17 | 1,9150 | −0,3518 | |||
| LLY / Eli Lilly and Company | 0,06 | −19,27 | 57,01 | −10,53 | 1,9051 | −0,0567 | |||
| MCD / McDonald's Corporation | 0,18 | −9,36 | 56,87 | 0,36 | 1,9003 | 0,1557 | |||
| AIG / American International Group, Inc. | 0,63 | 0,00 | 51,59 | 10,67 | 1,7237 | 0,2887 | |||
| UNH / UnitedHealth Group Incorporated | 0,12 | 0,00 | 51,17 | −24,16 | 1,7099 | −0,3673 | |||
| LOW / Lowe's Companies, Inc. | 0,23 | 13,39 | 50,63 | −2,52 | 1,6916 | 0,0928 | |||
| UNP / Union Pacific Corporation | 0,21 | 0,00 | 45,03 | −12,97 | 1,5048 | −0,0882 | |||
| CRM / Salesforce, Inc. | 0,15 | −21,38 | 41,38 | −38,17 | 1,3828 | −0,6779 | |||
| COP / ConocoPhillips | 0,46 | 0,00 | 41,06 | −9,82 | 1,3719 | −0,0298 | |||
| PLD / Prologis, Inc. | 0,40 | 0,00 | 41,03 | −14,30 | 1,3711 | −0,1029 | |||
| BLK / BlackRock, Inc. | 0,04 | 0,00 | 40,89 | −14,99 | 1,3664 | −0,1146 | |||
| PPL / PPL Corporation | 1,11 | 0,00 | 40,49 | 8,63 | 1,3531 | 0,2055 | |||
| SCHW / The Charles Schwab Corporation | 0,50 | 0,00 | 40,34 | −1,60 | 1,3479 | 0,0859 | |||
| MMC / Marsh & McLennan Companies, Inc. | 0,18 | 16,75 | 39,98 | 21,37 | 1,3360 | 0,3218 | |||
| AMT / American Tower Corporation | 0,17 | 0,00 | 38,39 | 21,88 | 1,2826 | 0,3130 | |||
| CVX / Chevron Corporation | 0,28 | 0,00 | 38,34 | −8,80 | 1,2811 | −0,0132 | |||
| PH / Parker-Hannifin Corporation | 0,06 | 0,00 | 37,21 | −14,43 | 1,2435 | −0,0953 | |||
| INTU / Intuit Inc. | 0,06 | 20,80 | 36,91 | 26,01 | 1,2332 | 0,3315 | |||
| ACN / Accenture plc | 0,12 | 0,00 | 36,06 | −22,29 | 1,2050 | −0,2237 | |||
| MCK / McKesson Corporation | 0,05 | 0,00 | 35,78 | 19,85 | 1,1955 | 0,2764 | |||
| MDT / Medtronic plc | 0,42 | 44,38 | 35,63 | 9,92 | 1,1907 | 0,0220 | |||
| HWM / Howmet Aerospace Inc. | 0,26 | 0,00 | 35,51 | 9,48 | 1,1866 | 0,1880 | |||
| SYK / Stryker Corporation | 0,09 | 0,00 | 35,23 | −4,44 | 1,1771 | 0,0422 | |||
| CSCO / Cisco Systems, Inc. | 0,60 | 50,58 | 34,36 | 43,45 | 1,1482 | 0,4107 | |||
| AIR / Airbus SE | 0,20 | 0,00 | 34,17 | −1,90 | 1,1419 | 0,0695 | |||
| COF / Capital One Financial Corporation | 0,18 | 0,00 | 32,59 | −11,51 | 1,0890 | −0,0449 | |||
| EMR / Emerson Electric Co. | 0,31 | −14,99 | 32,32 | −31,24 | 1,0800 | −0,3672 | |||
| T / AT&T Inc. | 1,15 | 0,00 | 31,79 | 16,73 | 1,0621 | 0,2238 | |||
| BAC / Bank of America Corporation | 0,79 | −20,78 | 31,67 | 7,91 | 1,0581 | −0,0047 | |||
| JCI / Johnson Controls International plc | 0,38 | 0,00 | 31,51 | 7,56 | 1,0528 | 0,1510 | |||
| CRH / CRH plc | 0,32 | 0,00 | 30,41 | −3,64 | 1,0162 | 0,0445 | |||
| MSI / Motorola Solutions, Inc. | 0,07 | 0,00 | 30,14 | −6,15 | 1,0072 | 0,0184 | |||
| TEL / TE Connectivity plc | 0,20 | 0,00 | 29,64 | −1,07 | 0,9904 | 0,0680 | |||
| ABBV / AbbVie Inc. | 0,15 | −23,33 | 29,36 | −18,66 | 0,9811 | −0,1302 | |||
| CBOE / Cboe Global Markets, Inc. | 0,13 | 29,25 | 0,9775 | 0,9775 | |||||
| WFC / Wells Fargo & Company | 0,41 | 96,38 | 29,24 | 76,98 | 0,9769 | 0,4683 | |||
| AXP / American Express Company | 0,11 | 0,00 | 29,10 | −16,08 | 0,9722 | −0,0952 | |||
| JNJ / Johnson & Johnson | 0,18 | 0,00 | 28,75 | 2,73 | 0,9607 | 0,0991 | |||
| CSL / Carlisle Companies Incorporated | 0,07 | 0,00 | 28,20 | −2,56 | 0,9423 | 0,0513 | |||
| HIG / The Hartford Insurance Group, Inc. | 0,23 | 0,00 | 27,98 | 9,97 | 0,9350 | 0,1516 | |||
| ZBH / Zimmer Biomet Holdings, Inc. | 0,27 | 0,00 | 27,96 | −5,87 | 0,9344 | 0,0198 | |||
| TXN / Texas Instruments Incorporated | 0,17 | 0,00 | 27,56 | −13,30 | 0,9208 | −0,0578 | |||
| RCL / Royal Caribbean Cruises Ltd. | 0,13 | 0,00 | 27,36 | −19,39 | 0,9142 | −0,1307 | |||
| NOC / Northrop Grumman Corporation | 0,06 | 0,00 | 27,14 | −0,16 | 0,9068 | 0,0700 | |||
| MAR / Marriott International, Inc. | 0,11 | 0,00 | 26,97 | −17,90 | 0,9011 | −0,1101 | |||
| DE / Deere & Company | 0,06 | 0,00 | 26,00 | −2,73 | 0,8686 | 0,0459 | |||
| DLR / Digital Realty Trust, Inc. | 0,16 | 0,00 | 25,72 | −2,03 | 0,8594 | 0,0512 | |||
| AEE / Ameren Corporation | 0,25 | 0,00 | 24,97 | 5,35 | 0,8345 | 0,1047 | |||
| LZAGY / Lonza Group AG - Depositary Receipt (Common Stock) | 0,03 | −20,97 | 24,89 | −10,45 | 0,8318 | −0,0241 | |||
| BMY / Bristol-Myers Squibb Company | 0,49 | 24,75 | 0,8270 | 0,8270 | |||||
| US8252524066 / Invesco Treasury Portfolio, Institutional Class | 24,65 | −12,98 | 24,65 | −12,98 | 0,8236 | −0,0484 | |||
| SYY / Sysco Corporation | 0,34 | −20,24 | 23,97 | −21,90 | 0,8008 | −0,1439 | |||
| LNG / Cheniere Energy, Inc. | 0,10 | 0,00 | 23,78 | 3,34 | 0,7946 | 0,0861 | |||
| HUBB / Hubbell Incorporated | 0,06 | −20,16 | 23,49 | −31,45 | 0,7848 | −0,2700 | |||
| STZ / Constellation Brands, Inc. | 0,11 | 0,00 | 20,62 | 3,73 | 0,6892 | 0,0770 | |||
| ROK / Rockwell Automation, Inc. | 0,08 | 0,00 | 19,22 | −11,04 | 0,6423 | −0,0230 | |||
| ASML / ASML Holding N.V. - Depositary Receipt (Common Stock) | 0,03 | −26,53 | 18,90 | −43,74 | 0,6314 | −0,4983 | |||
| SNY / Sanofi - Depositary Receipt (Common Stock) | 0,34 | −24,46 | 18,62 | −23,61 | 0,6223 | −0,1283 | |||
| CEG / Constellation Energy Corporation | 0,08 | 18,48 | 0,6175 | 0,6175 | |||||
| SW / Smurfit Westrock Plc | 0,43 | 0,00 | 18,15 | −20,85 | 0,6064 | −0,0995 | |||
| Invesco Private Prime Fund / STIV (N/A) | 17,27 | 17,27 | 0,5771 | 0,5771 | |||||
| CVS / CVS Health Corporation | 0,26 | 17,15 | 0,5732 | 0,5732 | |||||
| CMCSA / Comcast Corporation | 0,49 | 0,00 | 16,75 | 1,60 | 0,5598 | 0,0522 | |||
| KDP / Keurig Dr Pepper Inc. | 0,42 | 14,48 | 0,4840 | 0,4840 | |||||
| US8252528851 / Invesco Government & Agency Portfolio, Institutional Class | 13,20 | −13,04 | 13,20 | −13,04 | 0,4412 | −0,0263 | |||
| Invesco Private Government Fund / STIV (N/A) | 6,70 | 6,70 | 0,2239 | 0,2239 | |||||
| TECK / Teck Resources Limited | 0,00 | −100,00 | 0,00 | −100,00 | −0,4981 | ||||
| USB / U.S. Bancorp | 0,00 | −100,00 | 0,00 | −100,00 | −0,9749 |