Grundläggande statistik
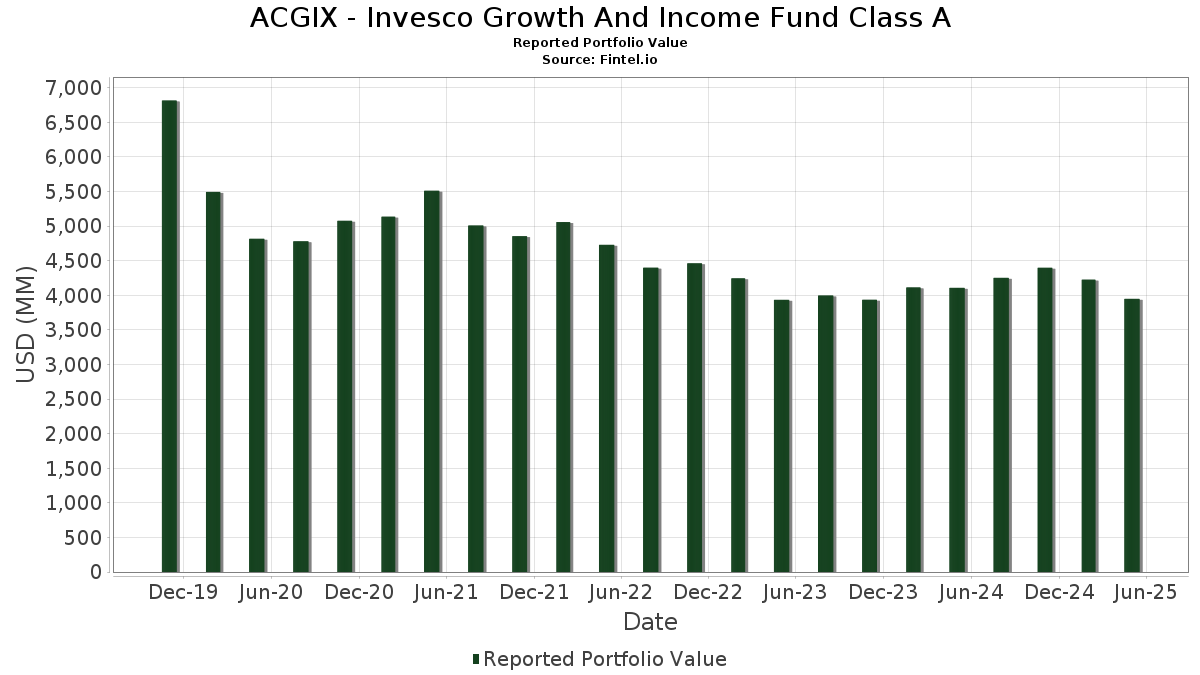
| Portföljvärde | $ 3 948 367 307 |
| Aktuella positioner | 97 |
Senaste innehav, resultat, förvaltat kapital (från 13F, 13D)
ACGIX - Invesco Growth And Income Fund Class A har redovisat 97 totala innehav i sina senaste SEC-arkiveringar. Det senaste portföljvärdet beräknas vara $ 3 948 367 307 USD. Faktiskt förvaltade tillgångar (AUM) är detta värde plus likvida medel (som inte redovisas). ACGIX - Invesco Growth And Income Fund Class As största innehav är Wells Fargo & Company (US:WFC) , Bank of America Corporation (US:BAC) , Invesco Treasury Portfolio, Institutional Class (US:US8252524066) , Amazon.com, Inc. (US:AMZN) , and Microsoft Corporation (US:MSFT) . ACGIX - Invesco Growth And Income Fund Class As nya positioner inkluderar Direxion Shares ETF Trust - Direxion Daily NVDA Bear 1X Shares (US:NVDD) , Strats Trust For Procter & Gambel Security - Preferred Security (US:GJR) , NIKE, Inc. (US:NKE) , Vertiv Holdings Co (US:VRT) , and .
Största ökningarna detta kvartal
Vi använder förändringen i portföljallokeringen eftersom det är det mest meningsfulla måttet. Förändringar kan bero på transaktioner eller förändringar i aktiekurser.
| Värdepapper | Aktier (MM) |
Värde (MM$) |
Portfölj % av | ΔPortfölj % av |
|---|---|---|---|---|
| 112,09 | 112,09 | 2,8567 | 1,6949 | |
| 0,37 | 49,34 | 1,2575 | 1,2575 | |
| 0,28 | 47,28 | 1,2050 | 1,2050 | |
| 0,70 | 42,69 | 1,0880 | 1,0880 | |
| 0,36 | 39,08 | 0,9959 | 0,9959 | |
| 60,35 | 60,35 | 1,5382 | 0,9126 | |
| 24,34 | 24,34 | 0,6204 | 0,6204 | |
| 0,87 | 61,14 | 1,5582 | 0,5548 | |
| 0,21 | 96,93 | 2,4704 | 0,5260 | |
| 1,32 | 76,89 | 1,9595 | 0,4982 |
Största minskningarna detta kvartal
Vi använder förändringen i portföljallokeringen eftersom det är det mest meningsfulla måttet. Förändringar kan bero på transaktioner eller förändringar i aktiepriser.
| Värdepapper | Aktier (MM) |
Värde (MM$) |
Portfölj % av | ΔPortfölj % av |
|---|---|---|---|---|
| 0,00 | 0,00 | −1,3512 | ||
| 1,85 | 138,39 | 3,5272 | −0,7908 | |
| 0,11 | 24,69 | 0,6292 | −0,6023 | |
| 0,35 | 57,33 | 1,4612 | −0,5769 | |
| 0,62 | 30,86 | 0,7865 | −0,5180 | |
| 0,06 | 35,67 | 0,9092 | −0,4346 | |
| 0,30 | 52,06 | 1,3268 | −0,4160 | |
| 0,46 | 57,11 | 1,4557 | −0,4074 | |
| 0,07 | 28,31 | 0,7214 | −0,2604 | |
| 2,91 | 128,55 | 3,2763 | −0,2495 |
13F- och fond arkiveringar
Denna blankett lämnades in den 2025-07-29 för rapporteringsperioden 2025-05-31. Klicka på länksymbolen för att se hela transaktionshistoriken.
Uppgradera för att låsa upp premiumdata och exportera till Excel![]() .
.
| Värdepapper | Typ | Genomsnittligt aktiepris | Aktier (MM) |
ΔAktier (%) |
ΔAktier (%) |
Värde ($MM) |
Portfölj (%) |
ΔPortfölj (%) |
|
|---|---|---|---|---|---|---|---|---|---|
| WFC / Wells Fargo & Company | 1,85 | −19,90 | 138,39 | −23,52 | 3,5272 | −0,7908 | |||
| BAC / Bank of America Corporation | 2,91 | −9,11 | 128,55 | −13,00 | 3,2763 | −0,2495 | |||
| US8252524066 / Invesco Treasury Portfolio, Institutional Class | 112,09 | 130,21 | 112,09 | 130,21 | 2,8567 | 1,6949 | |||
| AMZN / Amazon.com, Inc. | 0,48 | 6,05 | 98,26 | 2,41 | 2,5044 | 0,2148 | |||
| MSFT / Microsoft Corporation | 0,21 | 2,58 | 96,93 | 18,96 | 2,4704 | 0,5260 | |||
| JCI / Johnson Controls International plc | 0,90 | −22,42 | 91,06 | −8,19 | 2,3208 | −0,0459 | |||
| PM / Philip Morris International Inc. | 0,49 | −5,17 | 89,13 | 10,29 | 2,2715 | 0,3431 | |||
| PH / Parker-Hannifin Corporation | 0,12 | −2,80 | 82,34 | −3,35 | 2,0985 | 0,0655 | |||
| JNJ / Johnson & Johnson | 0,51 | −0,50 | 79,00 | −6,41 | 2,0135 | −0,0009 | |||
| SCHW / The Charles Schwab Corporation | 0,88 | −0,50 | 78,15 | 10,53 | 1,9917 | 0,3045 | |||
| MCHP / Microchip Technology Incorporated | 1,32 | 27,32 | 76,89 | 25,55 | 1,9595 | 0,4982 | |||
| WTW / Willis Towers Watson Public Limited Company | 0,24 | −2,75 | 75,99 | −9,37 | 1,9369 | −0,0640 | |||
| DIS / The Walt Disney Company | 0,66 | −0,50 | 74,30 | −1,16 | 1,8936 | 0,0998 | |||
| SYY / Sysco Corporation | 0,96 | 5,06 | 70,25 | 1,52 | 1,7904 | 0,1392 | |||
| USFD / US Foods Holding Corp. | 0,88 | 3,14 | 69,85 | 13,85 | 1,7801 | 0,3161 | |||
| MDT / Medtronic plc | 0,80 | −0,50 | 66,73 | −10,27 | 1,7007 | −0,0740 | |||
| PPL / PPL Corporation | 1,83 | 5,38 | 63,66 | 4,00 | 1,6225 | 0,1618 | |||
| RTX / RTX Corporation | 0,45 | −21,25 | 61,45 | −19,18 | 1,5663 | −0,2484 | |||
| FTV / Fortive Corporation | 0,87 | 64,77 | 61,14 | 45,40 | 1,5582 | 0,5548 | |||
| CFG / Citizens Financial Group, Inc. | 1,51 | −0,50 | 60,85 | −12,28 | 1,5508 | −0,1045 | |||
| US8252528851 / Invesco Government & Agency Portfolio, Institutional Class | 60,35 | 130,22 | 60,35 | 130,22 | 1,5382 | 0,9126 | |||
| EMR / Emerson Electric Co. | 0,50 | −0,50 | 59,36 | −2,32 | 1,5129 | 0,0627 | |||
| FI / Fiserv, Inc. | 0,35 | −2,81 | 57,33 | −32,87 | 1,4612 | −0,5769 | |||
| CVX / Chevron Corporation | 0,42 | −0,50 | 57,26 | −14,25 | 1,4595 | −0,1341 | |||
| CBRE / CBRE Group, Inc. | 0,46 | −16,94 | 57,11 | −26,84 | 1,4557 | −0,4074 | |||
| COP / ConocoPhillips | 0,67 | 3,81 | 57,02 | −10,64 | 1,4533 | −0,0695 | |||
| XOM / Exxon Mobil Corporation | 0,55 | −0,50 | 56,11 | −8,57 | 1,4300 | −0,0344 | |||
| CVS / CVS Health Corporation | 0,87 | 3,16 | 55,47 | 0,52 | 1,4138 | 0,0970 | |||
| SAN / Santander UK plc - Preferred Stock | 0,55 | −0,50 | 54,19 | −9,80 | 1,3810 | −0,0525 | |||
| FIS / Fidelity National Information Services, Inc. | 0,68 | 9,10 | 53,76 | 22,13 | 1,3702 | 0,3197 | |||
| PNC / The PNC Financial Services Group, Inc. | 0,30 | −0,50 | 52,90 | −9,88 | 1,3482 | −0,0526 | |||
| CSCO / Cisco Systems, Inc. | 0,83 | −0,50 | 52,55 | −2,16 | 1,3393 | 0,0577 | |||
| GOOGL / Alphabet Inc. | 0,30 | −29,32 | 52,06 | −28,72 | 1,3268 | −0,4160 | |||
| KKR / KKR & Co. Inc. | 0,42 | 8,42 | 50,92 | −2,88 | 1,2978 | 0,0467 | |||
| SHELL / Shell plc | 1,54 | −19,47 | 50,69 | −20,49 | 1,2920 | −0,2294 | |||
| AIG / American International Group, Inc. | 0,59 | −0,50 | 50,32 | 1,55 | 1,2824 | 0,0999 | |||
| NVDD / Direxion Shares ETF Trust - Direxion Daily NVDA Bear 1X Shares | 0,37 | 49,34 | 1,2575 | 1,2575 | |||||
| ORCL / Oracle Corporation | 0,29 | −0,50 | 48,80 | −0,81 | 1,2437 | 0,0697 | |||
| FERG / Ferguson Enterprises Inc. | 0,26 | −11,29 | 48,29 | −8,88 | 1,2307 | −0,0339 | |||
| GS / The Goldman Sachs Group, Inc. | 0,08 | −17,44 | 48,18 | −20,34 | 1,2278 | −0,2154 | |||
| GJR / Strats Trust For Procter & Gambel Security - Preferred Security | 0,28 | 47,28 | 1,2050 | 1,2050 | |||||
| NSC / Norfolk Southern Corporation | 0,19 | −15,27 | 47,14 | −14,80 | 1,2015 | −0,1189 | |||
| SBUX / Starbucks Corporation | 0,55 | 39,14 | 46,22 | 0,86 | 1,1781 | 0,0845 | |||
| CTSH / Cognizant Technology Solutions Corporation | 0,56 | −9,04 | 45,52 | −11,59 | 1,1602 | −0,0686 | |||
| TMUS / T-Mobile US, Inc. | 0,18 | −0,50 | 43,97 | −10,64 | 1,1207 | −0,0535 | |||
| CNC / Centene Corporation | 0,78 | −0,50 | 43,77 | −3,44 | 1,1156 | 0,0339 | |||
| NKE / NIKE, Inc. | 0,70 | 42,69 | 1,0880 | 1,0880 | |||||
| FDX / FedEx Corporation | 0,19 | −0,50 | 42,34 | −17,45 | 1,0792 | −0,1449 | |||
| UNH / UnitedHealth Group Incorporated | 0,14 | 53,88 | 41,11 | −2,19 | 1,0478 | 0,0448 | |||
| CTVA / Corteva, Inc. | 0,58 | −0,50 | 41,06 | 11,86 | 1,0464 | 0,1705 | |||
| CRM / Salesforce, Inc. | 0,15 | −0,50 | 41,00 | −11,35 | 1,0449 | −0,0587 | |||
| BMY / Bristol-Myers Squibb Company | 0,84 | −0,50 | 40,33 | −19,42 | 1,0278 | −0,1665 | |||
| AEP / American Electric Power Company, Inc. | 0,38 | −0,50 | 39,33 | −2,90 | 1,0023 | 0,0358 | |||
| VRT / Vertiv Holdings Co | 0,36 | 39,08 | 0,9959 | 0,9959 | |||||
| LRCX / Lam Research Corporation | 0,48 | −0,50 | 38,65 | 4,76 | 0,9851 | 0,1046 | |||
| COHR / Coherent Corp. | 0,50 | 5,01 | 38,12 | 5,62 | 0,9716 | 0,1103 | |||
| NXPI / NXP Semiconductors N.V. | 0,20 | −0,50 | 38,09 | −11,79 | 0,9708 | −0,0596 | |||
| META / Meta Platforms, Inc. | 0,06 | −34,62 | 35,67 | −36,65 | 0,9092 | −0,4346 | |||
| ZBRA / Zebra Technologies Corporation | 0,12 | −0,50 | 35,12 | −8,48 | 0,8950 | −0,0206 | |||
| EQT / EQT Corporation | 0,64 | −0,50 | 35,07 | 13,89 | 0,8938 | 0,1589 | |||
| ALL / The Allstate Corporation | 0,16 | −24,69 | 34,10 | −20,64 | 0,8692 | −0,1563 | |||
| SU / Suncor Energy Inc. | 0,92 | −0,50 | 32,69 | −7,55 | 0,8331 | −0,0106 | |||
| FE / FirstEnergy Corp. | 0,78 | −0,50 | 32,56 | 7,64 | 0,8298 | 0,1080 | |||
| GM / General Motors Company | 0,62 | −44,09 | 30,86 | −43,55 | 0,7865 | −0,5180 | |||
| MRK / Merck & Co., Inc. | 0,38 | 5,92 | 29,19 | −11,78 | 0,7440 | −0,0456 | |||
| TXT / Textron Inc. | 0,39 | −0,50 | 29,18 | −1,43 | 0,7437 | 0,0373 | |||
| PPG / PPG Industries, Inc. | 0,26 | −0,50 | 28,57 | −2,62 | 0,7282 | 0,0280 | |||
| ELV / Elevance Health, Inc. | 0,07 | −28,86 | 28,31 | −31,20 | 0,7214 | −0,2604 | |||
| DD / DuPont de Nemours, Inc. | 0,42 | −0,50 | 28,23 | −18,71 | 0,7195 | −0,1093 | |||
| HUM / Humana Inc. | 0,11 | −44,51 | 24,69 | −52,16 | 0,6292 | −0,6023 | |||
| PFE / Pfizer Inc. | 1,05 | −13,70 | 24,65 | −23,30 | 0,6283 | −0,1387 | |||
| Invesco Private Prime Fund / STIV (N/A) | 24,34 | 24,34 | 0,6204 | 0,6204 | |||||
| GEHC / GE HealthCare Technologies Inc. | 0,33 | −0,50 | 23,47 | −19,64 | 0,5981 | −0,0988 | |||
| Invesco Private Government Fund / STIV (N/A) | 9,35 | 9,35 | 0,2384 | 0,2384 | |||||
| Forward Foreign Currency Contract / DFE (N/A) | 0,07 | 0,0018 | 0,0018 | ||||||
| Forward Foreign Currency Contract / DFE (N/A) | 0,02 | 0,0005 | 0,0005 | ||||||
| Forward Foreign Currency Contract / DFE (N/A) | 0,01 | 0,0003 | 0,0003 | ||||||
| Forward Foreign Currency Contract / DFE (N/A) | 0,01 | 0,0003 | 0,0003 | ||||||
| Forward Foreign Currency Contract / DFE (N/A) | 0,01 | 0,0002 | 0,0002 | ||||||
| Forward Foreign Currency Contract / DFE (N/A) | 0,01 | 0,0002 | 0,0002 | ||||||
| Forward Foreign Currency Contract / DFE (N/A) | 0,01 | 0,0001 | 0,0001 | ||||||
| Forward Foreign Currency Contract / DFE (N/A) | 0,01 | 0,0001 | 0,0001 | ||||||
| Forward Foreign Currency Contract / DFE (N/A) | 0,00 | 0,0000 | 0,0000 | ||||||
| MRVL / Marvell Technology, Inc. | 0,00 | −100,00 | 0,00 | −100,00 | −1,3512 | ||||
| Forward Foreign Currency Contract / DFE (N/A) | −0,00 | −0,0000 | −0,0000 | ||||||
| Forward Foreign Currency Contract / DFE (N/A) | −0,00 | −0,0000 | −0,0000 | ||||||
| Forward Foreign Currency Contract / DFE (N/A) | −0,00 | −0,0001 | −0,0001 | ||||||
| Forward Foreign Currency Contract / DFE (N/A) | −0,00 | −0,0001 | −0,0001 | ||||||
| Forward Foreign Currency Contract / DFE (N/A) | −0,00 | −0,0001 | −0,0001 | ||||||
| Forward Foreign Currency Contract / DFE (N/A) | −0,01 | −0,0001 | −0,0001 | ||||||
| Forward Foreign Currency Contract / DFE (N/A) | −0,01 | −0,0001 | −0,0001 | ||||||
| Forward Foreign Currency Contract / DFE (N/A) | −0,01 | −0,0002 | −0,0002 | ||||||
| Forward Foreign Currency Contract / DFE (N/A) | −0,01 | −0,0002 | −0,0002 | ||||||
| Forward Foreign Currency Contract / DFE (N/A) | −0,01 | −0,0003 | −0,0003 | ||||||
| Forward Foreign Currency Contract / DFE (N/A) | −0,01 | −0,0003 | −0,0003 | ||||||
| Forward Foreign Currency Contract / DFE (N/A) | −0,01 | −0,0003 | −0,0003 | ||||||
| Forward Foreign Currency Contract / DFE (N/A) | −0,12 | −0,0030 | −0,0030 | ||||||
| Forward Foreign Currency Contract / DFE (N/A) | −0,36 | −0,0091 | −0,0091 |