Grundläggande statistik
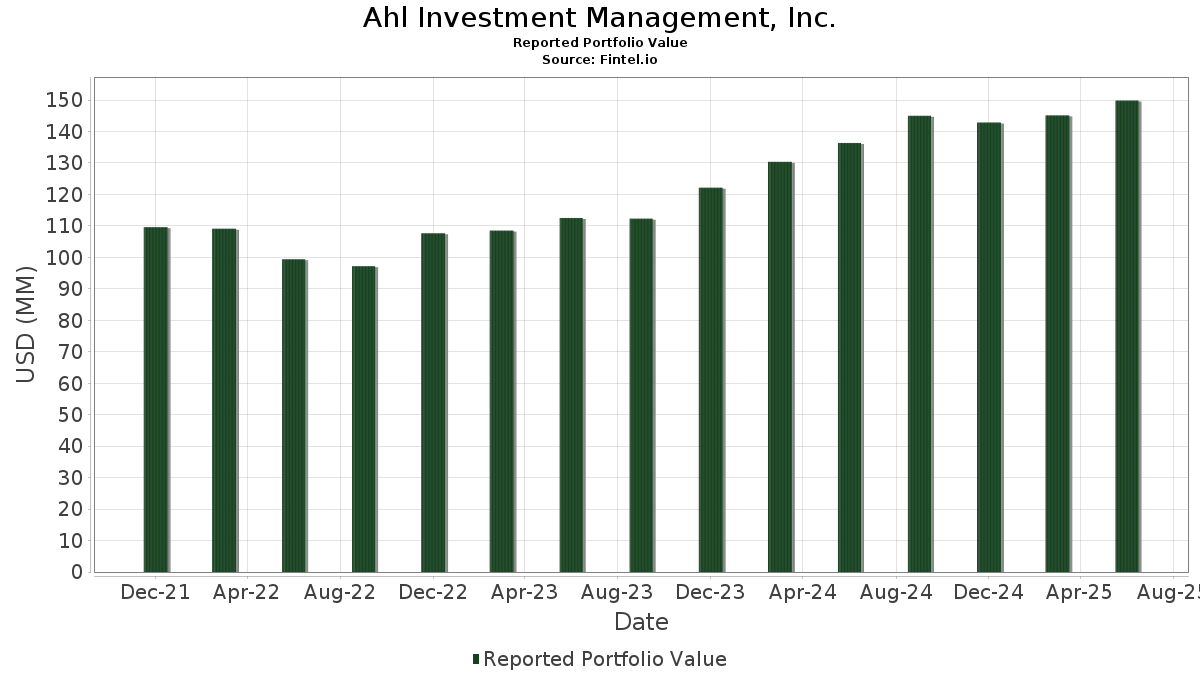
| Portföljvärde | $ 149 835 241 |
| Aktuella positioner | 70 |
Senaste innehav, resultat, förvaltat kapital (från 13F, 13D)
Ahl Investment Management, Inc. har redovisat 70 totala innehav i sina senaste SEC-arkiveringar. Det senaste portföljvärdet beräknas vara $ 149 835 241 USD. Faktiskt förvaltade tillgångar (AUM) är detta värde plus likvida medel (som inte redovisas). Ahl Investment Management, Inc.s största innehav är Microsoft Corporation (US:MSFT) , JPMorgan Chase & Co. (US:JPM) , The Coca-Cola Company (US:KO) , Global X Funds - Global X U.S. Preferred ETF (US:PFFD) , and Schwab Strategic Trust - Schwab U.S. Broad Market ETF (US:SCHB) . Ahl Investment Management, Inc.s nya positioner inkluderar iShares Trust - iShares National Muni Bond ETF (US:MUB) , .
Största ökningarna detta kvartal
Vi använder förändringen i portföljallokeringen eftersom det är det mest meningsfulla måttet. Förändringar kan bero på transaktioner eller förändringar i aktiekurser.
| Värdepapper | Aktier (MM) |
Värde (MM$) |
Portfölj % av | ΔPortfölj % av |
|---|---|---|---|---|
| 0,03 | 2,62 | 1,7458 | 1,7458 | |
| 0,02 | 9,50 | 6,3378 | 1,2414 | |
| 0,03 | 2,39 | 1,5984 | 1,0734 | |
| 0,03 | 3,63 | 2,4211 | 0,3648 | |
| 0,03 | 8,47 | 5,6516 | 0,3039 | |
| 0,01 | 2,28 | 1,5224 | 0,2971 | |
| 0,29 | 6,97 | 4,6487 | 0,2810 | |
| 0,01 | 3,55 | 2,3662 | 0,2361 | |
| 0,01 | 2,72 | 1,8142 | 0,1871 | |
| 0,00 | 0,24 | 0,1634 | 0,1634 |
Största minskningarna detta kvartal
Vi använder förändringen i portföljallokeringen eftersom det är det mest meningsfulla måttet. Förändringar kan bero på transaktioner eller förändringar i aktiepriser.
| Värdepapper | Aktier (MM) |
Värde (MM$) |
Portfölj % av | ΔPortfölj % av |
|---|---|---|---|---|
| 0,02 | 0,32 | 0,2168 | −1,0244 | |
| 0,05 | 5,68 | 3,7878 | −0,5495 | |
| 0,03 | 6,20 | 4,1356 | −0,5007 | |
| 0,05 | 1,32 | 0,8784 | −0,4628 | |
| 0,02 | 3,97 | 2,6514 | −0,4386 | |
| 0,11 | 8,10 | 5,4064 | −0,3070 | |
| 0,02 | 3,45 | 2,3002 | −0,3029 | |
| 0,02 | 2,25 | 1,5039 | −0,2724 | |
| 0,42 | 7,87 | 5,2497 | −0,2508 | |
| 0,13 | 3,52 | 2,3484 | −0,2452 |
13F- och fond arkiveringar
Denna blankett lämnades in den 2025-07-10 för rapporteringsperioden 2025-06-30. Klicka på länksymbolen för att se hela transaktionshistoriken.
Uppgradera för att låsa upp premiumdata och exportera till Excel![]() .
.
| Värdepapper | Typ | Genomsnittligt aktiepris | Aktier (MM) |
ΔAktier (%) |
ΔAktier (%) |
Värde ($MM) |
Portfölj (%) |
ΔPortfölj (%) |
|
|---|---|---|---|---|---|---|---|---|---|
| MSFT / Microsoft Corporation | 0,02 | −3,10 | 9,50 | 28,41 | 6,3378 | 1,2414 | |||
| JPM / JPMorgan Chase & Co. | 0,03 | −7,67 | 8,47 | 9,12 | 5,6516 | 0,3039 | |||
| KO / The Coca-Cola Company | 0,11 | −1,10 | 8,10 | −2,30 | 5,4064 | −0,3070 | |||
| PFFD / Global X Funds - Global X U.S. Preferred ETF | 0,42 | −0,36 | 7,87 | −1,47 | 5,2497 | −0,2508 | |||
| SCHB / Schwab Strategic Trust - Schwab U.S. Broad Market ETF | 0,29 | −0,71 | 6,97 | 9,89 | 4,6487 | 0,2810 | |||
| AAPL / Apple Inc. | 0,03 | −0,29 | 6,20 | −7,91 | 4,1356 | −0,5007 | |||
| XOM / Exxon Mobil Corporation | 0,05 | −0,52 | 5,68 | −9,83 | 3,7878 | −0,5495 | |||
| SYK / Stryker Corporation | 0,01 | 0,00 | 5,03 | 6,27 | 3,3586 | 0,0957 | |||
| SDHY / PGIM Short Duration High Yield Opportunities Fund | 0,29 | −5,41 | 4,84 | −3,34 | 3,2290 | −0,2205 | |||
| NOC / Northrop Grumman Corporation | 0,01 | −1,48 | 4,34 | −3,79 | 2,8947 | −0,2119 | |||
| ABBV / AbbVie Inc. | 0,02 | 0,00 | 3,97 | −11,42 | 2,6514 | −0,4386 | |||
| EMR / Emerson Electric Co. | 0,03 | −0,03 | 3,63 | 21,55 | 2,4211 | 0,3648 | |||
| AXP / American Express Company | 0,01 | −3,26 | 3,55 | 14,69 | 2,3662 | 0,2361 | |||
| BSV / Vanguard Bond Index Funds - Vanguard Short-Term Bond ETF | 0,04 | −0,11 | 3,53 | 0,43 | 2,3591 | −0,0664 | |||
| SCHD / Schwab Strategic Trust - Schwab U.S. Dividend Equity ETF | 0,13 | −1,36 | 3,52 | −6,51 | 2,3484 | −0,2452 | |||
| JNJ / Johnson & Johnson | 0,02 | −0,94 | 3,45 | −8,76 | 2,3002 | −0,3029 | |||
| SCHF / Schwab Strategic Trust - Schwab International Equity ETF | 0,15 | −1,19 | 3,26 | 10,39 | 2,1775 | 0,1410 | |||
| CVS / CVS Health Corporation | 0,04 | −0,74 | 2,74 | 1,03 | 1,8305 | −0,0397 | |||
| AMZN / Amazon.com, Inc. | 0,01 | −0,16 | 2,72 | 15,12 | 1,8142 | 0,1871 | |||
| MUB / iShares Trust - iShares National Muni Bond ETF | 0,03 | 2,62 | 1,7458 | 1,7458 | |||||
| SCHO / Schwab Strategic Trust - Schwab Short-Term U.S. Treasury ETF | 0,10 | −7,62 | 2,53 | −7,49 | 1,6903 | −0,1958 | |||
| QCOM / QUALCOMM Incorporated | 0,02 | −0,06 | 2,53 | 3,61 | 1,6866 | 0,0059 | |||
| NZF / Nuveen Municipal Credit Income Fund | 0,21 | −0,12 | 2,47 | −2,64 | 1,6473 | −0,0999 | |||
| NEE / NextEra Energy, Inc. | 0,03 | 221,02 | 2,39 | 214,59 | 1,5984 | 1,0734 | |||
| PFE / Pfizer Inc. | 0,09 | 3,18 | 2,30 | −1,29 | 1,5321 | −0,0706 | |||
| UNH / UnitedHealth Group Incorporated | 0,01 | 115,38 | 2,28 | 28,29 | 1,5224 | 0,2971 | |||
| CVX / Chevron Corporation | 0,02 | 2,13 | 2,25 | −12,57 | 1,5039 | −0,2724 | |||
| ABT / Abbott Laboratories | 0,01 | −1,10 | 1,96 | 1,40 | 1,3049 | −0,0238 | |||
| MCD / McDonald's Corporation | 0,01 | −0,45 | 1,95 | −6,91 | 1,3039 | −0,1419 | |||
| CSCO / Cisco Systems, Inc. | 0,03 | −15,86 | 1,89 | −5,41 | 1,2605 | −0,1153 | |||
| RTX / RTX Corporation | 0,01 | −0,51 | 1,86 | 9,68 | 1,2401 | 0,0726 | |||
| VTI / Vanguard Index Funds - Vanguard Total Stock Market ETF | 0,01 | 0,33 | 1,86 | 10,93 | 1,2398 | 0,0860 | |||
| WMT / Walmart Inc. | 0,02 | −13,98 | 1,81 | −4,19 | 1,2063 | −0,0937 | |||
| VZ / Verizon Communications Inc. | 0,04 | −0,42 | 1,80 | −5,02 | 1,2003 | −0,1043 | |||
| TFC / Truist Financial Corporation | 0,04 | −4,88 | 1,79 | −0,67 | 1,1938 | −0,0466 | |||
| PEP / PepsiCo, Inc. | 0,01 | 1,34 | 1,40 | −10,73 | 0,9327 | −0,1464 | |||
| CARR / Carrier Global Corporation | 0,02 | −1,04 | 1,35 | 14,20 | 0,9023 | 0,0868 | |||
| T / AT&T Inc. | 0,05 | −33,92 | 1,32 | −32,37 | 0,8784 | −0,4628 | |||
| NUW / Nuveen AMT-Free Municipal Value Fund | 0,09 | 8,09 | 1,26 | 7,61 | 0,8408 | 0,0341 | |||
| GOOGL / Alphabet Inc. | 0,01 | 0,86 | 0,93 | 15,01 | 0,6190 | 0,0630 | |||
| KEY / KeyCorp | 0,05 | 11,80 | 0,89 | 21,84 | 0,5921 | 0,0902 | |||
| SCHZ / Schwab Strategic Trust - Schwab U.S. Aggregate Bond ETF | 0,04 | 13,76 | 0,83 | 14,25 | 0,5513 | 0,0527 | |||
| USB / U.S. Bancorp | 0,02 | −0,29 | 0,79 | 6,77 | 0,5272 | 0,0179 | |||
| XLU / The Select Sector SPDR Trust - The Utilities Select Sector SPDR Fund | 0,01 | −4,04 | 0,64 | −0,62 | 0,4277 | −0,0166 | |||
| AVGO / Broadcom Inc. | 0,00 | 0,00 | 0,64 | 64,77 | 0,4250 | 0,1584 | |||
| OTIS / Otis Worldwide Corporation | 0,01 | −0,43 | 0,58 | −4,47 | 0,3854 | −0,0311 | |||
| XLF / The Select Sector SPDR Trust - The Financial Select Sector SPDR Fund | 0,01 | 0,00 | 0,53 | 5,00 | 0,3510 | 0,0063 | |||
| SCHA / Schwab Strategic Trust - Schwab U.S. Small-Cap ETF | 0,02 | 0,00 | 0,46 | 8,00 | 0,3067 | 0,0134 | |||
| SCHX / Schwab Strategic Trust - Schwab U.S. Large-Cap ETF | 0,02 | −15,50 | 0,43 | −6,37 | 0,2845 | −0,0296 | |||
| SPY / SPDR S&P 500 ETF | 0,00 | 0,00 | 0,42 | 10,53 | 0,2804 | 0,0183 | |||
| COP / ConocoPhillips | 0,00 | 0,00 | 0,42 | −14,58 | 0,2780 | −0,0579 | |||
| SCHG / Schwab Strategic Trust - Schwab U.S. Large-Cap Growth ETF | 0,01 | 0,00 | 0,41 | 16,81 | 0,2737 | 0,0314 | |||
| HD / The Home Depot, Inc. | 0,00 | 0,00 | 0,41 | 0,00 | 0,2726 | −0,0087 | |||
| EFA / iShares Trust - iShares MSCI EAFE ETF | 0,00 | 0,00 | 0,35 | 9,18 | 0,2308 | 0,0129 | |||
| SCHV / Schwab Strategic Trust - Schwab U.S. Large-Cap Value ETF | 0,01 | 0,00 | 0,34 | 4,36 | 0,2237 | 0,0018 | |||
| DRI / Darden Restaurants, Inc. | 0,00 | −6,25 | 0,33 | −1,81 | 0,2182 | −0,0109 | |||
| EOT / Eaton Vance National Municipal Opportunities Trust | 0,02 | −81,51 | 0,32 | −82,01 | 0,2168 | −1,0244 | |||
| XLE / The Select Sector SPDR Trust - The Energy Select Sector SPDR Fund | 0,00 | 0,00 | 0,29 | −9,49 | 0,1914 | −0,0264 | |||
| BAC / Bank of America Corporation | 0,01 | 0,00 | 0,28 | 13,31 | 0,1880 | 0,0168 | |||
| IWV / iShares Trust - iShares Russell 3000 ETF | 0,00 | 0,00 | 0,27 | 10,70 | 0,1799 | 0,0118 | |||
| FTXP / Foothills Exploration, Inc. | 0,00 | −20,00 | 0,27 | 5,51 | 0,1793 | 0,0037 | |||
| DIS / The Walt Disney Company | 0,00 | −1,94 | 0,26 | 22,90 | 0,1762 | 0,0285 | |||
| META / Meta Platforms, Inc. | 0,00 | 0,00 | 0,26 | 27,94 | 0,1744 | 0,0338 | |||
| NVDA / NVIDIA Corporation | 0,00 | 0,24 | 0,1634 | 0,1634 | |||||
| GJR / Strats Trust For Procter & Gambel Security - Preferred Security | 0,00 | 0,00 | 0,24 | −6,61 | 0,1604 | −0,0168 | |||
| BLK / BlackRock, Inc. | 0,00 | 0,00 | 0,24 | 11,16 | 0,1597 | 0,0110 | |||
| ARES / Ares Management Corporation | 0,00 | 0,22 | 0,1467 | 0,1467 | |||||
| MRK / Merck & Co., Inc. | 0,00 | 0,00 | 0,21 | −11,76 | 0,1403 | −0,0240 | |||
| ETN / Eaton Corporation plc | 0,00 | 0,21 | 0,1391 | 0,1391 | |||||
| AXON / Axon Enterprise, Inc. | 0,00 | −37,50 | 0,21 | −1,90 | 0,1381 | −0,0068 | |||
| FE / FirstEnergy Corp. | 0,00 | −100,00 | 0,00 | 0,0000 | |||||
| MIY / BlackRock MuniYield Michigan Quality Fund, Inc. | 0,00 | −100,00 | 0,00 | 0,0000 |