Grundläggande statistik
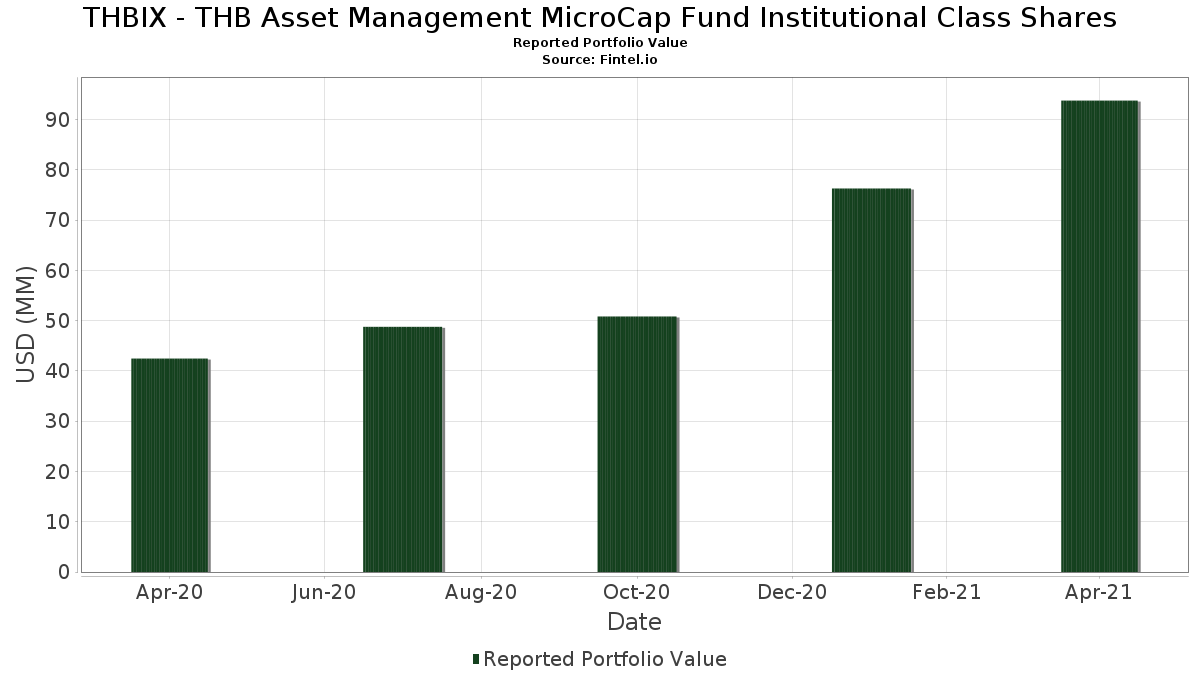
| Portföljvärde | $ 93 795 409 |
| Aktuella positioner | 102 |
Senaste innehav, resultat, förvaltat kapital (från 13F, 13D)
THBIX - THB Asset Management MicroCap Fund Institutional Class Shares har redovisat 102 totala innehav i sina senaste SEC-arkiveringar. Det senaste portföljvärdet beräknas vara $ 93 795 409 USD. Faktiskt förvaltade tillgångar (AUM) är detta värde plus likvida medel (som inte redovisas). THBIX - THB Asset Management MicroCap Fund Institutional Class Sharess största innehav är SEI DAILY INCOME TRUST GOVERNMENT FUND (#36) (XX:US7839655930) , The Joint Corp. (US:JYNT) , BJ's Restaurants, Inc. (US:BJRI) , First Busey Corporation (US:BUSE) , and PAR Technology Corporation (US:PAR) . THBIX - THB Asset Management MicroCap Fund Institutional Class Sharess nya positioner inkluderar Profire Energy, Inc. (US:PFIE) , MasterCraft Boat Holdings, Inc. (US:MCFT) , .
Största ökningarna detta kvartal
Vi använder förändringen i portföljallokeringen eftersom det är det mest meningsfulla måttet. Förändringar kan bero på transaktioner eller förändringar i aktiekurser.
| Värdepapper | Aktier (MM) |
Värde (MM$) |
Portfölj % av | ΔPortfölj % av |
|---|---|---|---|---|
| 3,07 | 3,07 | 3,3084 | 1,7739 | |
| 0,05 | 1,68 | 1,8140 | 1,0205 | |
| 0,05 | 1,68 | 1,8070 | 0,8857 | |
| 0,04 | 1,03 | 1,1124 | 0,8369 | |
| 0,05 | 2,60 | 2,7990 | 0,7999 | |
| 0,03 | 2,07 | 2,2243 | 0,7547 | |
| 0,03 | 1,16 | 1,2495 | 0,7339 | |
| 0,33 | 1,09 | 1,1689 | 0,7254 | |
| 0,04 | 1,75 | 1,8819 | 0,6733 | |
| 0,48 | 0,58 | 0,6255 | 0,6255 |
Största minskningarna detta kvartal
Vi använder förändringen i portföljallokeringen eftersom det är det mest meningsfulla måttet. Förändringar kan bero på transaktioner eller förändringar i aktiepriser.
| Värdepapper | Aktier (MM) |
Värde (MM$) |
Portfölj % av | ΔPortfölj % av |
|---|---|---|---|---|
| 0,03 | 0,73 | 0,7841 | −1,3352 | |
| 0,01 | 0,80 | 0,8613 | −1,1086 | |
| 0,01 | 0,79 | 0,8457 | −1,1071 | |
| 0,02 | 0,94 | 1,0102 | −0,9757 | |
| 0,06 | 0,62 | 0,6709 | −0,8050 | |
| 0,03 | 2,05 | 2,2067 | −0,7759 | |
| 0,03 | 1,80 | 1,9334 | −0,7212 | |
| 0,03 | 1,19 | 1,2838 | −0,4153 | |
| 0,06 | 0,38 | 0,4076 | −0,3999 | |
| 0,08 | 0,44 | 0,4730 | −0,2974 |
13F- och fond arkiveringar
Denna blankett lämnades in den 2021-06-29 för rapporteringsperioden 2021-04-30. Klicka på länksymbolen för att se hela transaktionshistoriken.
Uppgradera för att låsa upp premiumdata och exportera till Excel![]() .
.
| Värdepapper | Typ | Genomsnittligt aktiepris | Aktier (MM) |
ΔAktier (%) |
ΔAktier (%) |
Värde ($MM) |
Portfölj (%) |
ΔPortfölj (%) |
|
|---|---|---|---|---|---|---|---|---|---|
| US7839655930 / SEI DAILY INCOME TRUST GOVERNMENT FUND (#36) | 3,07 | 162,62 | 3,07 | 162,56 | 3,3084 | 1,7739 | |||
| JYNT / The Joint Corp. | 0,05 | 0,00 | 2,60 | 70,54 | 2,7990 | 0,7999 | |||
| BJRI / BJ's Restaurants, Inc. | 0,04 | 0,00 | 2,48 | 30,51 | 2,6670 | 0,1773 | |||
| BUSE / First Busey Corporation | 0,09 | 16,91 | 2,31 | 41,30 | 2,4914 | 0,3435 | |||
| PAR / PAR Technology Corporation | 0,03 | 0,00 | 2,26 | 31,95 | 2,4326 | 0,1866 | |||
| PRFT / Perficient, Inc. | 0,03 | 0,00 | 2,16 | 20,13 | 2,3262 | −0,0323 | |||
| / U.S. Concrete, Inc. | 0,03 | 28,77 | 2,07 | 84,38 | 2,2243 | 0,7547 | |||
| HY / Hyster-Yale, Inc. | 0,03 | 0,00 | 2,05 | −9,89 | 2,2067 | −0,7759 | |||
| PLUS / ePlus inc. | 0,02 | 31,39 | 1,89 | 56,92 | 2,0397 | 0,4562 | |||
| UCTT / Ultra Clean Holdings, Inc. | 0,04 | 0,00 | 1,89 | 32,33 | 2,0324 | 0,1612 | |||
| TPIC / TPI Composites, Inc. | 0,03 | 0,00 | 1,80 | −11,31 | 1,9334 | −0,7212 | |||
| GBX / The Greenbrier Companies, Inc. | 0,04 | 45,27 | 1,75 | 89,69 | 1,8819 | 0,6733 | |||
| CAKE / The Cheesecake Factory Incorporated | 0,03 | 0,00 | 1,74 | 39,21 | 1,8701 | 0,2334 | |||
| BSET / Bassett Furniture Industries, Incorporated | 0,05 | 57,34 | 1,68 | 178,35 | 1,8140 | 1,0205 | |||
| MOV / Movado Group, Inc. | 0,05 | 57,35 | 1,68 | 139,03 | 1,8070 | 0,8857 | |||
| CCS / Century Communities, Inc. | 0,02 | 0,00 | 1,66 | 57,59 | 1,7888 | 0,4055 | |||
| ICHR / Ichor Holdings, Ltd. | 0,03 | 0,00 | 1,55 | 54,48 | 1,6705 | 0,3533 | |||
| RES / RPC, Inc. | 0,31 | 0,00 | 1,53 | 9,00 | 1,6434 | −0,1937 | |||
| LUNA / Luna Innovations Incorporated | 0,13 | 20,79 | 1,50 | 28,87 | 1,6153 | 0,0883 | |||
| VCEL / Vericel Corporation | 0,02 | 0,00 | 1,48 | 51,28 | 1,5888 | 0,3092 | |||
| CLNE / Clean Energy Fuels Corp. | 0,13 | 0,00 | 1,44 | 7,52 | 1,5558 | −0,2067 | |||
| MHO / M/I Homes, Inc. | 0,02 | 0,00 | 1,36 | 41,21 | 1,4619 | 0,2009 | |||
| UPLD / Upland Software, Inc. | 0,03 | 0,00 | 1,33 | 3,92 | 1,4295 | −0,2461 | |||
| LMAT / LeMaitre Vascular, Inc. | 0,02 | 0,00 | 1,27 | 9,19 | 1,3686 | −0,1584 | |||
| RRGB / Red Robin Gourmet Burgers, Inc. | 0,03 | 10,91 | 1,22 | 54,11 | 1,3130 | 0,2743 | |||
| CRMT / America's Car-Mart, Inc. | 0,01 | 0,00 | 1,22 | 26,96 | 1,3089 | 0,0533 | |||
| HFWA / Heritage Financial Corporation | 0,04 | 41,44 | 1,21 | 68,48 | 1,3011 | 0,3600 | |||
| BLFS / BioLife Solutions, Inc. | 0,03 | 0,00 | 1,19 | −7,95 | 1,2838 | −0,4153 | |||
| SKYW / SkyWest, Inc. | 0,02 | 0,00 | 1,17 | 27,45 | 1,2602 | 0,0550 | |||
| IIIN / Insteel Industries, Inc. | 0,03 | 95,41 | 1,16 | 195,17 | 1,2495 | 0,7339 | |||
| ONTO / Onto Innovation Inc. | 0,02 | 0,00 | 1,15 | 26,74 | 1,2356 | 0,0483 | |||
| OSBC / Old Second Bancorp, Inc. | 0,09 | 13,50 | 1,14 | 52,60 | 1,2316 | 0,2490 | |||
| NNBR / NN, Inc. | 0,16 | 46,15 | 1,14 | 77,07 | 1,2221 | 0,3807 | |||
| TRNS / Transcat, Inc. | 0,02 | 0,00 | 1,11 | 36,67 | 1,1925 | 0,1301 | |||
| AMRX / Amneal Pharmaceuticals, Inc. | 0,20 | 32,94 | 1,10 | 52,28 | 1,1890 | 0,2379 | |||
| XPRO / Expro Group Holdings N.V. | 0,33 | 174,59 | 1,09 | 221,01 | 1,1689 | 0,7254 | |||
| CIR / Circor International Inc | 0,03 | 23,83 | 1,04 | 33,03 | 1,1153 | 0,0948 | |||
| RUTH / Ruths Hospitality Group Inc | 0,04 | 242,60 | 1,03 | 391,90 | 1,1124 | 0,8369 | |||
| NSSC / Napco Security Technologies, Inc. | 0,03 | 24,70 | 1,02 | 60,41 | 1,0953 | 0,2628 | |||
| KOP / Koppers Holdings Inc. | 0,03 | 0,00 | 1,01 | −0,10 | 1,0864 | −0,2386 | |||
| ITI / Iteris, Inc. | 0,15 | 61,44 | 0,99 | 67,63 | 1,0650 | 0,2900 | |||
| REGI / Renewable Energy Group Inc | 0,02 | 0,00 | 0,94 | −38,04 | 1,0102 | −0,9757 | |||
| AMOT / Allied Motion Technologies Inc | 0,02 | 12,28 | 0,88 | 29,22 | 0,9481 | 0,0539 | |||
| GHM / Graham Corporation | 0,06 | 0,00 | 0,85 | −7,12 | 0,9136 | −0,2845 | |||
| HSC / Enviri Corp | 0,05 | 0,00 | 0,83 | 7,90 | 0,8971 | −0,1164 | |||
| BOOT / Boot Barn Holdings, Inc. | 0,01 | −56,78 | 0,80 | −46,77 | 0,8613 | −1,1086 | |||
| SNBR / Sleep Number Corporation | 0,01 | −49,20 | 0,79 | −47,24 | 0,8457 | −1,1071 | |||
| OFIX / Orthofix Medical Inc. | 0,02 | 0,00 | 0,77 | 9,80 | 0,8326 | −0,0915 | |||
| JOUT / Johnson Outdoors Inc. | 0,01 | 0,00 | 0,77 | 30,19 | 0,8315 | 0,0528 | |||
| ORN / Orion Group Holdings, Inc. | 0,14 | 0,00 | 0,76 | 0,40 | 0,8176 | −0,1746 | |||
| KALU / Kaiser Aluminum Corporation | 0,01 | 0,00 | 0,74 | 38,84 | 0,7977 | 0,0984 | |||
| GES / Guess?, Inc. | 0,03 | −61,30 | 0,73 | −54,92 | 0,7841 | −1,3352 | |||
| CHUY / Chuy's Holdings, Inc. | 0,01 | 0,00 | 0,73 | 39,42 | 0,7809 | 0,0979 | |||
| USX / U.S. Xpress Enterprises Inc - Class A | 0,07 | 0,00 | 0,72 | 51,69 | 0,7711 | 0,1519 | |||
| MODV / ModivCare Inc. | 0,00 | 0,00 | 0,66 | −11,63 | 0,7122 | −0,2698 | |||
| TIG / Trean Insurance Group Inc | 0,04 | 40,75 | 0,66 | 65,49 | 0,7077 | 0,1863 | |||
| AMRC / Ameresco, Inc. | 0,01 | 0,00 | 0,64 | −5,99 | 0,6931 | −0,2040 | |||
| RVP / Retractable Technologies, Inc. | 0,06 | −8,25 | 0,62 | −44,62 | 0,6709 | −0,8050 | |||
| TACO / Berto Acquisition Corp. | 0,05 | 0,00 | 0,61 | 18,64 | 0,6580 | −0,0184 | |||
| ADUS / Addus HomeCare Corporation | 0,01 | 0,00 | 0,60 | −5,93 | 0,6494 | −0,1921 | |||
| LNTH / Lantheus Holdings, Inc. | 0,03 | 0,00 | 0,60 | 45,76 | 0,6482 | 0,1061 | |||
| NWPX / NWPX Infrastructure, Inc. | 0,02 | 0,00 | 0,60 | 9,96 | 0,6419 | −0,0690 | |||
| RNDB / Randolph Bancorp Inc | 0,03 | 0,00 | 0,59 | 7,04 | 0,6389 | −0,0888 | |||
| PFIE / Profire Energy, Inc. | 0,48 | 0,58 | 0,6255 | 0,6255 | |||||
| CRY / Artivion Inc | 0,02 | 22,22 | 0,58 | 49,10 | 0,6222 | 0,1136 | |||
| IESC / IES Holdings, Inc. | 0,01 | 0,00 | 0,54 | 16,03 | 0,5854 | −0,0289 | |||
| ULBI / Ultralife Corporation | 0,07 | 19,55 | 0,54 | 60,96 | 0,5773 | 0,1402 | |||
| KAI / Kadant Inc. | 0,00 | 0,00 | 0,53 | 24,71 | 0,5710 | 0,0125 | |||
| PLPC / Preformed Line Products Company | 0,01 | 0,00 | 0,53 | 2,93 | 0,5681 | −0,1039 | |||
| PING / Ping Identity Holding Corp | 0,02 | 0,00 | 0,52 | −18,85 | 0,5615 | −0,2811 | |||
| BCML / BayCom Corp | 0,03 | 0,00 | 0,52 | 23,04 | 0,5581 | 0,0057 | |||
| ACLS / Axcelis Technologies, Inc. | 0,01 | 0,00 | 0,49 | 21,38 | 0,5319 | −0,0023 | |||
| UTI / Universal Technical Institute, Inc. | 0,09 | 0,00 | 0,48 | −7,46 | 0,5221 | −0,1647 | |||
| CSII / Cardiovascular Systems Inc. | 0,01 | 0,00 | 0,46 | −10,37 | 0,4938 | −0,1774 | |||
| ECHO / Echo Global Logistics Inc | 0,01 | 43,34 | 0,45 | 78,04 | 0,4890 | 0,1544 | |||
| BWEN / Broadwind, Inc. | 0,08 | 27,44 | 0,44 | −25,21 | 0,4730 | −0,2974 | |||
| LAND / Gladstone Land Corporation | 0,02 | 28,50 | 0,44 | 71,26 | 0,4687 | 0,1355 | |||
| SHYF / The Shyft Group, Inc. | 0,01 | 0,00 | 0,43 | 17,30 | 0,4682 | −0,0181 | |||
| AMEH / Apollo Medical Holdings, Inc. | 0,01 | 0,00 | 0,43 | 34,89 | 0,4669 | 0,0455 | |||
| ATRI / Atrion Corporation | 0,00 | 0,00 | 0,41 | −1,91 | 0,4428 | −0,1075 | |||
| MLAB / Mesa Laboratories, Inc. | 0,00 | 0,00 | 0,40 | −10,24 | 0,4345 | −0,1554 | |||
| VPG / Vishay Precision Group, Inc. | 0,01 | 0,00 | 0,40 | −0,25 | 0,4254 | −0,0946 | |||
| WLDN / Willdan Group, Inc. | 0,01 | 0,00 | 0,38 | −14,70 | 0,4134 | −0,1762 | |||
| OESX / Orion Energy Systems, Inc. | 0,06 | 0,00 | 0,38 | −38,54 | 0,4076 | −0,3999 | |||
| MYRG / MYR Group Inc. | 0,00 | 0,00 | 0,38 | 40,15 | 0,4069 | 0,0531 | |||
| GEOS / Geospace Technologies Corporation | 0,05 | 39,38 | 0,37 | 28,57 | 0,3984 | 0,0210 | |||
| LGND / Ligand Pharmaceuticals Incorporated | 0,00 | 0,00 | 0,37 | −21,32 | 0,3980 | −0,2180 | |||
| VIVO / Meridian Bioscience Inc. | 0,02 | 0,00 | 0,33 | −11,20 | 0,3586 | −0,1344 | |||
| ZIXI / Zix Corp. | 0,04 | 0,00 | 0,32 | −3,32 | 0,3455 | −0,0895 | |||
| FBMS / The First Bancshares, Inc. | 0,01 | 0,00 | 0,31 | 30,80 | 0,3347 | 0,0227 | |||
| PDEX / Pro-Dex, Inc. | 0,01 | 0,00 | 0,30 | −7,93 | 0,3260 | −0,1051 | |||
| REX / REX American Resources Corporation | 0,00 | 0,00 | 0,28 | 5,64 | 0,3030 | −0,0468 | |||
| CHRS / Coherus Oncology, Inc. | 0,02 | 0,00 | 0,27 | −21,47 | 0,2883 | −0,1578 | |||
| MCFT / MasterCraft Boat Holdings, Inc. | 0,01 | 0,22 | 0,2400 | 0,2400 | |||||
| MEI / Methode Electronics, Inc. | 0,00 | 0,00 | 0,22 | 18,68 | 0,2336 | −0,0055 | |||
| ANIP / ANI Pharmaceuticals, Inc. | 0,01 | 0,00 | 0,17 | 16,67 | 0,1818 | −0,0081 | |||
| PCRX / Pacira BioSciences, Inc. | 0,00 | 0,00 | 0,16 | −4,17 | 0,1735 | −0,0475 | |||
| NDLS / Noodles & Company | 0,01 | 0,00 | 0,16 | 42,34 | 0,1711 | 0,0250 | |||
| ASPU / Aspen Group, Inc. | 0,03 | 0,00 | 0,16 | −49,68 | 0,1699 | −0,2404 | |||
| NGS / Natural Gas Services Group, Inc. | 0,02 | 0,00 | 0,15 | 10,29 | 0,1618 | −0,0176 | |||
| PSTL / Postal Realty Trust, Inc. | 0,01 | 0,00 | 0,14 | 23,48 | 0,1534 | 0,0020 | |||
| NVEC / NVE Corporation | 0,00 | 0,00 | 0,13 | 19,81 | 0,1377 | −0,0023 |