Grundläggande statistik
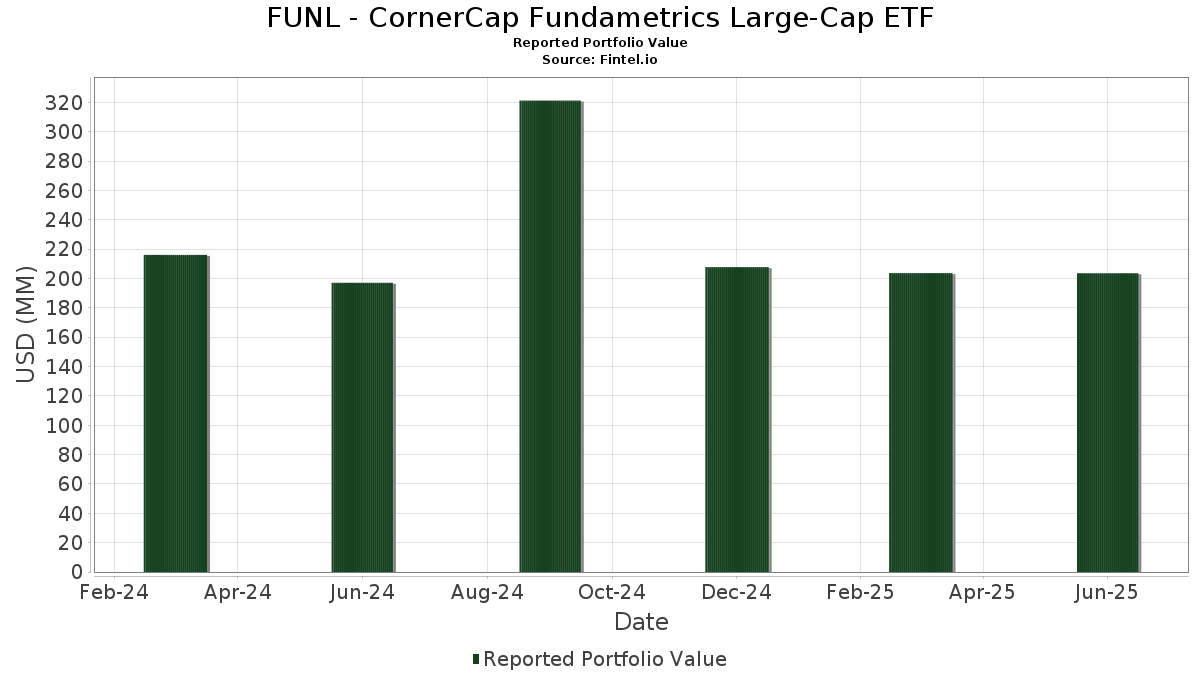
| Portföljvärde | $ 203 587 987 |
| Aktuella positioner | 154 |
Senaste innehav, resultat, förvaltat kapital (från 13F, 13D)
FUNL - CornerCap Fundametrics Large-Cap ETF har redovisat 154 totala innehav i sina senaste SEC-arkiveringar. Det senaste portföljvärdet beräknas vara $ 203 587 987 USD. Faktiskt förvaltade tillgångar (AUM) är detta värde plus likvida medel (som inte redovisas). FUNL - CornerCap Fundametrics Large-Cap ETFs största innehav är Johnson & Johnson (US:JNJ) , First American Funds Inc - First American Government Obligations Fund Class X (US:FGXXX) , Wells Fargo & Company (US:WFC) , Cisco Systems, Inc. (US:CSCO) , and The Walt Disney Company (US:DIS) . FUNL - CornerCap Fundametrics Large-Cap ETFs nya positioner inkluderar GE HealthCare Technologies Inc. (US:GEHC) , PPL Corporation (US:PPL) , PepsiCo, Inc. (US:PEP) , Lennar Corporation (US:LEN) , and Xcel Energy Inc. (US:XEL) .
Största ökningarna detta kvartal
Vi använder förändringen i portföljallokeringen eftersom det är det mest meningsfulla måttet. Förändringar kan bero på transaktioner eller förändringar i aktiekurser.
| Värdepapper | Aktier (MM) |
Värde (MM$) |
Portfölj % av | ΔPortfölj % av |
|---|---|---|---|---|
| 7,88 | 7,88 | 4,0202 | 4,0202 | |
| 3,69 | 3,69 | 1,8838 | 1,6086 | |
| 0,02 | 1,59 | 0,8093 | 0,8093 | |
| 0,04 | 1,51 | 0,7688 | 0,7688 | |
| 0,01 | 1,49 | 0,7581 | 0,7581 | |
| 0,01 | 1,44 | 0,7366 | 0,7366 | |
| 0,02 | 1,38 | 0,7031 | 0,7031 | |
| 0,00 | 1,00 | 0,5084 | 0,5084 | |
| 0,00 | 0,91 | 0,4656 | 0,4656 | |
| 0,01 | 1,74 | 0,8867 | 0,4285 |
Största minskningarna detta kvartal
Vi använder förändringen i portföljallokeringen eftersom det är det mest meningsfulla måttet. Förändringar kan bero på transaktioner eller förändringar i aktiepriser.
| Värdepapper | Aktier (MM) |
Värde (MM$) |
Portfölj % av | ΔPortfölj % av |
|---|---|---|---|---|
| 0,00 | 0,00 | −0,7648 | ||
| 0,00 | 0,75 | 0,3838 | −0,4329 | |
| 0,00 | 2,40 | 1,2231 | −0,3482 | |
| 0,04 | 1,78 | 0,9061 | −0,3443 | |
| 0,02 | 1,41 | 0,7191 | −0,3083 | |
| 0,03 | 2,35 | 1,1971 | −0,2696 | |
| 0,03 | 1,33 | 0,6803 | −0,2667 | |
| 0,02 | 3,73 | 1,9011 | −0,2582 | |
| 0,02 | 1,03 | 0,5234 | −0,2461 | |
| 0,01 | 1,92 | 0,9815 | −0,2193 |
13F- och fond arkiveringar
Denna blankett lämnades in den 2025-08-29 för rapporteringsperioden 2025-06-30. Klicka på länksymbolen för att se hela transaktionshistoriken.
Uppgradera för att låsa upp premiumdata och exportera till Excel![]() .
.
| Värdepapper | Typ | Genomsnittligt aktiepris | Aktier (MM) |
ΔAktier (%) |
ΔAktier (%) |
Värde ($MM) |
Portfölj (%) |
ΔPortfölj (%) |
|
|---|---|---|---|---|---|---|---|---|---|
| Mount Vernon Liquid Assets Portfolio, LLC / STIV (N/A) | 7,88 | 7,88 | 4,0202 | 4,0202 | |||||
| JNJ / Johnson & Johnson | 0,02 | −2,22 | 3,73 | −9,94 | 1,9011 | −0,2582 | |||
| FGXXX / First American Funds Inc - First American Government Obligations Fund Class X | 3,69 | 589,67 | 3,69 | 589,91 | 1,8838 | 1,6086 | |||
| WFC / Wells Fargo & Company | 0,04 | −13,85 | 3,50 | −3,85 | 1,7844 | −0,1142 | |||
| CSCO / Cisco Systems, Inc. | 0,05 | −2,26 | 3,45 | 9,87 | 1,7611 | 0,1217 | |||
| DIS / The Walt Disney Company | 0,02 | −2,30 | 2,85 | 22,76 | 1,4560 | 0,2426 | |||
| JPM / JPMorgan Chase & Co. | 0,01 | −20,62 | 2,48 | −6,21 | 1,2635 | −0,1143 | |||
| META / Meta Platforms, Inc. | 0,00 | −37,82 | 2,40 | −20,37 | 1,2231 | −0,3482 | |||
| COP / ConocoPhillips | 0,03 | −2,29 | 2,35 | −16,52 | 1,1971 | −0,2696 | |||
| C / Citigroup Inc. | 0,03 | −13,09 | 2,31 | 4,19 | 1,1803 | 0,0217 | |||
| BKNG / Booking Holdings Inc. | 0,00 | −1,55 | 2,20 | 23,68 | 1,1227 | 0,1943 | |||
| SCHW / The Charles Schwab Corporation | 0,02 | −2,10 | 2,10 | 14,11 | 1,0696 | 0,1107 | |||
| ABBV / AbbVie Inc. | 0,01 | 21,67 | 2,01 | 7,82 | 1,0281 | 0,0524 | |||
| CVS / CVS Health Corporation | 0,03 | −2,00 | 2,01 | −0,25 | 1,0242 | −0,0259 | |||
| VST / Vistra Corp. | 0,01 | −32,81 | 1,97 | 10,87 | 1,0051 | 0,0778 | |||
| MRK / Merck & Co., Inc. | 0,02 | −2,33 | 1,93 | −13,83 | 0,9825 | −0,1843 | |||
| CVX / Chevron Corporation | 0,01 | −2,31 | 1,92 | −16,39 | 0,9815 | −0,2193 | |||
| CMCSA / Comcast Corporation | 0,05 | −2,45 | 1,85 | −5,65 | 0,9460 | −0,0796 | |||
| HCA / HCA Healthcare, Inc. | 0,00 | −2,13 | 1,78 | 8,48 | 0,9083 | 0,0520 | |||
| BMY / Bristol-Myers Squibb Company | 0,04 | −2,33 | 1,78 | −25,89 | 0,9061 | −0,3443 | |||
| AMD / Advanced Micro Devices, Inc. | 0,01 | 43,33 | 1,74 | 98,06 | 0,8867 | 0,4285 | |||
| MA / Mastercard Incorporated | 0,00 | −0,87 | 1,74 | 1,64 | 0,8856 | −0,0058 | |||
| NTRS / Northern Trust Corporation | 0,01 | −17,63 | 1,72 | 5,83 | 0,8803 | 0,0297 | |||
| V / Visa Inc. | 0,00 | −2,12 | 1,72 | −0,86 | 0,8781 | −0,0278 | |||
| NEM / Newmont Corporation | 0,03 | −2,24 | 1,71 | 18,00 | 0,8733 | 0,1160 | |||
| RF / Regions Financial Corporation | 0,07 | −2,27 | 1,70 | 5,78 | 0,8685 | 0,0286 | |||
| TFC / Truist Financial Corporation | 0,04 | −2,25 | 1,67 | 2,08 | 0,8526 | −0,0015 | |||
| HIG / The Hartford Insurance Group, Inc. | 0,01 | −2,14 | 1,67 | 0,36 | 0,8513 | −0,0166 | |||
| MSFT / Microsoft Corporation | 0,00 | −2,37 | 1,66 | 29,34 | 0,8486 | 0,1776 | |||
| LDOS / Leidos Holdings, Inc. | 0,01 | −2,22 | 1,65 | 14,32 | 0,8437 | 0,0887 | |||
| MO / Altria Group, Inc. | 0,03 | −2,18 | 1,62 | −4,42 | 0,8284 | −0,0584 | |||
| GOOGL / Alphabet Inc. | 0,01 | −2,28 | 1,60 | 11,40 | 0,8176 | 0,0666 | |||
| BAC / Bank of America Corporation | 0,03 | −2,39 | 1,60 | 10,71 | 0,8176 | 0,0620 | |||
| SPGI / S&P Global Inc. | 0,00 | −2,23 | 1,60 | 1,46 | 0,8148 | −0,0067 | |||
| ULTA / Ulta Beauty, Inc. | 0,00 | −2,35 | 1,59 | 24,63 | 0,8136 | 0,1458 | |||
| FNF / Fidelity National Financial, Inc. | 0,03 | −2,07 | 1,59 | −15,61 | 0,8110 | −0,1725 | |||
| PM / Philip Morris International Inc. | 0,01 | −24,79 | 1,59 | −13,71 | 0,8096 | −0,1501 | |||
| GEHC / GE HealthCare Technologies Inc. | 0,02 | 1,59 | 0,8093 | 0,8093 | |||||
| LRCX / Lam Research Corporation | 0,02 | −2,54 | 1,58 | 30,50 | 0,8079 | 0,1746 | |||
| TMUS / T-Mobile US, Inc. | 0,01 | −2,09 | 1,58 | −12,54 | 0,8046 | −0,1364 | |||
| EA / Electronic Arts Inc. | 0,01 | −2,25 | 1,57 | 8,04 | 0,8025 | 0,0425 | |||
| GILD / Gilead Sciences, Inc. | 0,01 | −2,19 | 1,57 | −3,21 | 0,8005 | −0,0457 | |||
| MCO / Moody's Corporation | 0,00 | 89,34 | 1,57 | 104,04 | 0,8002 | 0,3988 | |||
| SYY / Sysco Corporation | 0,02 | −2,22 | 1,55 | −1,34 | 0,7903 | −0,0289 | |||
| MMM / 3M Company | 0,01 | −18,16 | 1,54 | −15,19 | 0,7867 | −0,1619 | |||
| SSNC / SS&C Technologies Holdings, Inc. | 0,02 | 71,22 | 1,54 | 69,72 | 0,7843 | 0,3116 | |||
| CAT / Caterpillar Inc. | 0,00 | −2,40 | 1,53 | 14,88 | 0,7806 | 0,0855 | |||
| ELV / Elevance Health, Inc. | 0,00 | −2,10 | 1,53 | −12,45 | 0,7791 | −0,1312 | |||
| TRV / The Travelers Companies, Inc. | 0,01 | −17,90 | 1,52 | −16,94 | 0,7759 | −0,1798 | |||
| RTX / RTX Corporation | 0,01 | −21,08 | 1,51 | −12,98 | 0,7703 | −0,1355 | |||
| PPL / PPL Corporation | 0,04 | 1,51 | 0,7688 | 0,7688 | |||||
| MET / MetLife, Inc. | 0,02 | −2,28 | 1,50 | −2,09 | 0,7656 | −0,0346 | |||
| BR / Broadridge Financial Solutions, Inc. | 0,01 | 85,98 | 1,49 | 86,50 | 0,7616 | 0,3437 | |||
| PEP / PepsiCo, Inc. | 0,01 | 1,49 | 0,7581 | 0,7581 | |||||
| DUK / Duke Energy Corporation | 0,01 | −2,19 | 1,48 | −5,36 | 0,7568 | −0,0614 | |||
| ADBE / Adobe Inc. | 0,00 | −2,23 | 1,48 | −1,40 | 0,7546 | −0,0281 | |||
| WDAY / Workday, Inc. | 0,01 | 124,33 | 1,47 | 130,61 | 0,7498 | 0,4171 | |||
| PFE / Pfizer Inc. | 0,06 | −2,28 | 1,46 | −6,53 | 0,7457 | −0,0704 | |||
| WTY / Willis Towers Watson Public Limited Company | 0,00 | −2,08 | 1,45 | −11,18 | 0,7422 | −0,1128 | |||
| ACN / Accenture plc | 0,00 | −2,24 | 1,45 | −6,40 | 0,7399 | −0,0684 | |||
| LEN / Lennar Corporation | 0,01 | 1,44 | 0,7366 | 0,7366 | |||||
| EXPE / Expedia Group, Inc. | 0,01 | −10,60 | 1,43 | −10,33 | 0,7317 | −0,1027 | |||
| CTRA / Coterra Energy Inc. | 0,06 | −2,22 | 1,43 | −14,15 | 0,7313 | −0,1399 | |||
| SLB / Schlumberger Limited | 0,04 | 10,56 | 1,43 | −10,58 | 0,7289 | −0,1052 | |||
| DVN / Devon Energy Corporation | 0,04 | 44,28 | 1,42 | 22,69 | 0,7260 | 0,1208 | |||
| ZM / Zoom Communications Inc. | 0,02 | −2,36 | 1,42 | 3,27 | 0,7247 | 0,0064 | |||
| USB / U.S. Bancorp | 0,03 | −2,42 | 1,41 | 4,59 | 0,7215 | 0,0157 | |||
| EBAY / eBay Inc. | 0,02 | −34,87 | 1,41 | −28,37 | 0,7191 | −0,3083 | |||
| LMT / Lockheed Martin Corporation | 0,00 | −2,13 | 1,38 | 1,47 | 0,7058 | −0,0058 | |||
| XEL / Xcel Energy Inc. | 0,02 | 1,38 | 0,7031 | 0,7031 | |||||
| TXT / Textron Inc. | 0,02 | −2,49 | 1,37 | 8,37 | 0,7008 | 0,0392 | |||
| MSCI / MSCI Inc. | 0,00 | −2,22 | 1,37 | −0,29 | 0,6990 | −0,0181 | |||
| TEAM / Atlassian Corporation | 0,01 | −2,30 | 1,36 | −6,52 | 0,6955 | −0,0654 | |||
| CSX / CSX Corporation | 0,04 | −2,49 | 1,34 | 8,06 | 0,6842 | 0,0368 | |||
| VZ / Verizon Communications Inc. | 0,03 | −22,96 | 1,33 | −26,52 | 0,6803 | −0,2667 | |||
| CI / The Cigna Group | 0,00 | −2,30 | 1,32 | −1,86 | 0,6742 | −0,0283 | |||
| TROW / T. Rowe Price Group, Inc. | 0,01 | −2,47 | 1,30 | 2,52 | 0,6650 | 0,0010 | |||
| EOG / EOG Resources, Inc. | 0,01 | −2,39 | 1,30 | −8,97 | 0,6633 | −0,0820 | |||
| NTAP / NetApp, Inc. | 0,01 | −2,64 | 1,30 | 18,16 | 0,6611 | 0,0884 | |||
| OXY / Occidental Petroleum Corporation | 0,03 | −2,35 | 1,29 | −16,90 | 0,6600 | −0,1524 | |||
| KHC / The Kraft Heinz Company | 0,05 | −2,22 | 1,29 | −17,05 | 0,6583 | −0,1534 | |||
| QCOM / QUALCOMM Incorporated | 0,01 | −2,50 | 1,27 | 1,12 | 0,6463 | −0,0078 | |||
| GIS / General Mills, Inc. | 0,02 | −2,25 | 1,26 | −15,35 | 0,6419 | −0,1334 | |||
| PFG / Principal Financial Group, Inc. | 0,02 | −2,41 | 1,25 | −8,14 | 0,6397 | −0,0726 | |||
| KMB / Kimberly-Clark Corporation | 0,01 | −2,30 | 1,22 | −11,43 | 0,6213 | −0,0963 | |||
| CRM / Salesforce, Inc. | 0,00 | −2,43 | 1,21 | −0,90 | 0,6200 | −0,0197 | |||
| MAS / Masco Corporation | 0,02 | −2,46 | 1,21 | −9,72 | 0,6160 | −0,0820 | |||
| TMO / Thermo Fisher Scientific Inc. | 0,00 | −2,19 | 1,19 | −20,35 | 0,6098 | −0,1729 | |||
| FDX / FedEx Corporation | 0,01 | −2,49 | 1,15 | −9,11 | 0,5862 | −0,0733 | |||
| AVY / Avery Dennison Corporation | 0,01 | −2,51 | 1,13 | −3,91 | 0,5774 | −0,0371 | |||
| UPS / United Parcel Service, Inc. | 0,01 | −2,60 | 1,03 | −10,69 | 0,5251 | −0,0758 | |||
| FTV / Fortive Corporation | 0,02 | −2,33 | 1,03 | −30,46 | 0,5234 | −0,2461 | |||
| HOLX / Hologic, Inc. | 0,02 | −2,79 | 1,02 | 2,51 | 0,5218 | 0,0013 | |||
| ETR / Entergy Corporation | 0,01 | −1,96 | 1,01 | −4,62 | 0,5161 | −0,0378 | |||
| AMAT / Applied Materials, Inc. | 0,01 | −3,04 | 1,01 | 22,28 | 0,5156 | 0,0844 | |||
| CEG / Constellation Energy Corporation | 0,00 | −2,35 | 1,01 | 56,45 | 0,5134 | 0,1774 | |||
| Aptiv PLC / EC (JE00BTDN8H13) | 0,01 | −2,15 | 1,00 | 12,09 | 0,5113 | 0,0451 | |||
| COF / Capital One Financial Corporation | 0,00 | 1,00 | 0,5084 | 0,5084 | |||||
| BIIB / Biogen Inc. | 0,01 | −2,68 | 0,99 | −10,64 | 0,5060 | −0,0735 | |||
| VEEV / Veeva Systems Inc. | 0,00 | −2,21 | 0,97 | 21,64 | 0,4938 | 0,0783 | |||
| CTVA / Corteva, Inc. | 0,01 | −2,17 | 0,95 | 15,94 | 0,4865 | 0,0570 | |||
| KR / The Kroger Co. | 0,01 | −2,03 | 0,94 | 3,85 | 0,4820 | 0,0071 | |||
| TGT / Target Corporation | 0,01 | −2,80 | 0,94 | −8,08 | 0,4818 | −0,0546 | |||
| WAB / Westinghouse Air Brake Technologies Corporation | 0,00 | −2,12 | 0,92 | 13,05 | 0,4687 | 0,0444 | |||
| ZBRA / Zebra Technologies Corporation | 0,00 | 0,91 | 0,4656 | 0,4656 | |||||
| MS / Morgan Stanley | 0,01 | −2,27 | 0,90 | 18,05 | 0,4574 | 0,0608 | |||
| TJX / The TJX Companies, Inc. | 0,01 | −2,04 | 0,87 | −0,68 | 0,4448 | −0,0133 | |||
| PNR / Pentair plc | 0,01 | −2,28 | 0,85 | 14,61 | 0,4327 | 0,0467 | |||
| TER / Teradyne, Inc. | 0,01 | 60,85 | 0,82 | 75,21 | 0,4190 | 0,1742 | |||
| NI / NiSource Inc. | 0,02 | −2,18 | 0,81 | −1,58 | 0,4140 | −0,0163 | |||
| NOW / ServiceNow, Inc. | 0,00 | −2,11 | 0,81 | 26,41 | 0,4129 | 0,0787 | |||
| LHX / L3Harris Technologies, Inc. | 0,00 | 0,81 | 0,4109 | 0,4109 | |||||
| TE Connectivity PLC / EC (IE000IVNQZ81) | 0,00 | −2,32 | 0,80 | 16,59 | 0,4089 | 0,0501 | |||
| CRBG / Corebridge Financial, Inc. | 0,02 | −2,36 | 0,80 | 9,92 | 0,4073 | 0,0278 | |||
| HON / Honeywell International Inc. | 0,00 | −2,21 | 0,80 | 7,58 | 0,4059 | 0,0198 | |||
| D / Dominion Energy, Inc. | 0,01 | −2,21 | 0,78 | −1,39 | 0,3987 | −0,0150 | |||
| DD / DuPont de Nemours, Inc. | 0,01 | 27,97 | 0,77 | 17,50 | 0,3943 | 0,0511 | |||
| UNH / UnitedHealth Group Incorporated | 0,00 | 0,77 | 0,3912 | 0,3912 | |||||
| EVRG / Evergy, Inc. | 0,01 | −2,19 | 0,76 | −2,31 | 0,3893 | −0,0180 | |||
| FI / Fiserv, Inc. | 0,00 | 0,76 | 0,3872 | 0,3872 | |||||
| CMI / Cummins Inc. | 0,00 | −2,20 | 0,76 | 2,30 | 0,3864 | −0,0004 | |||
| DOV / Dover Corporation | 0,00 | −53,91 | 0,75 | −51,98 | 0,3838 | −0,4329 | |||
| CTSH / Cognizant Technology Solutions Corporation | 0,01 | −2,29 | 0,74 | −0,27 | 0,3769 | −0,0100 | |||
| APP / AppLovin Corporation | 0,00 | −31,32 | 0,74 | −9,25 | 0,3757 | −0,0478 | |||
| LAMR / Lamar Advertising Company | 0,01 | −2,25 | 0,72 | 4,34 | 0,3681 | 0,0069 | |||
| WPC / W. P. Carey Inc. | 0,01 | −2,25 | 0,72 | −3,38 | 0,3652 | −0,0215 | |||
| AIG / American International Group, Inc. | 0,01 | −2,24 | 0,71 | −3,78 | 0,3642 | −0,0229 | |||
| LYB / LyondellBasell Industries N.V. | 0,01 | −3,09 | 0,71 | −20,41 | 0,3606 | −0,1025 | |||
| FR / First Industrial Realty Trust, Inc. | 0,01 | −2,24 | 0,68 | −12,80 | 0,3478 | −0,0602 | |||
| NNN / NNN REIT, Inc. | 0,02 | −2,32 | 0,68 | −1,02 | 0,3456 | −0,0119 | |||
| TSN / Tyson Foods, Inc. | 0,01 | −2,21 | 0,67 | −14,36 | 0,3443 | −0,0666 | |||
| O / Realty Income Corporation | 0,01 | −2,30 | 0,66 | −3,07 | 0,3382 | −0,0184 | |||
| HD / The Home Depot, Inc. | 0,00 | −2,38 | 0,66 | −2,36 | 0,3381 | −0,0160 | |||
| MAA / Mid-America Apartment Communities, Inc. | 0,00 | −2,20 | 0,65 | −13,65 | 0,3296 | −0,0607 | |||
| MDT / Medtronic plc | 0,01 | −2,38 | 0,63 | −5,40 | 0,3224 | −0,0259 | |||
| ELS / Equity LifeStyle Properties, Inc. | 0,01 | −2,26 | 0,63 | −9,74 | 0,3219 | −0,0425 | |||
| MPC / Marathon Petroleum Corporation | 0,00 | −2,70 | 0,61 | 10,91 | 0,3117 | 0,0243 | |||
| NBIX / Neurocrine Biosciences, Inc. | 0,00 | −2,68 | 0,61 | 10,51 | 0,3117 | 0,0234 | |||
| PINS / Pinterest, Inc. | 0,02 | −2,81 | 0,60 | 12,50 | 0,3081 | 0,0278 | |||
| GLPI / Gaming and Leisure Properties, Inc. | 0,01 | −2,31 | 0,60 | −10,43 | 0,3070 | −0,0435 | |||
| CUBE / CubeSmart | 0,01 | −2,45 | 0,60 | −2,93 | 0,3046 | −0,0164 | |||
| NXPI / NXP Semiconductors N.V. | 0,00 | −2,60 | 0,58 | 11,95 | 0,2967 | 0,0256 | |||
| SBAC / SBA Communications Corporation | 0,00 | −2,42 | 0,58 | 4,15 | 0,2947 | 0,0053 | |||
| HST / Host Hotels & Resorts, Inc. | 0,04 | −2,63 | 0,56 | 5,25 | 0,2864 | 0,0080 | |||
| OC / Owens Corning | 0,00 | −2,56 | 0,52 | −6,27 | 0,2674 | −0,0241 | |||
| BBY / Best Buy Co., Inc. | 0,01 | −2,65 | 0,52 | −11,22 | 0,2664 | −0,0406 | |||
| AKAM / Akamai Technologies, Inc. | 0,01 | −2,79 | 0,46 | −3,77 | 0,2351 | −0,0146 | |||
| CAG / Conagra Brands, Inc. | 0,02 | −2,50 | 0,44 | −25,08 | 0,2256 | −0,0828 | |||
| AMT / American Tower Corporation | 0,00 | 0,38 | 0,1929 | 0,1929 | |||||
| VICI / VICI Properties Inc. | 0,01 | −2,21 | 0,37 | −2,14 | 0,1870 | −0,0087 | |||
| EQIX / Equinix, Inc. | 0,00 | 0,32 | 0,1640 | 0,1640 | |||||
| ADC / Agree Realty Corporation | 0,00 | −2,23 | 0,32 | −7,25 | 0,1633 | −0,0172 | |||
| RAL / Ralliant Corporation | 0,01 | 0,32 | 0,1623 | 0,1623 | |||||
| KIM / Kimco Realty Corporation | 0,01 | −2,39 | 0,31 | −3,38 | 0,1604 | −0,0095 | |||
| DASH / DoorDash, Inc. | 0,00 | −100,00 | 0,00 | −100,00 | −0,7648 |