Grundläggande statistik
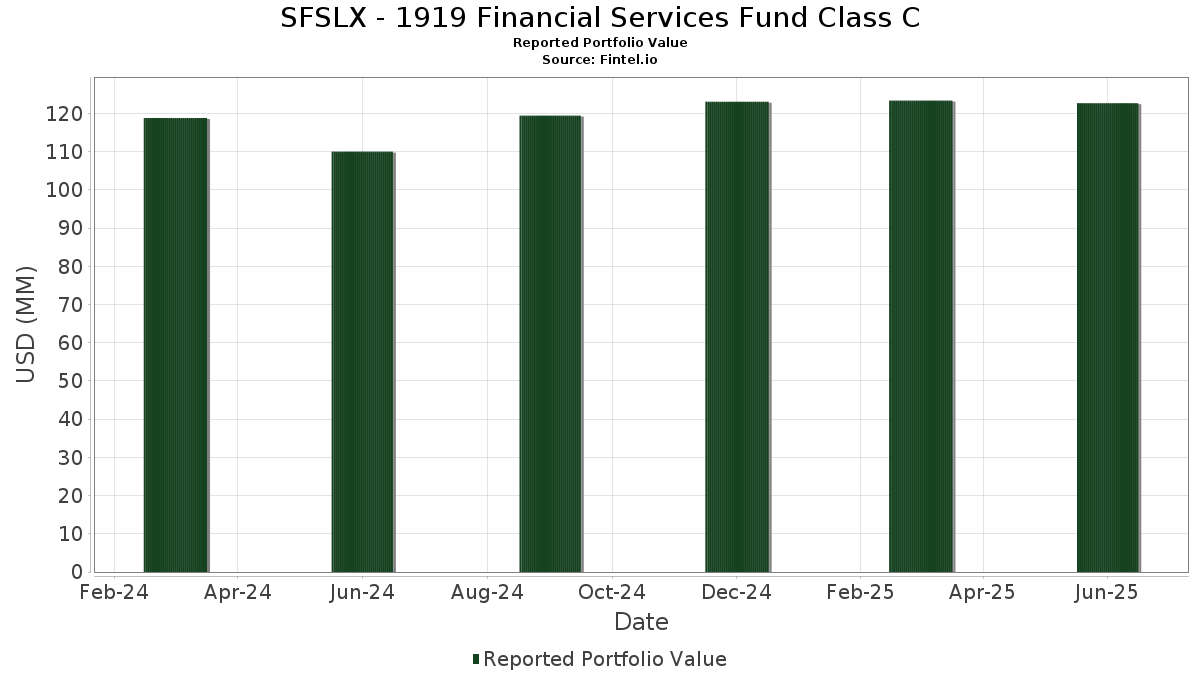
| Portföljvärde | $ 122 692 622 |
| Aktuella positioner | 41 |
Senaste innehav, resultat, förvaltat kapital (från 13F, 13D)
SFSLX - 1919 Financial Services Fund Class C har redovisat 41 totala innehav i sina senaste SEC-arkiveringar. Det senaste portföljvärdet beräknas vara $ 122 692 622 USD. Faktiskt förvaltade tillgångar (AUM) är detta värde plus likvida medel (som inte redovisas). SFSLX - 1919 Financial Services Fund Class Cs största innehav är JPMorgan Chase & Co. (US:JPM) , Chubb Limited (US:CB) , Visa Inc. (US:V) , Coastal Financial Corporation (US:CCB) , and Intercontinental Exchange, Inc. (US:ICE) . SFSLX - 1919 Financial Services Fund Class Cs nya positioner inkluderar The Progressive Corporation (US:PGR) , .
Största ökningarna detta kvartal
Vi använder förändringen i portföljallokeringen eftersom det är det mest meningsfulla måttet. Förändringar kan bero på transaktioner eller förändringar i aktiekurser.
| Värdepapper | Aktier (MM) |
Värde (MM$) |
Portfölj % av | ΔPortfölj % av |
|---|---|---|---|---|
| 0,04 | 11,29 | 9,2291 | 1,4794 | |
| 0,02 | 1,41 | 1,1530 | 0,6225 | |
| 0,01 | 1,23 | 1,0064 | 0,5506 | |
| 0,11 | 5,38 | 4,3986 | 0,5491 | |
| 0,00 | 0,67 | 0,5454 | 0,5454 | |
| 0,01 | 4,93 | 4,0297 | 0,4024 | |
| 0,05 | 3,59 | 2,9362 | 0,3883 | |
| 0,03 | 2,97 | 2,4314 | 0,3612 | |
| 0,06 | 5,83 | 4,7676 | 0,3517 | |
| 0,01 | 0,92 | 0,7510 | 0,3417 |
Största minskningarna detta kvartal
Vi använder förändringen i portföljallokeringen eftersom det är det mest meningsfulla måttet. Förändringar kan bero på transaktioner eller förändringar i aktiepriser.
| Värdepapper | Aktier (MM) |
Värde (MM$) |
Portfölj % av | ΔPortfölj % av |
|---|---|---|---|---|
| 0,02 | 3,90 | 3,1898 | −0,8648 | |
| 1,55 | 1,55 | 1,2673 | −0,6886 | |
| 0,04 | 4,49 | 3,6710 | −0,4167 | |
| 0,01 | 5,10 | 4,1699 | −0,3671 | |
| 0,02 | 1,92 | 1,5705 | −0,3362 | |
| 0,01 | 2,56 | 2,0928 | −0,2253 | |
| 0,02 | 7,23 | 5,9091 | −0,2035 | |
| 0,06 | 3,80 | 3,1090 | −0,1318 | |
| 0,02 | 1,24 | 1,0169 | −0,1210 | |
| 0,01 | 1,51 | 1,2368 | −0,0640 |
13F- och fond arkiveringar
Denna blankett lämnades in den 2025-08-29 för rapporteringsperioden 2025-06-30. Klicka på länksymbolen för att se hela transaktionshistoriken.
Uppgradera för att låsa upp premiumdata och exportera till Excel![]() .
.
| Värdepapper | Typ | Genomsnittligt aktiepris | Aktier (MM) |
ΔAktier (%) |
ΔAktier (%) |
Värde ($MM) |
Portfölj (%) |
ΔPortfölj (%) |
|
|---|---|---|---|---|---|---|---|---|---|
| JPM / JPMorgan Chase & Co. | 0,04 | 0,00 | 11,29 | 18,19 | 9,2291 | 1,4794 | |||
| CB / Chubb Limited | 0,02 | 0,00 | 7,23 | −4,07 | 5,9091 | −0,2035 | |||
| V / Visa Inc. | 0,02 | 0,00 | 6,75 | 1,31 | 5,5151 | 0,1126 | |||
| CCB / Coastal Financial Corporation | 0,06 | 0,00 | 5,83 | 7,15 | 4,7676 | 0,3517 | |||
| ICE / Intercontinental Exchange, Inc. | 0,03 | 0,00 | 5,75 | 6,36 | 4,7046 | 0,3149 | |||
| BAC / Bank of America Corporation | 0,11 | 0,00 | 5,38 | 13,41 | 4,3986 | 0,5491 | |||
| BRK.B / Berkshire Hathaway Inc. | 0,01 | 0,00 | 5,10 | −8,80 | 4,1699 | −0,3671 | |||
| AMP / Ameriprise Financial, Inc. | 0,01 | 0,00 | 4,93 | 10,25 | 4,0297 | 0,4024 | |||
| BRO / Brown & Brown, Inc. | 0,04 | 0,00 | 4,49 | −10,88 | 3,6710 | −0,4167 | |||
| FI / Fiserv, Inc. | 0,02 | 0,00 | 3,90 | −21,93 | 3,1898 | −0,8648 | |||
| QCRH / QCR Holdings, Inc. | 0,06 | 0,00 | 3,80 | −4,81 | 3,1090 | −0,1318 | |||
| FITB / Fifth Third Bancorp | 0,09 | 0,00 | 3,63 | 4,91 | 2,9691 | 0,1608 | |||
| SYBT / Stock Yards Bancorp, Inc. | 0,05 | 0,00 | 3,59 | 14,36 | 2,9362 | 0,3883 | |||
| BANR / Banner Corporation | 0,05 | 0,00 | 3,19 | 0,60 | 2,6050 | 0,0351 | |||
| PNC / The PNC Financial Services Group, Inc. | 0,02 | 0,00 | 3,12 | 6,09 | 2,5508 | 0,1640 | |||
| VRSK / Verisk Analytics, Inc. | 0,01 | 0,00 | 3,12 | 4,67 | 2,5466 | 0,1320 | |||
| SCHW / The Charles Schwab Corporation | 0,03 | 0,00 | 2,97 | 16,58 | 2,4314 | 0,3612 | |||
| FIS / Fidelity National Information Services, Inc. | 0,03 | 0,00 | 2,83 | 9,02 | 2,3130 | 0,2073 | |||
| MTB / M&T Bank Corporation | 0,01 | 0,00 | 2,79 | 8,51 | 2,2838 | 0,1954 | |||
| MMC / Marsh & McLennan Companies, Inc. | 0,01 | 0,00 | 2,56 | −10,43 | 2,0928 | −0,2253 | |||
| SPGI / S&P Global Inc. | 0,00 | 0,00 | 2,32 | 3,80 | 1,8968 | 0,0829 | |||
| SSB / SouthState Corporation | 0,02 | 0,00 | 2,22 | −0,85 | 1,8114 | −0,0017 | |||
| WBS / Webster Financial Corporation | 0,04 | 0,00 | 2,21 | 5,94 | 1,8094 | 0,1140 | |||
| RGA / Reinsurance Group of America, Incorporated | 0,01 | 0,00 | 2,14 | 0,75 | 1,7480 | 0,0260 | |||
| IIIV / i3 Verticals, Inc. | 0,08 | 0,00 | 2,09 | 11,37 | 1,7070 | 0,1862 | |||
| THG / The Hanover Insurance Group, Inc. | 0,01 | 0,00 | 2,09 | −2,34 | 1,7058 | −0,0277 | |||
| GPN / Global Payments Inc. | 0,02 | 0,00 | 1,92 | −18,30 | 1,5705 | −0,3362 | |||
| SMBK / SmartFinancial, Inc. | 0,06 | 0,00 | 1,87 | 8,66 | 1,5284 | 0,1328 | |||
| CME / CME Group Inc. | 0,01 | 0,00 | 1,74 | 3,89 | 1,4196 | 0,0636 | |||
| FIGXX / Fidelity Colchester Street Trust - Fidelity Institutional Money Market Funds Government Portfolio Class I | 1,55 | −35,70 | 1,55 | −35,68 | 1,2673 | −0,6886 | |||
| GL / Globe Life Inc. | 0,01 | 0,00 | 1,51 | −5,68 | 1,2368 | −0,0640 | |||
| CBU / Community Financial System, Inc. | 0,02 | 115,65 | 1,41 | 115,93 | 1,1530 | 0,6225 | |||
| TRNO / Terreno Realty Corporation | 0,02 | 0,00 | 1,24 | −11,34 | 1,0169 | −0,1210 | |||
| ACGL / Arch Capital Group Ltd. | 0,01 | 131,47 | 1,23 | 119,25 | 1,0064 | 0,5506 | |||
| RLI / RLI Corp. | 0,01 | 102,55 | 0,92 | 82,14 | 0,7510 | 0,3417 | |||
| SPG / Simon Property Group, Inc. | 0,01 | 0,00 | 0,92 | −3,17 | 0,7491 | −0,0189 | |||
| TBBK / The Bancorp, Inc. | 0,01 | 0,00 | 0,76 | 7,79 | 0,6227 | 0,0495 | |||
| FAF / First American Financial Corporation | 0,01 | 0,00 | 0,68 | −6,38 | 0,5521 | −0,0336 | |||
| PGR / The Progressive Corporation | 0,00 | 0,67 | 0,5454 | 0,5454 | |||||
| AMAL / Amalgamated Financial Corp. | 0,02 | 0,00 | 0,58 | 8,66 | 0,4719 | 0,0404 | |||
| COLB / Columbia Banking System, Inc. | 0,02 | 0,00 | 0,39 | −6,10 | 0,3149 | −0,0185 |