Grundläggande statistik
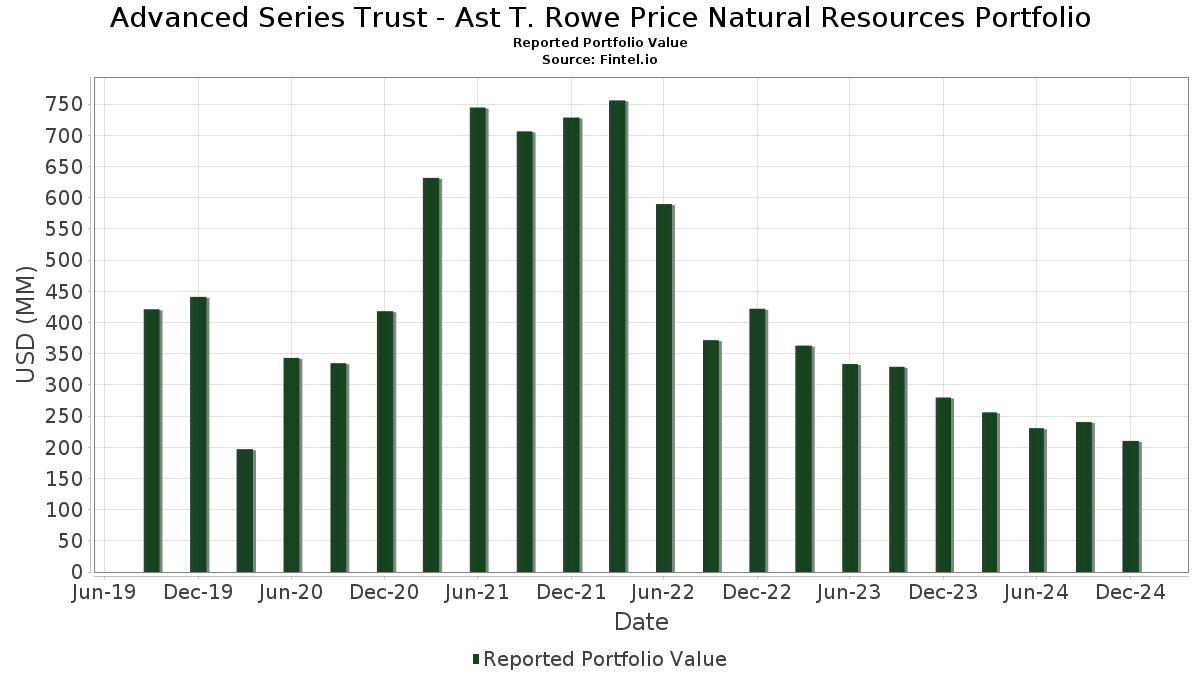
| Portföljvärde | $ 210 116 739 |
| Aktuella positioner | 92 |
Senaste innehav, resultat, förvaltat kapital (från 13F, 13D)
Advanced Series Trust - Ast T. Rowe Price Natural Resources Portfolio har redovisat 92 totala innehav i sina senaste SEC-arkiveringar. Det senaste portföljvärdet beräknas vara $ 210 116 739 USD. Faktiskt förvaltade tillgångar (AUM) är detta värde plus likvida medel (som inte redovisas). Advanced Series Trust - Ast T. Rowe Price Natural Resources Portfolios största innehav är Exxon Mobil Corporation (US:XOM) , ConocoPhillips (US:COP) , Shell plc (GB:SHEL) , Chevron Corporation (US:CVX) , and The Williams Companies, Inc. (US:WMB) . Advanced Series Trust - Ast T. Rowe Price Natural Resources Portfolios nya positioner inkluderar ONEOK, Inc. (US:OKE) , Ovintiv Inc. (US:OVV) , South Bow Corporation (US:SOBO) , Texas Pacific Land Corporation (US:TPL) , and Constellation Energy Corporation (US:CEG) .
Största ökningarna detta kvartal
Vi använder förändringen i portföljallokeringen eftersom det är det mest meningsfulla måttet. Förändringar kan bero på transaktioner eller förändringar i aktiekurser.
| Värdepapper | Aktier (MM) |
Värde (MM$) |
Portfölj % av | ΔPortfölj % av |
|---|---|---|---|---|
| 17,05 | 17,04 | 8,7913 | 8,7913 | |
| 0,04 | 3,71 | 1,9162 | 1,9162 | |
| 0,04 | 1,70 | 0,8753 | 0,8753 | |
| 0,03 | 3,04 | 1,5698 | 0,8549 | |
| 0,03 | 3,36 | 1,7344 | 0,8404 | |
| 0,04 | 6,45 | 3,3251 | 0,7611 | |
| 0,05 | 1,26 | 0,6479 | 0,6479 | |
| 0,00 | 1,16 | 0,5967 | 0,5967 | |
| 0,02 | 1,00 | 0,5177 | 0,5177 | |
| 0,00 | 0,96 | 0,4962 | 0,4962 |
Största minskningarna detta kvartal
Vi använder förändringen i portföljallokeringen eftersom det är det mest meningsfulla måttet. Förändringar kan bero på transaktioner eller förändringar i aktiepriser.
| Värdepapper | Aktier (MM) |
Värde (MM$) |
Portfölj % av | ΔPortfölj % av |
|---|---|---|---|---|
| 0,01 | 5,28 | 2,7244 | −0,7769 | |
| 0,08 | 1,88 | 0,9691 | −0,7335 | |
| 0,10 | 10,96 | 5,6560 | −0,6802 | |
| 0,09 | 4,83 | 2,4915 | −0,4889 | |
| 0,10 | 4,18 | 2,1579 | −0,4879 | |
| 0,00 | 0,53 | 0,2712 | −0,3842 | |
| 0,03 | 4,02 | 2,0712 | −0,3075 | |
| 0,06 | 2,47 | 1,2750 | −0,2845 | |
| 0,02 | 1,39 | 0,7190 | −0,2391 | |
| 0,04 | 0,64 | 0,3312 | −0,2120 |
13F- och fond arkiveringar
Denna blankett lämnades in den 2025-02-27 för rapporteringsperioden 2024-12-31. Klicka på länksymbolen för att se hela transaktionshistoriken.
Uppgradera för att låsa upp premiumdata och exportera till Excel![]() .
.
| Värdepapper | Typ | Genomsnittligt aktiepris | Aktier (MM) |
ΔAktier (%) |
ΔAktier (%) |
Värde ($MM) |
Portfölj (%) |
ΔPortfölj (%) |
|
|---|---|---|---|---|---|---|---|---|---|
| PGIM Institutional Money Market Fund - D / STIV (000000000) | 17,05 | 17,04 | 8,7913 | 8,7913 | |||||
| XOM / Exxon Mobil Corporation | 0,10 | −15,27 | 10,96 | −22,25 | 5,6560 | −0,6802 | |||
| COP / ConocoPhillips | 0,08 | −8,09 | 8,19 | −13,42 | 4,2257 | −0,0261 | |||
| SHEL / Shell plc | 0,24 | 3,43 | 7,40 | −0,62 | 3,8153 | 0,4710 | |||
| CVX / Chevron Corporation | 0,04 | 14,86 | 6,45 | 12,97 | 3,3251 | 0,7611 | |||
| WMB / The Williams Companies, Inc. | 0,10 | −14,68 | 5,60 | 1,16 | 2,8862 | 0,4007 | |||
| LIN / Linde plc | 0,01 | −22,80 | 5,28 | −32,22 | 2,7244 | −0,7769 | |||
| EOG / EOG Resources, Inc. | 0,04 | −6,99 | 5,01 | −7,26 | 2,5845 | 0,1571 | |||
| TTE / TotalEnergies SE - Depositary Receipt (Common Stock) | 0,09 | −15,13 | 4,83 | −27,17 | 2,4915 | −0,4889 | |||
| CNQ / Canadian Natural Resources Limited | 0,14 | −8,84 | 4,19 | −15,24 | 2,1602 | −0,0600 | |||
| ENB / Enbridge Inc. | 0,10 | −32,00 | 4,18 | −28,96 | 2,1579 | −0,4879 | |||
| TRGP / Targa Resources Corp. | 0,02 | −13,08 | 4,09 | 4,82 | 2,1105 | 0,3567 | |||
| MPC / Marathon Petroleum Corporation | 0,03 | −11,42 | 4,02 | −24,15 | 2,0712 | −0,3075 | |||
| SLB / Schlumberger Limited | 0,10 | −5,80 | 3,82 | −13,90 | 1,9690 | −0,0232 | |||
| OKE / ONEOK, Inc. | 0,04 | 3,71 | 1,9162 | 1,9162 | |||||
| FANG / Diamondback Energy, Inc. | 0,02 | −7,70 | 3,41 | −12,30 | 1,7614 | 0,0121 | |||
| EQT / EQT Corporation | 0,07 | −10,84 | 3,36 | 12,22 | 1,7346 | 0,3879 | |||
| CHK / Chesapeake Energy Corporation | 0,03 | 39,63 | 3,36 | 69,03 | 1,7344 | 0,8404 | |||
| VLO / Valero Energy Corporation | 0,03 | −6,96 | 3,36 | −15,51 | 1,7332 | −0,0542 | |||
| SU / Suncor Energy Inc. | 0,09 | −11,19 | 3,26 | −14,13 | 1,6839 | −0,0241 | |||
| CCJ / Cameco Corporation | 0,06 | −7,35 | 3,06 | −0,29 | 1,5771 | 0,1991 | |||
| PSX / Phillips 66 | 0,03 | 120,72 | 3,04 | 91,38 | 1,5698 | 0,8549 | |||
| SHW / The Sherwin-Williams Company | 0,01 | −12,73 | 2,99 | −22,27 | 1,5411 | −0,1861 | |||
| BKR / Baker Hughes Company | 0,07 | −5,30 | 2,98 | 7,47 | 1,5368 | 0,2911 | |||
| FTI / TechnipFMC plc | 0,10 | −16,05 | 2,93 | −7,37 | 1,5102 | 0,0899 | |||
| AIQUY / L'Air Liquide S.A. - Depositary Receipt (Common Stock) | 0,02 | −7,19 | 2,71 | −21,88 | 1,3961 | −0,1605 | |||
| FCX / Freeport-McMoRan Inc. | 0,06 | −6,64 | 2,47 | −28,79 | 1,2750 | −0,2845 | |||
| RRC / Range Resources Corporation | 0,07 | −3,83 | 2,46 | 12,49 | 1,2687 | 0,2862 | |||
| SHECY / Shin-Etsu Chemical Co., Ltd. - Depositary Receipt (Common Stock) | 0,07 | −5,33 | 2,34 | −25,40 | 1,2063 | −0,2021 | |||
| GLPEY / Galp Energia, SGPS, S.A. - Depositary Receipt (Common Stock) | 0,14 | −6,75 | 2,27 | −17,45 | 1,1693 | −0,0643 | |||
| PKG / Packaging Corporation of America | 0,01 | −9,76 | 2,17 | −5,65 | 1,1199 | 0,0856 | |||
| NEE / NextEra Energy, Inc. | 0,03 | −13,44 | 1,98 | −26,59 | 1,0215 | −0,1907 | |||
| WFG / West Fraser Timber Co. Ltd. | 0,02 | −5,70 | 1,96 | −16,13 | 1,0114 | −0,0391 | |||
| GEV / GE Vernova Inc. | 0,01 | −41,47 | 1,91 | −24,52 | 0,9851 | −0,1513 | |||
| VMC / Vulcan Materials Company | 0,01 | −3,57 | 1,88 | −1,00 | 0,9718 | 0,1171 | |||
| BHPLF / BHP Group Limited | 0,08 | −36,90 | 1,88 | −50,44 | 0,9691 | −0,7335 | |||
| LPX / Louisiana-Pacific Corporation | 0,02 | −13,92 | 1,75 | −17,03 | 0,9049 | −0,0454 | |||
| PR / Permian Resources Corporation | 0,12 | 4,54 | 1,72 | 10,46 | 0,8887 | 0,1878 | |||
| OVV / Ovintiv Inc. | 0,04 | 1,70 | 0,8753 | 0,8753 | |||||
| TECK / Teck Resources Limited | 0,04 | −4,85 | 1,48 | −26,21 | 0,7614 | −0,1370 | |||
| IFF / International Flavors & Fragrances Inc. | 0,02 | −4,43 | 1,47 | −23,00 | 0,7602 | −0,0997 | |||
| AGI / Alamos Gold Inc. | 0,08 | −24,96 | 1,47 | −30,62 | 0,7577 | −0,1934 | |||
| IP / International Paper Company | 0,03 | −5,00 | 1,47 | 4,64 | 0,7564 | 0,1269 | |||
| VNOM / Viper Energy, Inc. | 0,03 | 1,99 | 1,46 | 10,93 | 0,7539 | 0,1620 | |||
| STLD / Steel Dynamics, Inc. | 0,01 | −4,66 | 1,41 | −13,75 | 0,7283 | −0,0072 | |||
| SO / The Southern Company | 0,02 | −4,26 | 1,40 | −12,62 | 0,7221 | 0,0023 | |||
| CF / CF Industries Holdings, Inc. | 0,02 | −34,26 | 1,39 | −34,66 | 0,7190 | −0,2391 | |||
| PWR / Quanta Services, Inc. | 0,00 | −11,79 | 1,34 | −6,50 | 0,6903 | 0,0472 | |||
| FNV / Franco-Nevada Corporation | 0,01 | −4,44 | 1,34 | −9,61 | 0,6889 | 0,0252 | |||
| RPM / RPM International Inc. | 0,01 | −22,44 | 1,33 | −21,15 | 0,6870 | −0,0717 | |||
| KMI / Kinder Morgan, Inc. | 0,05 | −3,99 | 1,27 | 19,08 | 0,6570 | 0,1764 | |||
| SOBO / South Bow Corporation | 0,05 | 1,26 | 0,6479 | 0,6479 | |||||
| BAS / Leverage Shares Plc - Corporate Bond/Note | 0,03 | 43,78 | 1,25 | 18,99 | 0,6466 | 0,1731 | |||
| OR / OR Royalties Inc. | 0,07 | −14,36 | 1,25 | −16,33 | 0,6453 | −0,0261 | |||
| SBGSY / Schneider Electric S.E. - Depositary Receipt (Common Stock) | 0,00 | −3,13 | 1,23 | −8,55 | 0,6349 | 0,0303 | |||
| KGS / Kodiak Gas Services, Inc. | 0,03 | 11,15 | 1,22 | 56,52 | 0,6319 | 0,2801 | |||
| TS / Tenaris S.A. - Depositary Receipt (Common Stock) | 0,03 | −13,33 | 1,20 | 3,09 | 0,6201 | 0,0958 | |||
| AESI / Atlas Energy Solutions Inc. | 0,05 | 4,85 | 1,19 | 6,65 | 0,6119 | 0,1123 | |||
| TPL / Texas Pacific Land Corporation | 0,00 | 1,16 | 0,5967 | 0,5967 | |||||
| GLCNF / Glencore plc | 0,26 | −4,79 | 1,14 | −26,76 | 0,5860 | −0,1111 | |||
| HCC / Warrior Met Coal, Inc. | 0,02 | −3,30 | 1,10 | −17,96 | 0,5658 | −0,0347 | |||
| WFRD / Weatherford International plc | 0,02 | 3,38 | 1,09 | −12,82 | 0,5615 | 0,0006 | |||
| AEM / Agnico Eagle Mines Limited | 0,01 | −24,87 | 1,08 | −27,06 | 0,5576 | −0,1083 | |||
| HES / Hess Corporation | 0,01 | −8,02 | 1,06 | −9,91 | 0,5492 | 0,0182 | |||
| HAL / Halliburton Company | 0,04 | −21,74 | 1,06 | −26,80 | 0,5471 | −0,1036 | |||
| PCG / PG&E Corporation | 0,05 | −5,61 | 1,06 | −3,73 | 0,5462 | 0,0524 | |||
| UEC / Uranium Energy Corp. | 0,16 | −5,29 | 1,05 | 2,04 | 0,5429 | 0,0794 | |||
| SWK / Stanley Black & Decker, Inc. | 0,01 | −5,33 | 1,05 | −31,04 | 0,5426 | −0,1422 | |||
| ENTG / Entegris, Inc. | 0,01 | 15,10 | 1,03 | 1,38 | 0,5293 | 0,0742 | |||
| MMPI / Champion Iron Limited | 0,29 | 10,49 | 1,03 | −22,05 | 0,5289 | −0,0620 | |||
| MP / MP Materials Corp. | 0,06 | −4,63 | 1,01 | −15,66 | 0,5195 | −0,0174 | |||
| CTVA / Corteva, Inc. | 0,02 | 1,00 | 0,5177 | 0,5177 | |||||
| NE / Noble Corporation plc | 0,03 | −5,88 | 1,00 | −18,29 | 0,5168 | −0,0337 | |||
| CLF / Cleveland-Cliffs Inc. | 0,10 | 1,48 | 0,99 | −25,32 | 0,5086 | −0,0845 | |||
| CEG / Constellation Energy Corporation | 0,00 | 0,96 | 0,4962 | 0,4962 | |||||
| MOS / The Mosaic Company | 0,04 | −6,19 | 0,91 | −13,87 | 0,4681 | −0,0055 | |||
| FUL / H.B. Fuller Company | 0,01 | −23,84 | 0,82 | −35,31 | 0,4219 | −0,1458 | |||
| AAM / Anglo American plc | 0,03 | 15,02 | 0,82 | 7,65 | 0,4210 | 0,0677 | |||
| (PIPA070) PGIM Core Government Money Market Fund / STIV (000000000) | 0,78 | 0,78 | 0,4013 | 0,4013 | |||||
| XPRO / Expro Group Holdings N.V. | 0,06 | 4,12 | 0,78 | −24,37 | 0,4003 | −0,0608 | |||
| AGCO / AGCO Corporation | 0,01 | 0,77 | 0,3954 | 0,3954 | |||||
| AEE / Ameren Corporation | 0,01 | −16,94 | 0,73 | −15,36 | 0,3784 | −0,0110 | |||
| IE / Ivanhoe Electric Inc. | 0,09 | 13,05 | 0,71 | 1,00 | 0,3663 | 0,0500 | |||
| IVPAF / Ivanhoe Mines Ltd. | 0,06 | −5,24 | 0,67 | −24,47 | 0,3476 | −0,0530 | |||
| HUN / Huntsman Corporation | 0,04 | −28,72 | 0,64 | −46,90 | 0,3312 | −0,2120 | |||
| X / United States Steel Corporation | 0,02 | 0,61 | 0,3156 | 0,3156 | |||||
| SCCO / Southern Copper Corporation | 0,01 | −20,31 | 0,61 | −37,20 | 0,3152 | −0,1221 | |||
| NRG / NRG Energy, Inc. | 0,01 | 0,61 | 0,3134 | 0,3134 | |||||
| HUBB / Hubbell Incorporated | 0,00 | −63,14 | 0,53 | −63,99 | 0,2712 | −0,3842 | |||
| ARTG / Artemis Gold Inc. | 0,04 | 85,34 | 0,43 | 84,85 | 0,2204 | 0,1165 | |||
| SKE / Skeena Resources Limited | 0,05 | 79,86 | 0,41 | 84,30 | 0,2122 | 0,1118 | |||
| AA / Alcoa Corporation | 0,01 | −59,73 | 0,27 | −60,58 | 0,1404 | −0,1698 |