Grundläggande statistik
| Portföljvärde | $ 32 931 218 |
| Aktuella positioner | 101 |
Senaste innehav, resultat, förvaltat kapital (från 13F, 13D)
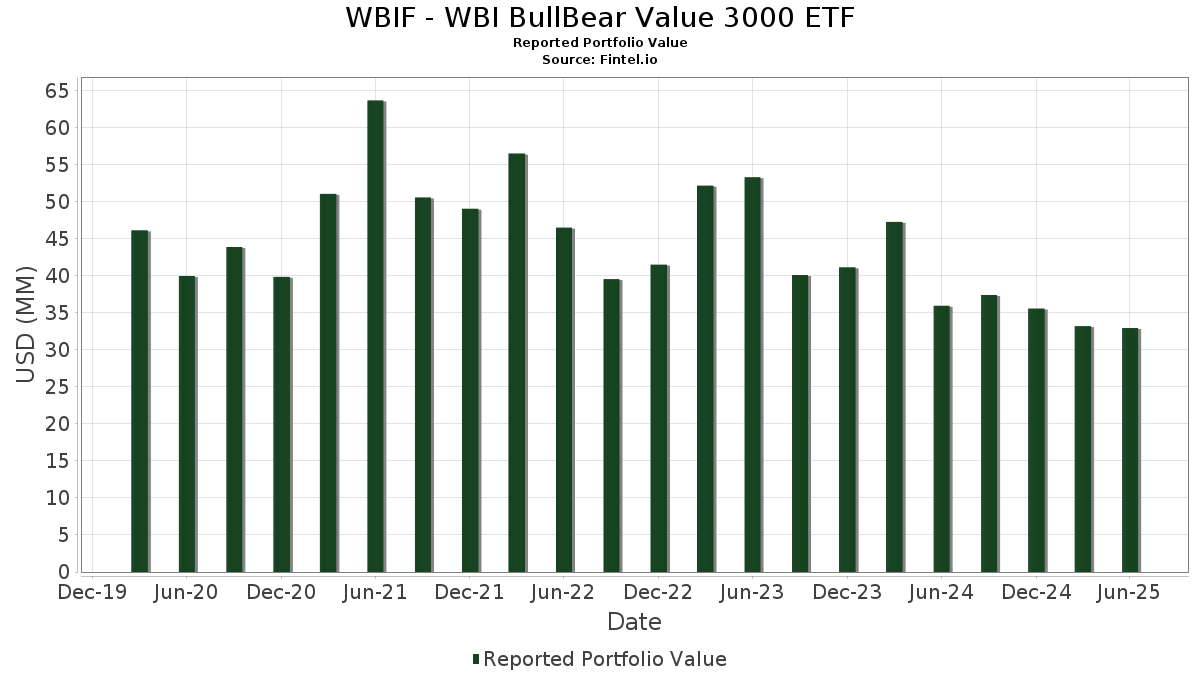
WBIF - WBI BullBear Value 3000 ETF har redovisat 101 totala innehav i sina senaste SEC-arkiveringar. Det senaste portföljvärdet beräknas vara $ 32 931 218 USD. Faktiskt förvaltade tillgångar (AUM) är detta värde plus likvida medel (som inte redovisas). WBIF - WBI BullBear Value 3000 ETFs största innehav är NVIDIA Corporation (US:NVDA) , Meta Platforms, Inc. (US:META) , Microsoft Corporation (US:MSFT) , Comfort Systems USA, Inc. (US:FIX) , and Amazon.com, Inc. (US:AMZN) . WBIF - WBI BullBear Value 3000 ETFs nya positioner inkluderar FedEx Corporation (US:FDX) , Williams-Sonoma, Inc. (US:WSM) , The Charles Schwab Corporation (US:SCHW) , Vertiv Holdings Co (US:VRT) , and ServiceNow, Inc. (US:NOW) .
Största ökningarna detta kvartal
Vi använder förändringen i portföljallokeringen eftersom det är det mest meningsfulla måttet. Förändringar kan bero på transaktioner eller förändringar i aktiekurser.
| Värdepapper | Aktier (MM) |
Värde (MM$) |
Portfölj % av | ΔPortfölj % av |
|---|---|---|---|---|
| 4,41 | 4,41 | 15,4762 | 15,4762 | |
| 0,74 | 0,74 | 2,5800 | 2,5800 | |
| 0,00 | 0,52 | 1,8175 | 1,8175 | |
| 0,00 | 0,51 | 1,7958 | 1,7958 | |
| 0,00 | 0,48 | 1,6746 | 1,6746 | |
| 0,00 | 0,43 | 1,5077 | 1,5077 | |
| 0,01 | 0,41 | 1,4417 | 1,4417 | |
| 0,00 | 0,65 | 2,2752 | 1,2886 | |
| 0,00 | 0,36 | 1,2568 | 1,2568 | |
| 0,00 | 0,60 | 2,1124 | 1,2499 |
Största minskningarna detta kvartal
Vi använder förändringen i portföljallokeringen eftersom det är det mest meningsfulla måttet. Förändringar kan bero på transaktioner eller förändringar i aktiepriser.
| Värdepapper | Aktier (MM) |
Värde (MM$) |
Portfölj % av | ΔPortfölj % av |
|---|---|---|---|---|
| 0,00 | 0,10 | 0,3605 | −3,8511 | |
| 0,00 | 0,14 | 0,4948 | −3,5834 | |
| 0,00 | 0,24 | 0,8300 | −3,5524 | |
| 0,00 | 0,17 | 0,5940 | −3,5264 | |
| 0,04 | 0,35 | 1,2193 | −3,2825 | |
| 0,00 | 0,28 | 0,9766 | −3,2423 | |
| 0,00 | 0,31 | 1,0747 | −2,9666 | |
| 0,00 | 0,11 | 0,3737 | −2,8726 | |
| 0,00 | 0,27 | 0,9422 | −2,8074 | |
| 0,00 | 0,33 | 1,1671 | −2,7108 |
13F- och fond arkiveringar
Denna blankett lämnades in den 2025-08-28 för rapporteringsperioden 2025-06-30. Klicka på länksymbolen för att se hela transaktionshistoriken.
Uppgradera för att låsa upp premiumdata och exportera till Excel![]() .
.
| Värdepapper | Typ | Genomsnittligt aktiepris | Aktier (MM) |
ΔAktier (%) |
ΔAktier (%) |
Värde ($MM) |
Portfölj (%) |
ΔPortfölj (%) |
|
|---|---|---|---|---|---|---|---|---|---|
| Mount Vernon Liquid Assets Portfolio, LLC / STIV (N/A) | 4,41 | 4,41 | 15,4762 | 15,4762 | |||||
| US BANK MMDA - USBFS 2 / STIV (N/A) | 0,74 | 0,74 | 2,5800 | 2,5800 | |||||
| NVDA / NVIDIA Corporation | 0,00 | −27,84 | 0,66 | 5,11 | 2,3104 | 0,2124 | |||
| META / Meta Platforms, Inc. | 0,00 | 72,02 | 0,65 | 120,41 | 2,2752 | 1,2886 | |||
| MSFT / Microsoft Corporation | 0,00 | −30,96 | 0,61 | −8,57 | 2,1351 | −0,0944 | |||
| FIX / Comfort Systems USA, Inc. | 0,00 | −57,33 | 0,61 | −41,41 | 2,1305 | −0,9843 | |||
| AMZN / Amazon.com, Inc. | 0,00 | 27,59 | 0,60 | 47,19 | 2,1135 | 0,7413 | |||
| GOOGL / Alphabet Inc. | 0,00 | 105,29 | 0,60 | 134,24 | 2,1124 | 1,2499 | |||
| IBKR / Interactive Brokers Group, Inc. | 0,01 | 25,52 | 0,56 | −57,97 | 1,9781 | −2,5204 | |||
| AAPL / Apple Inc. | 0,00 | −21,82 | 0,56 | −27,83 | 1,9492 | −0,6291 | |||
| PAG / Penske Automotive Group, Inc. | 0,00 | 15,19 | 0,55 | 21,81 | 1,9419 | 0,5761 | |||
| WRB / W. R. Berkley Corporation | 0,01 | −53,26 | 0,53 | −41,32 | 1,8744 | −1,0675 | |||
| FANG / Diamondback Energy, Inc. | 0,00 | −42,45 | 0,53 | −42,35 | 1,8638 | −0,0857 | |||
| AMAT / Applied Materials, Inc. | 0,00 | 17,94 | 0,53 | 6,71 | 1,8445 | 0,3652 | |||
| FDX / FedEx Corporation | 0,00 | 0,52 | 1,8175 | 1,8175 | |||||
| MLI / Mueller Industries, Inc. | 0,01 | 85,66 | 0,51 | 93,96 | 1,8043 | 0,9149 | |||
| YUMC / Yum China Holdings, Inc. | 0,01 | 90,43 | 0,51 | 63,58 | 1,7969 | 0,7474 | |||
| DTE / DTE Energy Company | 0,00 | 0,51 | 1,7958 | 1,7958 | |||||
| PRI / Primerica, Inc. | 0,00 | 3,19 | 0,50 | −0,80 | 1,7371 | 0,0654 | |||
| TTEK / Tetra Tech, Inc. | 0,01 | 52,58 | 0,48 | 87,94 | 1,6943 | 0,8315 | |||
| WSM / Williams-Sonoma, Inc. | 0,00 | 0,48 | 1,6746 | 1,6746 | |||||
| OXY / Occidental Petroleum Corporation | 0,01 | −39,50 | 0,48 | −50,72 | 1,6745 | −1,2358 | |||
| SCHW / The Charles Schwab Corporation | 0,00 | 0,43 | 1,5077 | 1,5077 | |||||
| HPQ / HP Inc. | 0,02 | −65,75 | 0,43 | −77,78 | 1,4925 | −2,4163 | |||
| MNST / Monster Beverage Corporation | 0,01 | 0,41 | 1,4417 | 1,4417 | |||||
| VRT / Vertiv Holdings Co | 0,00 | 0,36 | 1,2568 | 1,2568 | |||||
| ADT / ADT Inc. | 0,04 | −75,14 | 0,35 | −74,16 | 1,2193 | −3,2825 | |||
| EMR / Emerson Electric Co. | 0,00 | 0,34 | 1,1769 | 1,1769 | |||||
| EA / Electronic Arts Inc. | 0,00 | −81,94 | 0,33 | −78,30 | 1,1671 | −2,7108 | |||
| AMP / Ameriprise Financial, Inc. | 0,00 | 0,33 | 1,1418 | 1,1418 | |||||
| EBAY / eBay Inc. | 0,00 | −77,27 | 0,32 | −72,73 | 1,1388 | −2,6995 | |||
| NOW / ServiceNow, Inc. | 0,00 | 0,32 | 1,1177 | 1,1177 | |||||
| TKO / TKO Group Holdings, Inc. | 0,00 | 0,31 | 1,0981 | 1,0981 | |||||
| ARES / Ares Management Corporation | 0,00 | 0,31 | 1,0860 | 1,0860 | |||||
| CSCO / Cisco Systems, Inc. | 0,00 | −85,25 | 0,31 | −80,98 | 1,0747 | −2,9666 | |||
| LW / Lamb Weston Holdings, Inc. | 0,01 | 0,29 | 1,0299 | 1,0299 | |||||
| WTW / Willis Towers Watson Public Limited Company | 0,00 | 0,29 | 1,0125 | 1,0125 | |||||
| V / Visa Inc. | 0,00 | 127,53 | 0,29 | 131,45 | 1,0085 | 0,5906 | |||
| GILD / Gilead Sciences, Inc. | 0,00 | 0,28 | 0,9985 | 0,9985 | |||||
| ANSS / ANSYS, Inc. | 0,00 | 0,28 | 0,9977 | 0,9977 | |||||
| VRSK / Verisk Analytics, Inc. | 0,00 | −87,34 | 0,28 | −83,30 | 0,9766 | −3,2423 | |||
| DKS / DICK'S Sporting Goods, Inc. | 0,00 | −37,55 | 0,27 | −46,03 | 0,9552 | −0,6746 | |||
| LRCX / Lam Research Corporation | 0,00 | −82,07 | 0,27 | −76,05 | 0,9422 | −2,8074 | |||
| CRM / Salesforce, Inc. | 0,00 | 0,27 | 0,9295 | 0,9295 | |||||
| KLAC / KLA Corporation | 0,00 | −56,49 | 0,26 | −38,17 | 0,9267 | −0,4532 | |||
| SF / Stifel Financial Corp. | 0,00 | 0,25 | 0,8917 | 0,8917 | |||||
| AXP / American Express Company | 0,00 | −51,36 | 0,25 | −47,81 | 0,8781 | −0,6691 | |||
| R / Ryder System, Inc. | 0,00 | −35,66 | 0,24 | −34,93 | 0,8581 | −0,3538 | |||
| ESNT / Essent Group Ltd. | 0,00 | 0,24 | 0,8576 | 0,8576 | |||||
| J / Jacobs Solutions Inc. | 0,00 | 0,24 | 0,8570 | 0,8570 | |||||
| LNG / Cheniere Energy, Inc. | 0,00 | 0,24 | 0,8523 | 0,8523 | |||||
| RMD / ResMed Inc. | 0,00 | −54,29 | 0,24 | −47,38 | 0,8478 | −0,6894 | |||
| CBOE / Cboe Global Markets, Inc. | 0,00 | −74,89 | 0,24 | −74,22 | 0,8416 | −2,2648 | |||
| HRB / H&R Block, Inc. | 0,00 | −31,37 | 0,24 | −40,80 | 0,8368 | −0,3730 | |||
| NEU / NewMarket Corporation | 0,00 | −56,88 | 0,24 | −47,46 | 0,8359 | −0,6821 | |||
| MCK / McKesson Corporation | 0,00 | −83,38 | 0,24 | −81,96 | 0,8300 | −3,5524 | |||
| LEN / Lennar Corporation | 0,00 | −18,80 | 0,24 | −52,04 | 0,8243 | −0,6503 | |||
| CF / CF Industries Holdings, Inc. | 0,00 | −24,92 | 0,23 | −11,70 | 0,8224 | −0,0664 | |||
| MTG / MGIC Investment Corporation | 0,01 | 0,23 | 0,8224 | 0,8224 | |||||
| CSL / Carlisle Companies Incorporated | 0,00 | −43,13 | 0,23 | −52,83 | 0,8184 | −0,6671 | |||
| OC / Owens Corning | 0,00 | 0,23 | 0,8136 | 0,8136 | |||||
| EXP / Eagle Materials Inc. | 0,00 | −23,34 | 0,23 | −46,03 | 0,8101 | −0,4789 | |||
| UNH / UnitedHealth Group Incorporated | 0,00 | 301,67 | 0,23 | 139,36 | 0,7910 | 0,4752 | |||
| HIG / The Hartford Insurance Group, Inc. | 0,00 | −74,74 | 0,22 | −74,16 | 0,7884 | −2,1191 | |||
| G / Genpact Limited | 0,01 | 143,39 | 0,22 | 112,50 | 0,7783 | 0,4287 | |||
| TXRH / Texas Roadhouse, Inc. | 0,00 | −19,41 | 0,22 | −9,50 | 0,7696 | −0,0414 | |||
| ACN / Accenture plc | 0,00 | 0,22 | 0,7610 | 0,7610 | |||||
| ADP / Automatic Data Processing, Inc. | 0,00 | −50,92 | 0,21 | −48,18 | 0,7506 | −0,5864 | |||
| NEE / NextEra Energy, Inc. | 0,00 | 0,21 | 0,7333 | 0,7333 | |||||
| STZ / Constellation Brands, Inc. | 0,00 | 0,20 | 0,7000 | 0,7000 | |||||
| FCFS / FirstCash Holdings, Inc. | 0,00 | 44,69 | 0,19 | 63,25 | 0,6720 | 0,2770 | |||
| VST / Vistra Corp. | 0,00 | −98,97 | 0,17 | −89,44 | 0,5940 | −3,5264 | |||
| ROK / Rockwell Automation, Inc. | 0,00 | 0,15 | 0,5195 | 0,5195 | |||||
| BX / Blackstone Inc. | 0,00 | 0,14 | 0,4994 | 0,4994 | |||||
| PH / Parker-Hannifin Corporation | 0,00 | −95,65 | 0,14 | −92,22 | 0,4948 | −3,5834 | |||
| WAB / Westinghouse Air Brake Technologies Corporation | 0,00 | 0,14 | 0,4926 | 0,4926 | |||||
| ABBV / AbbVie Inc. | 0,00 | 0,14 | 0,4837 | 0,4837 | |||||
| BR / Broadridge Financial Solutions, Inc. | 0,00 | −72,02 | 0,14 | −68,51 | 0,4824 | −0,8250 | |||
| AME / AMETEK, Inc. | 0,00 | 0,14 | 0,4817 | 0,4817 | |||||
| TMUS / T-Mobile US, Inc. | 0,00 | 0,14 | 0,4754 | 0,4754 | |||||
| ROL / Rollins, Inc. | 0,00 | 0,14 | 0,4739 | 0,4739 | |||||
| CHTR / Charter Communications, Inc. | 0,00 | 0,13 | 0,4645 | 0,4645 | |||||
| COST / Costco Wholesale Corporation | 0,00 | 0,13 | 0,4617 | 0,4617 | |||||
| LAD / Lithia Motors, Inc. | 0,00 | 0,11 | 0,3755 | 0,3755 | |||||
| BYD / Boyd Gaming Corporation | 0,00 | −90,17 | 0,11 | −89,45 | 0,3737 | −2,8726 | |||
| SCI / Service Corporation International | 0,00 | −9,85 | 0,11 | −8,70 | 0,3711 | −0,0163 | |||
| EQH / Equitable Holdings, Inc. | 0,00 | −8,12 | 0,11 | −0,94 | 0,3695 | 0,0128 | |||
| NFG / National Fuel Gas Company | 0,00 | −19,94 | 0,11 | −13,93 | 0,3687 | −0,0425 | |||
| LECO / Lincoln Electric Holdings, Inc. | 0,00 | 0,10 | 0,3643 | 0,3643 | |||||
| GL / Globe Life Inc. | 0,00 | −92,93 | 0,10 | −92,17 | 0,3605 | −3,8511 | |||
| AIT / Applied Industrial Technologies, Inc. | 0,00 | 0,10 | 0,3579 | 0,3579 | |||||
| THG / The Hanover Insurance Group, Inc. | 0,00 | −16,62 | 0,10 | −18,55 | 0,3556 | −0,0616 | |||
| GPI / Group 1 Automotive, Inc. | 0,00 | −45,61 | 0,10 | −43,50 | 0,3507 | −0,2224 | |||
| AIZ / Assurant, Inc. | 0,00 | −81,97 | 0,10 | −83,08 | 0,3484 | −1,6119 | |||
| RL / Ralph Lauren Corporation | 0,00 | 0,10 | 0,3463 | 0,3463 | |||||
| SLGN / Silgan Holdings Inc. | 0,00 | 0,10 | 0,3412 | 0,3412 | |||||
| AVY / Avery Dennison Corporation | 0,00 | −11,90 | 0,10 | −12,73 | 0,3372 | −0,0336 | |||
| LPX / Louisiana-Pacific Corporation | 0,00 | 0,09 | 0,3302 | 0,3302 | |||||
| VNOM / Viper Energy, Inc. | 0,00 | 0,09 | 0,3260 | 0,3260 | |||||
| KBR / KBR, Inc. | 0,00 | −17,32 | 0,09 | −20,18 | 0,3065 | −0,0614 | |||
| DCI / Donaldson Company, Inc. | 0,00 | 0,07 | 0,2610 | 0,2610 | |||||
| BAH / Booz Allen Hamilton Holding Corporation | 0,00 | −100,00 | 0,00 | −100,00 | −0,3195 | ||||
| LLY / Eli Lilly and Company | 0,00 | −100,00 | 0,00 | −100,00 | −0,4952 | ||||
| AVGO / Broadcom Inc. | 0,00 | −100,00 | 0,00 | −100,00 | −0,6153 | ||||
| CVS / CVS Health Corporation | 0,00 | −100,00 | 0,00 | −100,00 | −1,6424 | ||||
| TSLA / Tesla, Inc. | 0,00 | −100,00 | 0,00 | −100,00 | −0,4506 | ||||
| AEP / American Electric Power Company, Inc. | 0,00 | −100,00 | 0,00 | −100,00 | −1,3920 | ||||
| BRK.B / Berkshire Hathaway Inc. | 0,00 | −100,00 | 0,00 | −100,00 | −0,7457 |