Grundläggande statistik
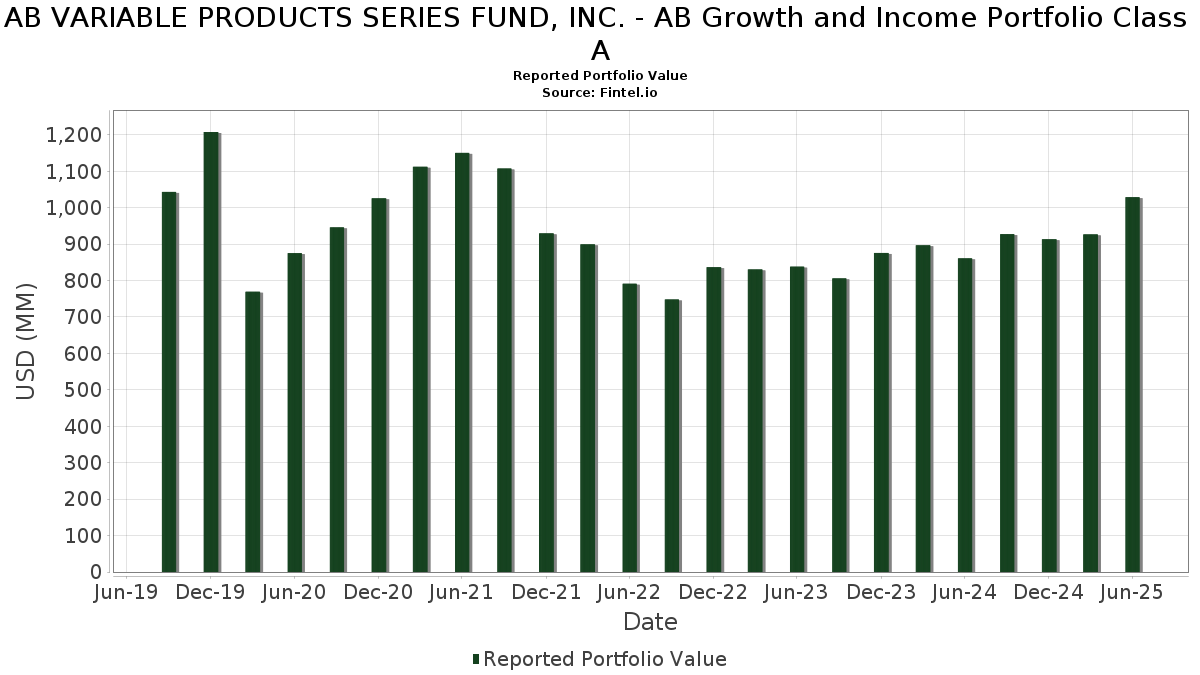
| Portföljvärde | $ 1 028 771 071 |
| Aktuella positioner | 74 |
Senaste innehav, resultat, förvaltat kapital (från 13F, 13D)
AB VARIABLE PRODUCTS SERIES FUND, INC. - AB Growth and Income Portfolio Class A har redovisat 74 totala innehav i sina senaste SEC-arkiveringar. Det senaste portföljvärdet beräknas vara $ 1 028 771 071 USD. Faktiskt förvaltade tillgångar (AUM) är detta värde plus likvida medel (som inte redovisas). AB VARIABLE PRODUCTS SERIES FUND, INC. - AB Growth and Income Portfolio Class As största innehav är JPMorgan Chase & Co. (US:JPM) , Berkshire Hathaway Inc. (US:BRK.B) , Philip Morris International Inc. (US:PM) , Johnson & Johnson (US:JNJ) , and Walmart Inc. (US:WMT) . AB VARIABLE PRODUCTS SERIES FUND, INC. - AB Growth and Income Portfolio Class As nya positioner inkluderar The Walt Disney Company (US:DIS) , AT&T Inc. (US:T) , Agilent Technologies, Inc. (US:A) , Uber Technologies, Inc. (US:UBER) , and Mondelez International, Inc. (US:MDLZ) .
Största ökningarna detta kvartal
Vi använder förändringen i portföljallokeringen eftersom det är det mest meningsfulla måttet. Förändringar kan bero på transaktioner eller förändringar i aktiekurser.
| Värdepapper | Aktier (MM) |
Värde (MM$) |
Portfölj % av | ΔPortfölj % av |
|---|---|---|---|---|
| 0,14 | 17,42 | 1,6565 | 1,6565 | |
| 0,43 | 12,49 | 1,1878 | 1,1878 | |
| 0,09 | 10,46 | 0,9948 | 0,9948 | |
| 0,11 | 10,13 | 0,9634 | 0,9634 | |
| 0,15 | 44,23 | 4,2051 | 0,9184 | |
| 0,11 | 7,72 | 0,7335 | 0,7335 | |
| 0,19 | 15,50 | 1,4735 | 0,6039 | |
| 0,02 | 5,36 | 0,5095 | 0,5095 | |
| 0,01 | 4,96 | 0,4718 | 0,4718 | |
| 0,13 | 26,48 | 2,5171 | 0,4436 |
Största minskningarna detta kvartal
Vi använder förändringen i portföljallokeringen eftersom det är det mest meningsfulla måttet. Förändringar kan bero på transaktioner eller förändringar i aktiepriser.
| Värdepapper | Aktier (MM) |
Värde (MM$) |
Portfölj % av | ΔPortfölj % av |
|---|---|---|---|---|
| 12,76 | 12,76 | 1,2128 | −2,1852 | |
| 0,13 | 22,47 | 2,1361 | −1,1868 | |
| 0,24 | 20,44 | 1,9432 | −1,0348 | |
| 0,22 | 39,22 | 3,7292 | −0,9337 | |
| 0,11 | 8,43 | 0,8014 | −0,8362 | |
| 0,06 | 7,62 | 0,7247 | −0,8020 | |
| 0,07 | 6,34 | 0,6032 | −0,6594 | |
| 0,18 | 19,52 | 1,8558 | −0,6431 | |
| 0,08 | 22,64 | 2,1524 | −0,6075 | |
| 0,04 | 19,94 | 1,8956 | −0,5675 |
13F- och fond arkiveringar
Denna blankett lämnades in den 2025-08-26 för rapporteringsperioden 2025-06-30. Klicka på länksymbolen för att se hela transaktionshistoriken.
Uppgradera för att låsa upp premiumdata och exportera till Excel![]() .
.
| Värdepapper | Typ | Genomsnittligt aktiepris | Aktier (MM) |
ΔAktier (%) |
ΔAktier (%) |
Värde ($MM) |
Portfölj (%) |
ΔPortfölj (%) |
|
|---|---|---|---|---|---|---|---|---|---|
| JPM / JPMorgan Chase & Co. | 0,15 | 22,71 | 44,23 | 45,03 | 4,2051 | 0,9184 | |||
| BRK.B / Berkshire Hathaway Inc. | 0,08 | 13,86 | 40,91 | 3,85 | 3,8891 | −0,3557 | |||
| PM / Philip Morris International Inc. | 0,22 | −20,99 | 39,22 | −9,35 | 3,7292 | −0,9337 | |||
| JNJ / Johnson & Johnson | 0,25 | 31,12 | 38,06 | 20,77 | 3,6186 | 0,2224 | |||
| WMT / Walmart Inc. | 0,34 | −0,46 | 33,31 | 10,87 | 3,1669 | −0,0709 | |||
| RTX / RTX Corporation | 0,22 | 19,20 | 32,00 | 31,40 | 3,0426 | 0,4180 | |||
| EOG / EOG Resources, Inc. | 0,22 | 31,74 | 26,64 | 22,87 | 2,5332 | 0,1963 | |||
| TXN / Texas Instruments Incorporated | 0,13 | 19,10 | 26,48 | 37,60 | 2,5171 | 0,4436 | |||
| SPGI / S&P Global Inc. | 0,05 | −5,82 | 24,84 | −2,26 | 2,3617 | −0,3772 | |||
| ELV / Elevance Health, Inc. | 0,06 | 42,90 | 23,04 | 27,79 | 2,1903 | 0,2474 | |||
| ACN / Accenture plc | 0,08 | −7,71 | 22,64 | −11,60 | 2,1524 | −0,6075 | |||
| FI / Fiserv, Inc. | 0,13 | −6,67 | 22,47 | −27,13 | 2,1361 | −1,1868 | |||
| AXV / AXIS Capital Holdings Limited | 0,21 | 10,03 | 21,51 | 13,96 | 2,0445 | 0,0110 | |||
| C / Citigroup Inc. | 0,24 | −38,32 | 20,44 | −26,04 | 1,9432 | −1,0348 | |||
| REGN / Regeneron Pharmaceuticals, Inc. | 0,04 | 5,38 | 19,94 | −12,77 | 1,8956 | −0,5675 | |||
| WFC / Wells Fargo & Company | 0,25 | 15,98 | 19,89 | 29,45 | 1,8911 | 0,2351 | |||
| GILD / Gilead Sciences, Inc. | 0,18 | −14,92 | 19,52 | −15,82 | 1,8558 | −0,6431 | |||
| DGX / Quest Diagnostics Incorporated | 0,10 | 37,09 | 17,85 | 45,54 | 1,6971 | 0,3753 | |||
| GNRC / Generac Holdings Inc. | 0,12 | 25,59 | 17,83 | 42,02 | 1,6951 | 0,3421 | |||
| DIS / The Walt Disney Company | 0,14 | 17,42 | 1,6565 | 1,6565 | |||||
| COR / Cencora, Inc. | 0,06 | −21,62 | 17,14 | −15,49 | 1,6294 | −0,5560 | |||
| VLTO / Veralto Corporation | 0,17 | 24,30 | 16,70 | 28,77 | 1,5874 | 0,1900 | |||
| TSM / Taiwan Semiconductor Manufacturing Company Limited - Depositary Receipt (Common Stock) | 0,07 | 0,77 | 15,78 | 37,49 | 1,5001 | 0,2633 | |||
| WAB / Westinghouse Air Brake Technologies Corporation | 0,07 | 15,70 | 15,53 | 33,57 | 1,4761 | 0,2234 | |||
| MET / MetLife, Inc. | 0,19 | 91,75 | 15,50 | 92,07 | 1,4735 | 0,6039 | |||
| DKS / DICK'S Sporting Goods, Inc. | 0,07 | 43,94 | 14,29 | 41,26 | 1,3589 | 0,2685 | |||
| EA / Electronic Arts Inc. | 0,09 | −9,96 | 14,12 | −0,50 | 1,3429 | −0,1869 | |||
| MA / Mastercard Incorporated | 0,03 | 50,17 | 14,09 | 53,97 | 1,3400 | 0,3534 | |||
| ULTA / Ulta Beauty, Inc. | 0,03 | −10,56 | 13,33 | 14,16 | 1,2677 | 0,0089 | |||
| CMCSA / Comcast Corporation | 0,36 | 1,12 | 12,82 | −2,20 | 1,2187 | −0,1937 | |||
| US0186167484 / AB Fixed Income Shares, Inc. - Government Money Market Portfolio | 12,76 | −59,54 | 12,76 | −59,54 | 1,2128 | −2,1852 | |||
| HCA / HCA Healthcare, Inc. | 0,03 | 29,73 | 12,61 | 43,83 | 1,1984 | 0,2540 | |||
| T / AT&T Inc. | 0,43 | 12,49 | 1,1878 | 1,1878 | |||||
| CVX / Chevron Corporation | 0,09 | −10,31 | 12,38 | −23,24 | 1,1766 | −0,5607 | |||
| CSX / CSX Corporation | 0,36 | 56,53 | 11,86 | 73,55 | 1,1273 | 0,3910 | |||
| RHHBY / Roche Holding AG - Depositary Receipt (Common Stock) | 0,29 | 7,88 | 11,74 | 6,85 | 1,1164 | −0,0678 | |||
| CASY / Casey's General Stores, Inc. | 0,02 | −22,63 | 11,67 | −9,04 | 1,1097 | −0,2732 | |||
| COP / ConocoPhillips | 0,13 | 17,69 | 11,35 | 0,56 | 1,0792 | −0,1372 | |||
| ROST / Ross Stores, Inc. | 0,08 | 11,54 | 10,57 | 11,35 | 1,0051 | −0,0180 | |||
| PSA / Public Storage | 0,04 | 38,18 | 10,47 | 35,48 | 0,9958 | 0,1626 | |||
| JBHT / J.B. Hunt Transport Services, Inc. | 0,07 | −23,50 | 10,47 | −25,75 | 0,9954 | −0,5242 | |||
| A / Agilent Technologies, Inc. | 0,09 | 10,46 | 0,9948 | 0,9948 | |||||
| UBER / Uber Technologies, Inc. | 0,11 | 10,13 | 0,9634 | 0,9634 | |||||
| OTIS / Otis Worldwide Corporation | 0,10 | 50,16 | 9,96 | 44,07 | 0,9465 | 0,2018 | |||
| PPG / PPG Industries, Inc. | 0,09 | 41,74 | 9,94 | 47,46 | 0,9452 | 0,2186 | |||
| STLD / Steel Dynamics, Inc. | 0,07 | −3,12 | 9,48 | −0,85 | 0,9011 | −0,1290 | |||
| CF / CF Industries Holdings, Inc. | 0,10 | −10,06 | 9,33 | 5,88 | 0,8872 | −0,0626 | |||
| PCAR / PACCAR Inc | 0,10 | 67,50 | 9,20 | 63,53 | 0,8749 | 0,2685 | |||
| LOW / Lowe's Companies, Inc. | 0,04 | 169,33 | 8,82 | 134,61 | 0,8385 | 0,4298 | |||
| NKE / NIKE, Inc. | 0,12 | −34,03 | 8,54 | −26,18 | 0,8117 | −0,4346 | |||
| NICE / NICE Ltd. - Depositary Receipt (Common Stock) | 0,05 | 19,37 | 8,46 | 30,79 | 0,8041 | 0,1072 | |||
| GEHC / GE HealthCare Technologies Inc. | 0,11 | −39,55 | 8,43 | −44,53 | 0,8014 | −0,8362 | |||
| MDLZ / Mondelez International, Inc. | 0,11 | 7,72 | 0,7335 | 0,7335 | |||||
| PSX / Phillips 66 | 0,06 | −44,31 | 7,62 | −46,20 | 0,7247 | −0,8020 | |||
| UTHR / United Therapeutics Corporation | 0,03 | −4,57 | 7,33 | −11,05 | 0,6964 | −0,1910 | |||
| ALLE / Allegion plc | 0,05 | 15,91 | 7,32 | 28,06 | 0,6960 | 0,0799 | |||
| MSM / MSC Industrial Direct Co., Inc. | 0,09 | 42,93 | 7,30 | 56,47 | 0,6941 | 0,1913 | |||
| BXSL / Blackstone Secured Lending Fund | 0,22 | 11,81 | 6,64 | 6,25 | 0,6315 | −0,0422 | |||
| ALSN / Allison Transmission Holdings, Inc. | 0,07 | 20,98 | 6,53 | 20,11 | 0,6207 | 0,0350 | |||
| SBUX / Starbucks Corporation | 0,07 | −42,03 | 6,34 | −45,85 | 0,6032 | −0,6594 | |||
| NVT / nVent Electric plc | 0,08 | −25,89 | 6,04 | 3,55 | 0,5739 | −0,0543 | |||
| LRCX / Lam Research Corporation | 0,06 | −42,26 | 5,48 | −22,69 | 0,5212 | −0,2430 | |||
| ZBRA / Zebra Technologies Corporation | 0,02 | 5,36 | 0,5095 | 0,5095 | |||||
| CW / Curtiss-Wright Corporation | 0,01 | −16,25 | 5,36 | 28,94 | 0,5093 | 0,0616 | |||
| MTG / MGIC Investment Corporation | 0,19 | 10,98 | 5,27 | 24,70 | 0,5012 | 0,0456 | |||
| CSCO / Cisco Systems, Inc. | 0,08 | 9,04 | 5,26 | 59,24 | 0,4997 | 0,1301 | |||
| BWA / BorgWarner Inc. | 0,15 | −5,16 | 5,16 | 10,83 | 0,4905 | −0,0112 | |||
| CSL / Carlisle Companies Incorporated | 0,01 | 4,96 | 0,4718 | 0,4718 | |||||
| FCN / FTI Consulting, Inc. | 0,03 | −10,43 | 4,29 | −11,84 | 0,4078 | −0,1165 | |||
| RMD / ResMed Inc. | 0,02 | 4,15 | 0,3947 | 0,3947 | |||||
| WHD / Cactus, Inc. | 0,08 | 100,94 | 3,61 | 91,72 | 0,3436 | 0,1404 | |||
| LULU / lululemon athletica inc. | 0,01 | −48,70 | 3,37 | −56,94 | 0,3204 | −0,5231 | |||
| LSTR / Landstar System, Inc. | 0,02 | 2,87 | 0,2728 | 0,2728 | |||||
| JLL / Jones Lang LaSalle Incorporated | 0,01 | 2,12 | 0,2018 | 0,2018 |