Grundläggande statistik
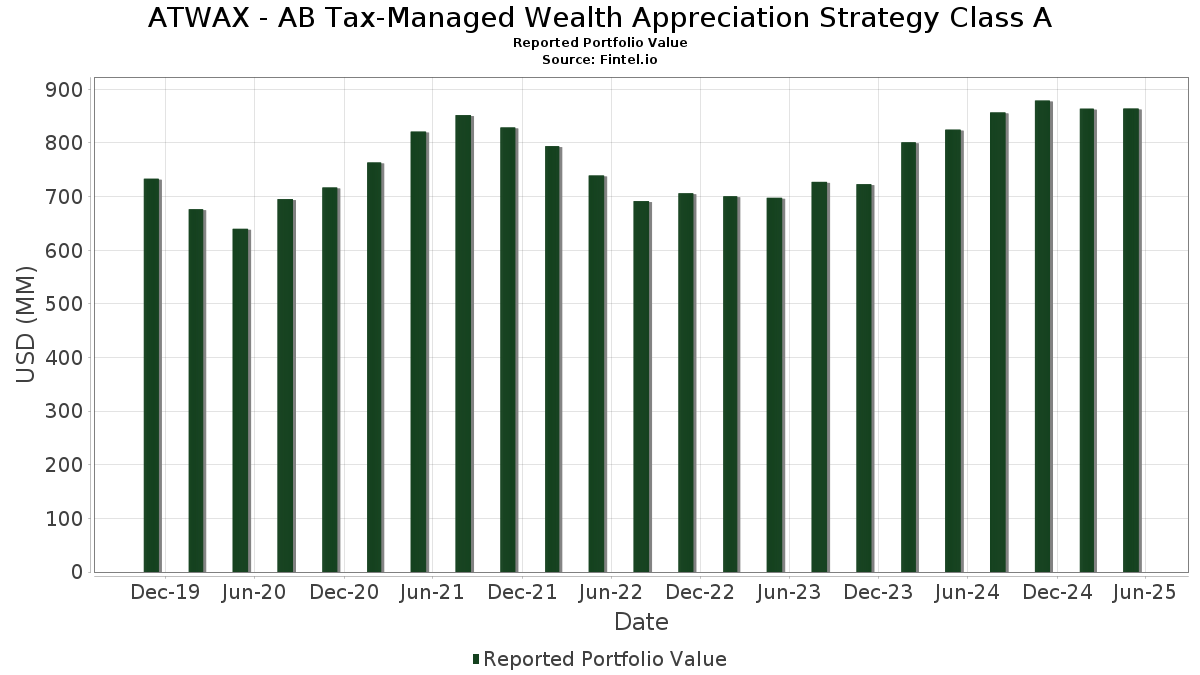
| Portföljvärde | $ 864 165 650 |
| Aktuella positioner | 95 |
Senaste innehav, resultat, förvaltat kapital (från 13F, 13D)
ATWAX - AB Tax-Managed Wealth Appreciation Strategy Class A har redovisat 95 totala innehav i sina senaste SEC-arkiveringar. Det senaste portföljvärdet beräknas vara $ 864 165 650 USD. Faktiskt förvaltade tillgångar (AUM) är detta värde plus likvida medel (som inte redovisas). ATWAX - AB Tax-Managed Wealth Appreciation Strategy Class As största innehav är Bernstein International Strategic Equities Portfolio (US:US0855678084) , Microsoft Corporation (US:MSFT) , NVIDIA Corporation (US:NVDA) , AB International Small Cap Portfolio (US:US0855678167) , and AB Discovery Value Fund (US:US0189148044) . ATWAX - AB Tax-Managed Wealth Appreciation Strategy Class As nya positioner inkluderar Dollar Tree, Inc. (US:DLTR) , .
Största ökningarna detta kvartal
Vi använder förändringen i portföljallokeringen eftersom det är det mest meningsfulla måttet. Förändringar kan bero på transaktioner eller förändringar i aktiekurser.
| Värdepapper | Aktier (MM) |
Värde (MM$) |
Portfölj % av | ΔPortfölj % av |
|---|---|---|---|---|
| 0,10 | 46,29 | 5,3545 | 0,7345 | |
| 0,07 | 17,13 | 1,9822 | 0,6582 | |
| 0,04 | 4,83 | 0,5585 | 0,3800 | |
| 0,27 | 36,24 | 4,1924 | 0,3642 | |
| 0,02 | 7,72 | 0,8936 | 0,3247 | |
| 2,49 | 34,37 | 3,9762 | 0,2517 | |
| 7,23 | 7,23 | 0,8363 | 0,2130 | |
| 0,01 | 4,64 | 0,5370 | 0,2062 | |
| 0,03 | 5,95 | 0,6878 | 0,2056 | |
| 0,03 | 2,87 | 0,3323 | 0,1870 |
Största minskningarna detta kvartal
Vi använder förändringen i portföljallokeringen eftersom det är det mest meningsfulla måttet. Förändringar kan bero på transaktioner eller förändringar i aktiepriser.
| Värdepapper | Aktier (MM) |
Värde (MM$) |
Portfölj % av | ΔPortfölj % av |
|---|---|---|---|---|
| 0,03 | 8,50 | 0,9837 | −0,5647 | |
| 0,11 | 21,60 | 2,4985 | −0,5115 | |
| 0,02 | 2,19 | 0,2536 | −0,3777 | |
| 0,04 | 3,69 | 0,4272 | −0,3197 | |
| 12,70 | 190,94 | 22,0887 | −0,2684 | |
| 0,01 | 4,14 | 0,4791 | −0,1982 | |
| 1,35 | 26,03 | 3,0108 | −0,1820 | |
| 0,03 | 4,52 | 0,5224 | −0,1504 | |
| 0,03 | 2,35 | 0,2722 | −0,1476 | |
| 0,17 | 6,30 | 0,7288 | −0,1388 |
13F- och fond arkiveringar
Denna blankett lämnades in den 2025-07-25 för rapporteringsperioden 2025-05-31. Klicka på länksymbolen för att se hela transaktionshistoriken.
Uppgradera för att låsa upp premiumdata och exportera till Excel![]() .
.
| Värdepapper | Typ | Genomsnittligt aktiepris | Aktier (MM) |
ΔAktier (%) |
ΔAktier (%) |
Värde ($MM) |
Portfölj (%) |
ΔPortfölj (%) |
|
|---|---|---|---|---|---|---|---|---|---|
| US0855678084 / Bernstein International Strategic Equities Portfolio | 12,70 | −10,35 | 190,94 | −1,15 | 22,0887 | −0,2684 | |||
| MSFT / Microsoft Corporation | 0,10 | 0,00 | 46,29 | 15,96 | 5,3545 | 0,7345 | |||
| NVDA / NVIDIA Corporation | 0,27 | 1,30 | 36,24 | 9,57 | 4,1924 | 0,3642 | |||
| US0855678167 / AB International Small Cap Portfolio | 2,49 | −6,43 | 34,37 | 6,82 | 3,9762 | 0,2517 | |||
| US0189148044 / AB Discovery Value Fund | 1,35 | 0,00 | 26,03 | −5,65 | 3,0108 | −0,1820 | |||
| AMZN / Amazon.com, Inc. | 0,12 | 2,00 | 23,61 | −1,49 | 2,7307 | −0,0430 | |||
| META / Meta Platforms, Inc. | 0,03 | 4,30 | 22,14 | 1,07 | 2,5609 | 0,0256 | |||
| AAPL / Apple Inc. | 0,11 | 0,00 | 21,60 | −16,95 | 2,4985 | −0,5115 | |||
| GOOG / Alphabet Inc. | 0,12 | 0,00 | 20,73 | 0,37 | 2,3986 | 0,0074 | |||
| US0186368033 / AB Discovery Growth Fund Inc | 1,63 | 0,00 | 20,07 | −3,61 | 2,3215 | −0,0882 | |||
| V / Visa Inc. | 0,05 | −4,74 | 19,91 | −4,09 | 2,3029 | −0,0994 | |||
| US0855684595 / Sanford C Bernstein Fund Inc - Emerging Markets Portfolio | 0,62 | 0,00 | 18,13 | 6,28 | 2,0971 | 0,1229 | |||
| US0855677250 / Bernstein Small Cap Core Portfolio | 1,57 | 0,00 | 17,57 | −3,61 | 2,0328 | −0,0772 | |||
| AVGO / Broadcom Inc. | 0,07 | 23,41 | 17,13 | 49,80 | 1,9822 | 0,6582 | |||
| WMT / Walmart Inc. | 0,14 | 0,00 | 13,70 | 0,12 | 1,5853 | 0,0009 | |||
| SCHW / The Charles Schwab Corporation | 0,13 | 0,82 | 11,84 | 11,98 | 1,3697 | 0,1459 | |||
| GS / The Goldman Sachs Group, Inc. | 0,02 | 11,36 | 10,93 | 7,45 | 1,2641 | 0,0871 | |||
| WFC / Wells Fargo & Company | 0,14 | 6,90 | 10,83 | 2,06 | 1,2534 | 0,0247 | |||
| ORCL / Oracle Corporation | 0,06 | 5,90 | 10,59 | 5,55 | 1,2246 | 0,0639 | |||
| PGR / The Progressive Corporation | 0,04 | 0,00 | 10,26 | 1,03 | 1,1865 | 0,0116 | |||
| DIS / The Walt Disney Company | 0,09 | 12,73 | 10,01 | 11,97 | 1,1582 | 0,1233 | |||
| BAC / Bank of America Corporation | 0,22 | 0,00 | 9,71 | −4,28 | 1,1238 | −0,0508 | |||
| ETN / Eaton Corporation plc | 0,03 | 0,00 | 9,19 | 9,17 | 1,0632 | 0,0887 | |||
| HD / The Home Depot, Inc. | 0,02 | 0,00 | 8,91 | −7,14 | 1,0306 | −0,0798 | |||
| UNH / UnitedHealth Group Incorporated | 0,03 | 0,00 | 8,50 | −36,44 | 0,9837 | −0,5647 | |||
| COST / Costco Wholesale Corporation | 0,01 | 0,00 | 8,32 | −0,80 | 0,9625 | −0,0083 | |||
| GEV / GE Vernova Inc. | 0,02 | 11,37 | 7,72 | 57,15 | 0,8936 | 0,3247 | |||
| TMUS / T-Mobile US, Inc. | 0,03 | 0,00 | 7,26 | −10,20 | 0,8397 | −0,0958 | |||
| US0186167484 / AB Fixed Income Shares, Inc. - Government Money Market Portfolio | 7,23 | 34,24 | 7,23 | 34,24 | 0,8363 | 0,2130 | |||
| AZO / AutoZone, Inc. | 0,00 | 0,00 | 6,86 | 6,87 | 0,7933 | 0,0506 | |||
| EOG / EOG Resources, Inc. | 0,06 | 33,17 | 6,33 | 13,89 | 0,7321 | 0,0890 | |||
| BKR / Baker Hughes Company | 0,17 | 1,16 | 6,30 | −15,96 | 0,7288 | −0,1388 | |||
| VRTX / Vertex Pharmaceuticals Incorporated | 0,01 | 0,00 | 6,15 | −7,86 | 0,7118 | −0,0612 | |||
| TSM / Taiwan Semiconductor Manufacturing Company Limited - Depositary Receipt (Common Stock) | 0,03 | 33,27 | 5,95 | 42,70 | 0,6878 | 0,2056 | |||
| PLD / Prologis, Inc. | 0,05 | 20,32 | 5,89 | 5,45 | 0,6810 | 0,0348 | |||
| PG / The Procter & Gamble Company | 0,03 | 0,00 | 5,80 | −2,28 | 0,6706 | −0,0160 | |||
| IQV / IQVIA Holdings Inc. | 0,04 | 13,24 | 5,59 | −15,82 | 0,6468 | −0,1221 | |||
| CMCSA / Comcast Corporation | 0,15 | 0,00 | 5,20 | −3,65 | 0,6011 | −0,0231 | |||
| CSX / CSX Corporation | 0,16 | 22,14 | 5,17 | 20,54 | 0,5983 | 0,1017 | |||
| KO / The Coca-Cola Company | 0,07 | 27,56 | 5,07 | 29,18 | 0,5869 | 0,1322 | |||
| LIN / Linde plc | 0,01 | −7,30 | 4,95 | −7,20 | 0,5730 | −0,0447 | |||
| CTVA / Corteva, Inc. | 0,07 | −1,26 | 4,94 | 10,99 | 0,5714 | 0,0563 | |||
| RTX / RTX Corporation | 0,04 | 121,68 | 4,83 | 237,55 | 0,5585 | 0,3800 | |||
| TMO / Thermo Fisher Scientific Inc. | 0,01 | 45,35 | 4,70 | 10,68 | 0,5443 | 0,0523 | |||
| VLTO / Veralto Corporation | 0,05 | 0,00 | 4,68 | 1,28 | 0,5415 | 0,0065 | |||
| SPGI / S&P Global Inc. | 0,01 | 69,05 | 4,64 | 62,44 | 0,5370 | 0,2062 | |||
| NXPI / NXP Semiconductors N.V. | 0,02 | 30,23 | 4,55 | 15,47 | 0,5269 | 0,0703 | |||
| FI / Fiserv, Inc. | 0,03 | 12,48 | 4,52 | −22,32 | 0,5224 | −0,1504 | |||
| AEP / American Electric Power Company, Inc. | 0,04 | 0,00 | 4,22 | −2,43 | 0,4885 | −0,0124 | |||
| ADBE / Adobe Inc. | 0,01 | −25,22 | 4,14 | −29,23 | 0,4791 | −0,1982 | |||
| WAT / Waters Corporation | 0,01 | 0,00 | 4,10 | −7,46 | 0,4749 | −0,0385 | |||
| DLR / Digital Realty Trust, Inc. | 0,02 | 0,00 | 4,10 | 9,74 | 0,4746 | 0,0418 | |||
| RHHBY / Roche Holding AG - Depositary Receipt (Common Stock) | 0,10 | −14,06 | 4,00 | −17,01 | 0,4627 | −0,0953 | |||
| DE / Deere & Company | 0,01 | −4,67 | 3,93 | 0,38 | 0,4544 | 0,0015 | |||
| LH / Labcorp Holdings Inc. | 0,02 | 1,62 | 3,81 | 0,79 | 0,4404 | 0,0032 | |||
| ZTS / Zoetis Inc. | 0,02 | 0,00 | 3,73 | 0,84 | 0,4313 | 0,0033 | |||
| MDT / Medtronic plc | 0,04 | −36,54 | 3,69 | −42,78 | 0,4272 | −0,3197 | |||
| WTW / Willis Towers Watson Public Limited Company | 0,01 | 36,63 | 3,34 | 27,36 | 0,3862 | 0,0827 | |||
| LLY / Eli Lilly and Company | 0,00 | 0,00 | 3,20 | −19,87 | 0,3704 | −0,0921 | |||
| NOW / ServiceNow, Inc. | 0,00 | 30,27 | 3,17 | 41,69 | 0,3669 | 0,1078 | |||
| AEE / Ameren Corporation | 0,03 | 0,00 | 3,16 | −4,62 | 0,3652 | −0,0179 | |||
| URI / United Rentals, Inc. | 0,00 | −2,03 | 3,14 | 8,05 | 0,3634 | 0,0269 | |||
| KLAC / KLA Corporation | 0,00 | −18,99 | 3,13 | −13,50 | 0,3619 | −0,0567 | |||
| OTIS / Otis Worldwide Corporation | 0,03 | 58,62 | 3,09 | 51,57 | 0,3570 | 0,1214 | |||
| HUBS / HubSpot, Inc. | 0,01 | 71,46 | 2,95 | 39,71 | 0,3415 | 0,0969 | |||
| BAH / Booz Allen Hamilton Holding Corporation | 0,03 | 128,45 | 2,87 | 128,84 | 0,3323 | 0,1870 | |||
| MRK / Merck & Co., Inc. | 0,03 | −8,73 | 2,62 | −23,99 | 0,3036 | −0,0960 | |||
| PNR / Pentair plc | 0,03 | 95,54 | 2,61 | 105,91 | 0,3021 | 0,1553 | |||
| SBUX / Starbucks Corporation | 0,03 | −10,50 | 2,35 | −35,14 | 0,2722 | −0,1476 | |||
| PCAR / PACCAR Inc | 0,02 | −54,07 | 2,19 | −59,81 | 0,2536 | −0,3777 | |||
| GOOGL / Alphabet Inc. | 0,01 | 0,00 | 2,11 | 0,81 | 0,2440 | 0,0019 | |||
| REGN / Regeneron Pharmaceuticals, Inc. | 0,00 | 12,24 | 2,09 | −21,22 | 0,2413 | −0,0653 | |||
| JPM / JPMorgan Chase & Co. | 0,01 | 0,00 | 2,08 | −0,29 | 0,2410 | −0,0007 | |||
| EW / Edwards Lifesciences Corporation | 0,03 | −14,27 | 1,99 | −6,35 | 0,2302 | −0,0158 | |||
| CVX / Chevron Corporation | 0,01 | −17,47 | 1,96 | −28,87 | 0,2266 | −0,0922 | |||
| CDW / CDW Corporation | 0,01 | 0,00 | 1,68 | 1,20 | 0,1949 | 0,0022 | |||
| H / Hyatt Hotels Corporation | 0,01 | 17,10 | 1,61 | 9,71 | 0,1857 | 0,0163 | |||
| ACM / AECOM | 0,01 | 0,00 | 1,59 | 9,75 | 0,1837 | 0,0163 | |||
| TXN / Texas Instruments Incorporated | 0,01 | 0,00 | 1,55 | −6,70 | 0,1788 | −0,0130 | |||
| JNJ / Johnson & Johnson | 0,01 | 0,00 | 1,49 | −5,94 | 0,1722 | −0,0110 | |||
| CCJ / Cameco Corporation | 0,03 | 0,00 | 1,47 | 32,88 | 0,1698 | 0,0420 | |||
| BKNG / Booking Holdings Inc. | 0,00 | 0,00 | 1,30 | 10,06 | 0,1507 | 0,0137 | |||
| ISRG / Intuitive Surgical, Inc. | 0,00 | 0,00 | 1,30 | −3,64 | 0,1503 | −0,0057 | |||
| LPLA / LPL Financial Holdings Inc. | 0,00 | 0,00 | 1,14 | 4,10 | 0,1322 | 0,0052 | |||
| DLTR / Dollar Tree, Inc. | 0,01 | 1,07 | 0,1235 | 0,1235 | |||||
| CSCO / Cisco Systems, Inc. | 0,01 | 0,00 | 0,90 | −1,64 | 0,1038 | −0,0018 | |||
| IR / Ingersoll Rand Inc. | 0,01 | 0,00 | 0,83 | −3,70 | 0,0965 | −0,0038 | |||
| NSC / Norfolk Southern Corporation | 0,00 | 0,00 | 0,74 | 0,54 | 0,0858 | 0,0004 | |||
| QCOM / QUALCOMM Incorporated | 0,00 | 0,00 | 0,66 | −7,62 | 0,0758 | −0,0063 | |||
| AMD / Advanced Micro Devices, Inc. | 0,00 | 0,00 | 0,45 | 10,78 | 0,0524 | 0,0051 | |||
| GEN / Gen Digital Inc. | 0,01 | 0,00 | 0,29 | 4,40 | 0,0330 | 0,0013 | |||
| PFE / Pfizer Inc. | 0,01 | 0,00 | 0,21 | −10,87 | 0,0237 | −0,0030 | |||
| WLK / Westlake Corporation | 0,00 | 0,00 | 0,13 | −36,84 | 0,0153 | −0,0089 | |||
| CBRE / CBRE Group, Inc. | 0,00 | 0,00 | 0,06 | −11,11 | 0,0065 | −0,0009 | |||
| GILD / Gilead Sciences, Inc. | 0,00 | 0,00 | 0,05 | −4,26 | 0,0052 | −0,0002 | |||
| ILMN / Illumina, Inc. | 0,00 | −100,00 | 0,00 | −100,00 | −0,1183 |